Flower Habitat Supplementation can Conserve Pollinators and Natural Enemies in Agricultural Ecosystem: Case Study in the Pepper Field
Abstract
Pollinators play important roles for crop production as well as maintenance of wild plants’ reproduction. Pollinator dependency in Korean agriculture have increased, but the degradation of habitat quality pose significant threats to pollination in agroecosystem. Provisioning flower habitat is one of the major activities to increase pollinator abundance and richness. We tested the effect of flower habitat supplementation on the pollinator, pest and natural enemy abundance in pepper field. Results showed that Hymenopteran pollinators were more abundant in the pepper plots close to the flower habitat. Among natural enemies, the similar pattern from pollinators was observed to parasitoids in the family of Eulophidae, but not to those of Ichneumonidae. There were no statistically significant differences of insect pests like aphids and thrips, as well as pepper production among plots in the pepper field. Even limited spatial scale, this study showed supplementing the flowering plant habitat to the agricultural landscape could conserve and boost pollinators and natural enemies, and possibly resulting better fruit production by pollination service.
Keywords:
Flower habitat, Honeybee, Ecosystem service, Parasitoid, PepperINTRODUCTION
Human existence depends on many natural processes and ecosystem services (Garibaldi et al., 2013). Ecosystem services directly or indirectly benefit the human welfare and functionally determined as supporting, provisioning, regulating and cultural service (Daily, 1997). Pollination is one of the most important ecosystem services for plants and animal as well, and formed specialized plant-pollinator relationship (Ollerton et al., 2011). Approximately, 84% of crop species cultivated in Europe have been directly pollinated by insect pollinators like bees (Williams, 1994). From over 70% of the major crops, at least one third of the global food production depends on animal pollination (Klein et al., 2007; Gallai et al., 2009). Animal pollination is critical for reproduction of many crops (Nabhan and Buchmann, 1997; Westerkamp and Gottsberger, 2000) and most of the wild plants as well (Ashman et al., 2004). Several attempts have been made to conceptualize the economic value of the pollination services provided by insects for crop productivity (Levin, 1983; Gallai et al., 2009) and IPBES (2016) estimated that the economic value provided by pollinators was approximately 233~577 billion USD per annum. Jung (2008) estimated honeybee economic value in major fruit and vegetable crops of 5.8 billion USD in Korea.
More recently the world has been witnessing dramatic losses of cultivated honeybees as well as declines of native pollinator species (Aizen and Harder, 2009; Potts et al., 2010; Lebuhn et al., 2012). Insect pollinators include mainly honeybees, bumblebees, solitary bees (Hymenoptera), hoverflies (Diptera) and butterflies (Lepidoptera). Habitat fragmentation and degradation is one of the major stressors for the decline of pollinators and the ecosystem (Biesmeijer et al., 2006; Olroyd, 2007; Stokstad 2007). Nutritional stress due to habitat loss (Naug, 2009) and losses of semi-natural habitats in modern agricultural landscapes or agricultural intensification leads to a reduction in species richness and abundance (Kremen, 2002; Haenke et al., 2009).
One of the efforts to booster pollinators and pollination is creating pollinator habitats by provisioning flowering plants, which could serve as nectar and pollen sources (Samnegard, 2011; Benelli, 2014). Flower plantings could be more important for pollen and nectar resources when the crop is not in bloom and, depending on the bee species biology, could also provide nesting habitat (Carreck and Williams, 2002; Kremen et al., 2004; Heard et al., 2007). Conservation of a range of beneficial insects is another important aspect for consistent in providing ecosystem services in agricultural settings (Naeem, 1998; Kleijn and Sutherland, 2003). Finding ways to consistent ecosystem service provision and its sustainability, design of the farm systems should be such that it supports biodiversity of beneficial organisms and enhancing crops yield (Tscharntke et al., 2012).
In Korea, little attention has been made on habitat managements to increase pollinator diversity and abundance. Farmscape in Korean agricultural ecosystems are very complex with small patches. Farmers cultivate average 1.3 ha land and per capita agricultural land is very small (332 m2, KOSTAT, 2015) which is much less than worldwide average (2,000 m2, FAO, 2013). Because of the marginal agricultural land, flowering plant supplementation at the edge of their fields would be uneconomical. Thus in this study, we tested flower habitat supplement along the roads or walking trails around the farm to see if pollinators and natural enemies could increase those abundance or diversity, and influence the crop yield on red pepper field.
MATERIALS AND METHODS
Study site and flower planting
The study was conducted in the experimental farm (70 m long, 15 m wide) of Andong city (N 36.5451, E 128.7945) in Gyoungbuk province where is the largest field pepper cultivation area in Korea. 6 rows (60 m long, 1.5 m wide each) of field pepper (var. Geotop, PR resistant variety, and Cheongyang) were transplanted on the black plastic mulching soil on 4th May 2016. Seedlings were purchased from a local supply. Conventional farming practices were applied but not pesticides were applied on the field. At both ends of the field, seeding or seedligs were subjected. Then the pepper field was subdivided into 18 subplots (L1, L2, L3, R3, R2, R1 with 3 replicates each) for monitoring and yield harvesting purpose.
Before this study, we had selected 6 flower species based on the germination rate, flowering period, overlapping flowering season with main crop, familiarity and easily availability, and abundance of pollen and nectar on the blossom (Table 1). Direct seeding of these species and transplanting of seedlings were madeon the ground with 1~2 m width only at both edges. During mid of May buckwheat and rape seed were directly broadcasted at the edges of the paper plants while Zinnia and corn flower seedling where planted which were maintained at the green houses. Major blooming period of the flowering plants was from June to August.
Pollinator and other insects’ survey
Pollinator insects were collected or visually inspected from each subplots and flower habitats at the edge of the pepper field. Also, one yellow-pan trap (15 cm diameter, 10 cm height) was set above the plant height at each subplot. Propylene glycol solution was added to each pan trap to retain the trapped insect pollinators. Yellow pan traps employed because it is widely used as a sole means for saving time as well as easy and non-subjective pollinators’ sampling (Cane et al., 2000). Collected insects brought to laboratory for further processing and identification. The samples were taxonomically identified up to families and some up to species level. Visual counting of honeybees were made by observing each subplot of pepper field for 1 minute, and flower patches during blooming stage. Also, one yellow-psticky trap (15 cm×10 cm) was set above the plant height at each subplot. From these, insect pests of pepper (thrips and aphids) and natural enemies (Eulopidae and Ichneumonidae) were monitored.
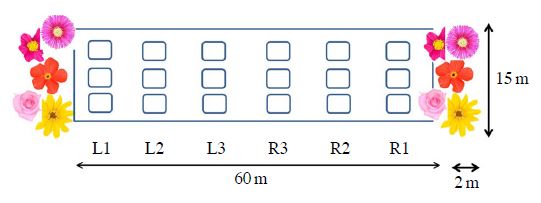
Layout for the experimental field with pepper plants to attract pollinator and natural enemies by provisioning flowering plants at the edges (Inside the field, 60 m×15 m). At both ends, mixed species of flowering plants were seeded or seedling-transplanted. each subplot size were 10 m×3 m, L means the left side and R does right side of the field relative to the distance.
Pepper yield survey
In 20th and 30th September, red pepper fruits harvested twice. Damaged fruits were discarded in the field and yields were measured as the number of normal red fruits from different plots separately to compare effect of pollination along the distance from the flower patches.
Statistical analysis
Pollinator, natural enemies and insect pests’ abundance among the sampling site was compared by analysis of variance (ANOVA). Means were separated by Duncan’s Multiple Range Test (SAS Institute, 2009). Relationship between abundance of pollinator and pepper production was investigated with regression analysis.
RESULTS
Pollinator abundance and Pepper production
In the pepper field with flowering plant habitats, honeybee abundances were significantly different among plots with different distance from the flower edges (ANOVA, P=0.0003, Fig. 2). There was consistent trend of honeybee abundance among the plots that honeybee abundances were higher in the plots near flower habitats and lower in the plots away from the habitat.
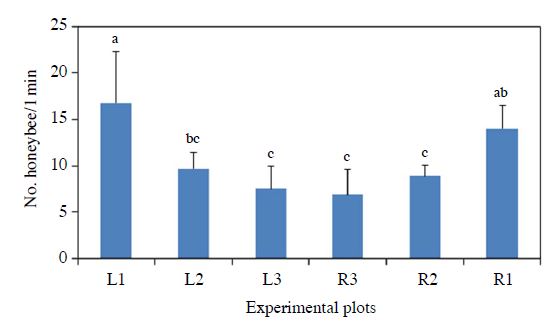
Honeybee abundance (mean numbers/1 min) in each plot in pepper field during 2016 with provisioning of flowering plant at the edges. L means the left side and R does right side of the field. Number means distance from flower habitat. ANOVA, F=6.70 df=5, 30 P=0.0003.
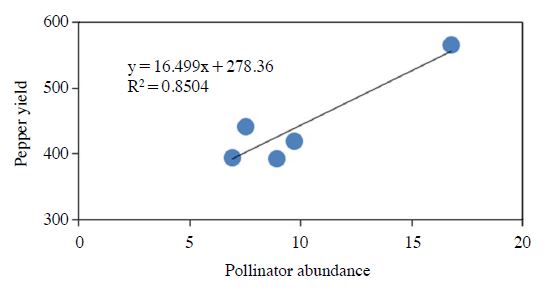
Pepper production among plots showed only marginal differences (ANOVA, P=0.12, Fig. 3). From the left side of the field, higher pepper production was resulted from the plot closer to the flower habitat, but the right side plots did not showed the same pattern. Instead, the pepper production was lowest in R1 plot which was closest to the right-side flower habitat. But, the R1 plot was suffering drought among other plots because of the nonhomogeneous soil biophysio-chemical conditions. Excluding the pepper production data from R1, there was a significant relationship between honeybee abundance and pepper yield (Reg. R2=0.85, Fig. 4). This indicates that pollinator abundance could actually contribute the pepper production.
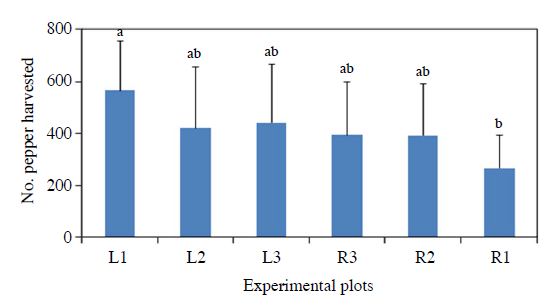
Pepper production (mean number for the sampled) per each plot relative to the distance and direction from the flower habitat in the pepper field during 2016. L means the left side and R does right side of the field. Number means distance from flower habitat. ANOVA, F=1.85 df=5, 48 P=0.1213.
Abundances of pests and natural enemies
Insect pest occurrence patterns were different to aphids and thrips (Fig. 5). Aphid abundances were not significantly different among plots (ANOVA, F=1.06 df=4, 10 P=0.425). But the abundances of thrips were significantly different among plots relative to the distance from flower habitats (ANOVA, F=6.21 df=4, 10 P=0.008). Thrips abundance was highest in the plot which was located most closely, within 20 m, to the flower habitat. Parasitoid natural enemies’ abundances were also significantly different among plots (Fig. 5). Eulopids were more abundant than Ichneumonids. Eulophidae abundance was highest at each edge (left and right) and significantly lower in the middle plots (ANOVA, F=16.53 df=4, 10 P=0.002). Abundances of Ichneumonid parasitoids were not significantly different among plots relative to the distance to the flower habitat (ANOVA, F=2.02 df=4, 10 P=0.1678).
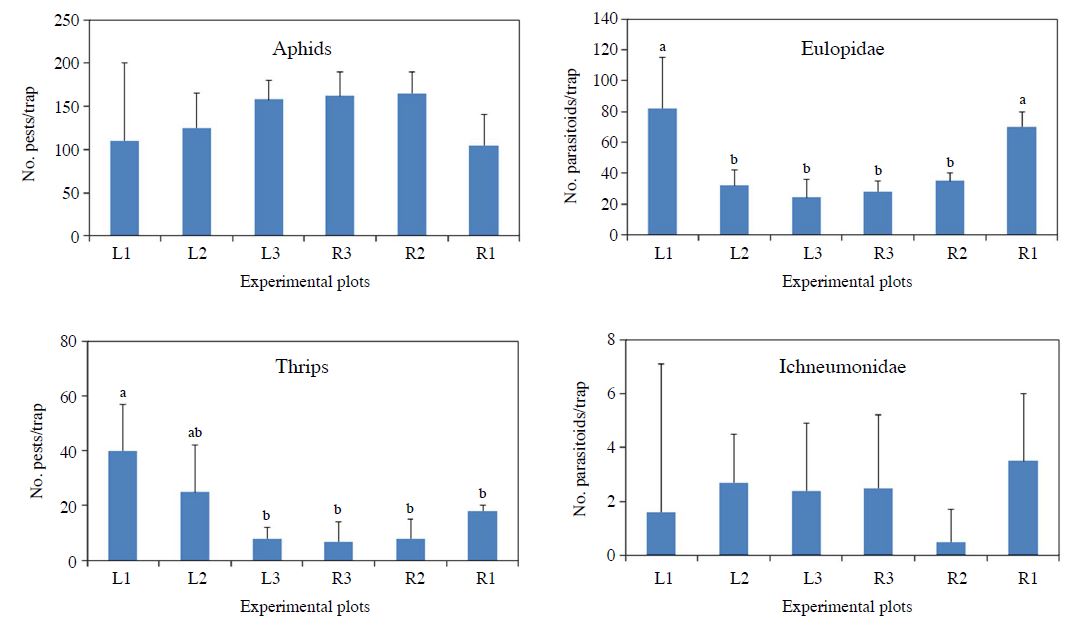
Pests (Aphids and Thrips, Left) and parasitoid natural enemies (Eulopidae and Ichneumonidae, right) occurrences from) each plot relative to the distance and direction from the flower habitat in the pepper field during 2016. L means the left side and R does right side of the field. Number means distance from flower habitat. ANOVA for aphids, F=1.06 df=4, 10, P=0.425; for thrips, F=6.21 df=4, 10, P=0.008; for eulopids, F=16.53 df=4, 10, P=0.002; and for ichneumonids, F=2.02 df=4, 10, P=0.1678.
DISCUSSION
In our study, we verify that supplement of flowering plants in the agricultural field has positive effect on pollinator abundance and natural enemies. In urban gardens, habitat complexity and diversity of flowering plants positively related to bumblebee and solitary bee diversity (Smith et al., 2006). Buckwheat Fagopyrum esculentum Moench (Polygonaceae) enhance predator and parasitoid populations (Berndt et al., 2002). Flowering plants attract wild natural enemies and supply nectar and pollen as a food and increase their longevity (Irvin et al., 2006).
In pepper field, site near-by flowering plants had highest honeybee (Apis mellifera) abundance than the other plots. There was significantly difference among the plots, because this time instead of using yellow pan trap we directly observed and identify honeybees walking each plot (near, mid, far).
Eulophidae, a large and biologically diverse family with a range of hosts, includes important biocontrol agents of pest Lepidoptera, Hemiptera and Thysanoptera (Gauthier et al., 2000). Our result showed that habitat with flowering plant had much more Eulophidae abundance than non-flowering orchard site. That’s result similar to Walton and Isaacs (2011), they result also support increased abundance of natural enemies with flowering plants strips. Bianchi and Wackers (2008) suggested that flowering plants at field margin attracted the parasitoids and provide nectar. Ichneumonidae abundance was not highest in flowering plants place in our study. Response of natural enemies to flowering resources can be different among insect taxa (Osborne et al., 2008). Previous study showed that sweet alyssum flowers increase longevity for Diadegma insulare (Hymenoptera: Ichneumonidae) (Johanowicz and Mitchell, 2000). Incorporating nectar producing cover crops in orchards and vineyards is one-way to enhance natural enemy populations in agricultural systems with the intention of improving pest control by providing natural enemy food and shelter (Gurr et al., 2004).
Yield of pepper was not significantly different among the plots, but highest yield plot was L1 (near flowering strips) (F=1.85 df=5, 48 P=0.1213) (Table 2). Garibaldi (2013) also reported honeybee was not enough to pollinating for crop fruit set. In one of the study in United States, provisioning flowering plant at field margin already having stock of the honeybee, also increased wild pollinator abundance in blue berry field then increased crop yield after 3 years. Establishment of plantation can be a slow to improve crop yield (Blaauw and Isaacs, 2014). Even with some risk associated with crop production such as pesticides (Kim and Jung, 2013), this is an important notation for increasing food production (Godfray et al., 2010).
In our study, yield of pepper field also did not increased with increase of flowering plants. This may be due to not enough coverage of land by flowering plant and we considered only one season of crop yield. Blaauw and Isaacs (2014) reported after 3 years of treatment of the flowering plant in field and then, crop yield increased, and Garibaldi et al. (2014) also reported after 4 years treatments of the flowering plant, then only profit comes in terms of yield increase. Benelli (2014) suggested that some flowering plant could be food resource for pollinator during the dearth period. Also in our condition, we found flowering plant bloomed up to October, which possibly could be food resources to pollinator in scares condition, which can be done by manipulating seeding schedule for long time blooming.
Further study could incorporate different factors like crop type, cultivation system, cultivation area, surrounding environment (proportion of natural habitat) in an integrated approach. In the future, pollinator decline can be anticipated because of anthropogenic influence; therefore we must conserve our pollinator fauna’s diversities.
Acknowledgments
We express the gratitude to Syngenta Korea for supporting the Operation Pollinator Korea program. This work was in part supported by the BSRP through the National Research Foundation of Korea (NRF), Ministry of Education (NRF-2018R1A6A1A03024862).
References
-
Aizen, M. A., and L. D. Harder, (2009), The global stock of domesticated honey bees is growing slower than agricultural demand for pollination, Curr. Biol., 19, p915-918.
[https://doi.org/10.1016/j.cub.2009.03.071]

-
Ashman, T. L., T. M. Knight, J. A. Steets, P. Amarasekare, M. Burd, D. R. Campbell, M. R. Dudash, M. O. Johnston, S. J. Mazer, R. J. Mitchell, M. T. Morgan, and W. G. Wilson, (2004), Pollen limitation of plant reproduction: ecological and evolutionary causes and consequences, Ecology, 85, p2408-2421.
[https://doi.org/10.1890/03-8024]

-
Benelli, G., S. Benvenuti, N. Desneux, and A. Canale, (2014), Cephalaria transsylvanica-based flower strips as potential food source for bees during dry periods in European Mediterranean basin countries, PloS ONE, 9, pe93153.
[https://doi.org/10.1371/journal.pone.0093153]

-
Bianchi, F. J., and F. L. Wackers, (2008), Effects of flower attractiveness and nectar availability in field margins on biological control by parasitoids, Biol. Cont., 46, p400-408.
[https://doi.org/10.1016/j.biocontrol.2008.04.010]

-
Biesmeijer, J. C., S. P. M. Roberts, M. Reemer, R. Ohlemüller, M. Edwards, T. Peeters, A. P. Schaffers, S. G. Potts, R. Kleukers, C. D. Thomas, J. Settele, and W. E. Kunin, (2006), Parallel declines in pollinators and insect-pollinated plants in Britain and the Netherlands, Science, 313, p251-353.
[https://doi.org/10.1126/science.1127863]

-
Blaauw, B. R., and R. Isaacs, (2014), Flower plantings increase wild bee abundance and the pollination services provided to a pollination-dependent crop, J. Appl. Ecol., 51, p890-898.
[https://doi.org/10.1111/1365-2664.12257]

- Carreck, N. L., and I. H. Williams, (2002), Food for insect pollinators on farmland: insect visits to flowers of annual seed mixtures, J. Insect Conserv., 6, p13-23.
- Daily, G. C., (1997), Nature’s services: societal dependence on natural ecosystems, Washington, DC, Island Press.
- FAO, (2013), Statistical Yearbook 2013. World Food and Agriculture, FAO Food Agric.
-
Gallai, N., J. M. Salles, J. Settele, and B. E. Vaissière, (2009), Economic valuation of the vulnerability of world agriculture confronted with pollinator decline, Ecol. Econ., 68, p810-821.
[https://doi.org/10.1016/j.ecolecon.2008.06.014]

-
Garibaldi, L. A., I. Steffan-Dewenter, R. Winfree, M. A. Aizen, R. Bommarco, S. A. Cunningham, C. Kremen, L. G. Carvalheiro, L. D. Harder, O. Afik, I. Bartomeus, F. Benjamin, V. Boreux, J. Ghazoul, S. Greenleaf, J. Hipolito, A. Holzschuh, B. Howlett, F. Isaacs, S. K. Javorek, C. M. Kennedy, K. M. Krewenka, S. Krishnan, Y. Mandelik, M. M. Mayfield, I. Motzke, M. Theodore, B. A. Nault, M. Otieno, J. Petersen, G. Pisanty, S. G. Potts, R. Rader, T. H. Ricketts, M. Rundlof, C. L. Seymour, C. Schuepp, H. Szentgyorgyi, H. Taki, T. Tscharntke, C. H. Vergara, B. F. Viana, T. C. Wanger, C. Westphal, N. Williams, and A. M. Klein, (2013), Wild pollinators enhance fruit set of crops regardless of honey bee abundance, Science, 339, p1608-1611.
[https://doi.org/10.1126/science.1230200]

-
Garibaldi, L. A., L. G. Carvalheiro, S. D. Leonhardt, M. A. Aizen, B. R. Blaauw, R. Isaacs, M. Kuhlmann, D. Klejin, A. M. Klein, C. Kremen, L. Morandin, J. Scheper, and R. Winfree, (2014), From research to action: Enhancing crop yield through wild pollinators, Front Ecol. Environ., 12, p439-447.
[https://doi.org/10.1890/130330]

-
Gauthier, N., J. Lasalle, D. L. Quicke, and H. C. J. Godfray, (2000), Phylogeny of Eulophidae (Hymenoptera: Chalcidoidea), with a reclassification of Eulophinae and the recognition that Elasmidae are derived eulophids, Syst. Entomol., 25, p521-539.
[https://doi.org/10.1046/j.1365-3113.2000.00134.x]

-
Godfray, H. C. J., J. R. Beddington, J. I. Crute, L. Haddad, D. Lawrence, J. F. Muir, J. Pretty, S. Robinson, S. M. Thomas, and C. Toulmin, (2010), Food security: the challenge of feeding 9 billion people, Science, 327, p812-818.
[https://doi.org/10.1126/science.1185383]

- Gurr, G. M., S. L. Scarratt, S. D. Wratten, L. Berndt, and N. Irvin, (2004), Ecological engineering, habitat manipulation and pest management, Ecological engineering for pest management: Advances in habitat manipulation for arthropods, p1-12.
-
Haenke, S., B. Scheid, M. Schaefer, T. Tscharntke, and C. Thies, (2009), Increasing syrphid fly diversity and density in sown flower strips within simple vs. complex landscapes, J. Appl. Ecol., 46, p1106-1114.
[https://doi.org/10.1111/j.1365-2664.2009.01685.x]

-
Heard, M. S., C. Carvell, N. L. Carreck, P. Rothery, J. L. Osborne, and A. F. G. Bourke, (2007), Landscape context not patch size determines bumble-bee density on flower mixtures sown for agri-environment schemes, Biol. Lett., 3, p638-641.
[https://doi.org/10.1098/rsbl.2007.0425]

- IPBES, (2016), The Assessment Report on Pollinators, Pollination and Food Production, Intergovernmental Science-Policy Platform on Biodiversity and Ecosystem Servcies, Bibb, Germany, p552.
-
Irvin, N. A., S. L. Scarratt, S. D. Wratten, C. M. Frampton, R. B. Chapman, and J. M. Tylianakis, (2006), The effects of floral understoreys on parasitism of leafrollers (Lepidoptera: Tortricidae) on apples in New Zealand, Agri. For. Entomol., 8, p25-34.
[https://doi.org/10.1111/j.1461-9555.2006.00285.x]

-
Johanowicz, D. L., and E. R. Mitchell, (2000), Effects of sweet alyssum flowers on the longevity of the parasitoid wasps Cotesia marginiventris (Hymenoptera: Braconidae) and Diadegma insulare (Hymenoptera: Ichneumonidae), Flor. Entomol., 83, p41-47.
[https://doi.org/10.2307/3496226]

- Jung, C., (2008), Economic value of honeybee pollination on major fruit and vegetable crops in Korea, J. Apic., 23, p147-152.
- Kim, D. W., and C. Jung, (2013), Comparative analysis of the perception on honeybee damage by the pesticides between beekeepers and apple growers, Kor. J. Apic., 28, p33-38.
-
Kleijn, D., and W. Sutherland, (2003), How effective are European agri-environment schemes in conserving and promoting biodiversity?, J. Appl. Ecol., 40, p947-969.
[https://doi.org/10.1111/j.1365-2664.2003.00868.x]

-
Klein, A. M., B. E. Vaissiere, J. H. Cane, I. Steffan-Dewenter, S. A. Cunningham, C. Kremen, and T. Tscharntke, (2007), Importance of pollinators in changing landscapes for world crops, Proceedings of the Royal Society of London B: Biol. Sci., 274, p303-313.
[https://doi.org/10.1098/rspb.2006.3721]

- Korea Statistics, (2015), KOSTAT.
-
Kremen, C., N. M. Williams, and R. W. Thorp, (2002), Crop pollination from native bees at risk from agricultural intensification, Proc. Nat. Acad. Sci., 99, p16812-16816.
[https://doi.org/10.1073/pnas.262413599]

- Lebuhn, G., S. Droege, E. F. Connor, B. Gemmill-Herren, S. G. Potts, R. L. Minckley, T. Griswold, R. Jean, E. Kula, D. W. Roubik, J. Cane, K. W. Wright, G. Frankie, and F. Parker, (2012), Detecting insect pollinator declines on regional and global scales, Conserv. Biol., 27, p113-120.
-
Levin, M. D., (1983), Value of bee pollination to U. S. agriculture, Bull. Entomol. Soc. Am., 29, p50-51.
[https://doi.org/10.1093/besa/29.4.50]

- Nabhan, G. P., and S. Buchmann, (1997), Services provided by pollinators, p133-150, in Nature’s services: societal dependence on natural ecosystems, ed. byG. G. Daily, Washington, DC, Island Press.
-
Naeem, S., (1998), Species redundancy and ecosytem reliability, Conserv. Biol., 12, p39-45.
[https://doi.org/10.1046/j.1523-1739.1998.96379.x]

-
Naug, D., (2009), Nutritional stress due to habitat loss may explain recent honeybee colony collapses, Biol. Conserv., 142, p2369-2372.
[https://doi.org/10.1016/j.biocon.2009.04.007]

-
Ollerton, J., R. Winfree, and S. Tarrant, (2011), How many flowering plants are pollinated by animals?, Oikos, 120, p321-326.
[https://doi.org/10.1111/j.1600-0706.2010.18644.x]

- Olroyd, B. P., (2007), What’s killing American honey bee?, PLoS Biol., 5, pe168.
-
Osborne, J. L., S. J. Clark, R. J. Morris, I. H. Williams, J. R. Riley, A. D. Smith, D. R. Reynolds, and A. S. Edwards, (1999), A landscape scale study of bumble bee foraging range and constancy, using harmonic radar, J. Appl. Ecol., 36, p519-533.
[https://doi.org/10.1046/j.1365-2664.1999.00428.x]

-
Osborne, J. L., A. P. Martin, N. L. Carreck, J. L. Swain, M. E. Knight, D. Goulson, R. J. Hale, and R. A. Sanderson, (2008), Bumblebee flight distances in relation to the forage landscape, J. Anim. Ecol., 77, p406-415.
[https://doi.org/10.1111/j.1365-2656.2007.01333.x]

-
Potts, S. G., J. C. Biesmeijer, C. Kremen, P. Neumann, O. Schweiger, and W. E. Kunin, (2010), Global pollinator declines: trends, impacts and drivers, Trends Ecol. Evol., 25, p345-353.
[https://doi.org/10.1016/j.tree.2010.01.007]

- Samnegard, U., A. Persson, and H. Smith, (2011), Gardens benefit bees and enhance pollination in intensively managed farmland, Biol. Conserv., 144, p2602-2606.
- SAS Institute, (2009), SAS/STAT user’s guide: statistics, version 9.3 SAS Institute, Cary, NC, USA.
-
Smith, R. M., P. H. Warren, K. Thompson, and K. J. Gaston, (2006), Urban domestic gardens (VI): environmental correlates of invertebrate species richness, Biodiv. Conserv., 15, p2415-2438.
[https://doi.org/10.1007/s10531-004-5014-0]

- Stokstad, E., (2007), The case of the empty hives, Science, 316, p970-972.
-
Tscharntke, T., Y. Clough, T. C. Wanger, L. Jackson, I. Motzke, I. Perfecto, J. Vandermeer, and A. Whitbread, (2012), Global food security, biodiversity conservation and the future of agricultural intensification, Biol. Conserv., 151, p53-59.
[https://doi.org/10.1016/j.biocon.2012.01.068]

-
Walton, N. J., and R. Isaacs, (2011), Influence of native flowering plant strips on natural enemies and herbivores in adjacent blueberry fields, Environ. Entomol., 40, p697-705.
[https://doi.org/10.1603/en10288]

-
Watanabe, M. E., (1994), Pollination worries rise as honey bees decline, Science, 265, p1170.
[https://doi.org/10.1126/science.265.5176.1170]

-
Westerkamp, C., and G. Gottsberger, (2000), Diversity pays in crop pollination, Crop Sci., 40, p1209-1222.
[https://doi.org/10.2135/cropsci2000.4051209x]

- Williams, I. H., (1994), The dependences of crop production within the European Union on pollination by honey bees, Agric. Zool. Rev., 6, p229-257.

