Migratory Beekeeping Information System: Application to the Study of Distribution and Movement Patterns of Migratory Beehives in South Korea during the Honey Flow Period
Abstract
Migratory beekeeping has both ecological and economic benefits. The practice, however, has certain drawbacks such as risk of disease transmission and pesticide exposure. The use of Geographic Information Systems (GISs) in migratory beekeeping can potentially mitigate such drawbacks. However, in South Korea, research on or initiatives to incorporate GIS into beekeeping practices are lacking. To address this research gap and to enhance the effectiveness of migratory beekeeping, we have developed a system that incorporates GPS and temperature-humidity sensors into beehives to provide geographical information-based services to beekeepers. To evaluate the utility of this system, we distributed it to 39 migratory beekeepers. As a result, we were able to obtain location information and meteorological data around the migratory beehives during the honey flow season. Furthermore, we collected location information from 19 beehives that moved over 1 km during the study period and calculated the distances traveled. Notably, in early to mid-May, the majority of beehives were distributed in central and northern regions at latitudes 36.4°N or higher, making up more than 70% of the total. However, after June, approximately 40% of the beehives were found to be located in southern regions at latitudes 36°N or lower. The distances traveled by the beehives were longest in early to mid-May and exhibited a temporary increase in mid-June. These results closely corresponded to the general flowering patterns and geographical locations of acacia (Robinia pseudoacacia) and chestnut (Castanea crenata) trees. This study provides empirical data on the routes and distribution of migratory beekeepers during the honey flow season in South Korea, making it a valuable resource for tailoring research and policies to meet the needs of migratory beekeepers.
Keywords:
Migratory beekeeping, GIS, GPS, Location, Honey flow periodINTRODUCTION
Beekeeping is an important activity that provides economic and ecological benefits (Altunel and Olmez, 2019). However, the success of beekeeping depends on various factors such as weather, vegetation, and geographical characteristics (Abou-Shaara, 2019). The primary goal of beekeepers is honey production, and to produce a large quantity of honey per colony, various conditions inside and outside the beehive need to be met (Kekeçoğlu et al., 2007; Sudarsan et al., 2012). Beekeepers often move beehives to provide commercial pollination services for crops like almond, a practice known as migratory beekeeping (Sharma and Bhatia, 2001). Migratory beekeeping is a common practice worldwide (Pirk et al., 2014). In the United States, millions of beehives are transported by trucks to provide pollination services for crops such as almonds, blueberries, and cranberries (vanEngelsdorp et al., 2013; Melicher et al., 2019). Similar practices are observed in Europe (Jara et al., 2021; Pocol et al., 2021), China (Zheng et al., 2018), Saudi Arabia (Adgaba et al., 2014), and India (Kishan Tej et al., 2017) for honey production and crop pollination. In South Korea, over a million beehives are used for migratory beekeeping, and approximately 30% of all beekeepers practice it (MAFRA, 2021). However, the practice of moving beehives has its drawbacks, including the risk of disease transmission (Owen, 2017), pesticide exposure (Traynor et al., 2016), sudden weather changes (Switanek et al., 2017), and disasters damage (Martínez-López et al., 2022).
Geographic Information Systems (GISs) have been widely used in agriculture due to their ability to manipulate, store, and analyze various geographical datasets (Abou-Shaara, 2019). The introduction of GIS in migratory beekeeping can potentially mitigate the mentioned drawbacks (Sponsler et al., 2017). Recent efforts have utilized GIS to provide valuable information to beekeepers. For example, Ambarwulan et al. (2017) used GIS to select suitable locations for beekeepers based on data such as distance to temperature and precipitation sources, elevation, distance to markets, and land use. Al-Ghamdi et al. (2016) matched beehives with specific locations based on data related to the location of honey plants, flowering period of plants, and honey quantity, providing valuable information to beekeepers. Other applications of GIS in beekeeping include climate change adaptation (Abou-Shaara, 2016) and pest avoidance (Halbich and Vostrovský, 2012).
However, in the context of South Korea, there is a lack of research or initiatives to incorporate GIS into beekeeping practices. To address this gap, we developed a GIS that provides beekeepers with geographic and meteorological information collected from GPS, temperature and humidity sensors installed on beehives. This system is designed to offer beekeepers information about weather forecasts, location of the honey plants, and pesticide spraying information based on the geographical data of beehives. To evaluate the utility of this system in migratory beekeeping, we applied it to bee colonies during the migratory season, aiming to gather diverse information on beehive distribution, movement patterns, and distances traveled in South Korea.
MATERIALS AND METHODS
1. System establishment
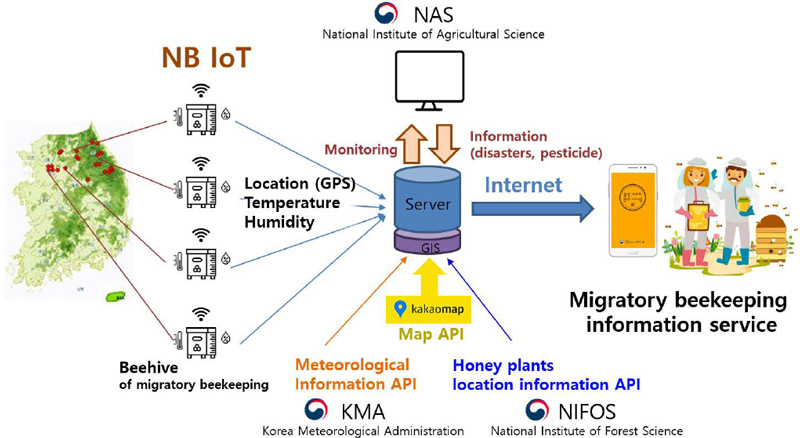
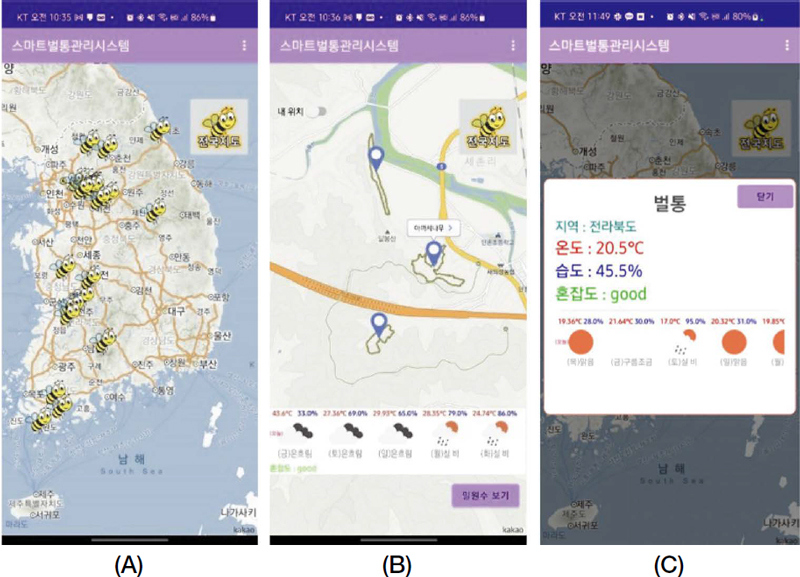
The Migratory Beekeeping GIS (MBGIS) incorporates hardware that collects the location data of beehives and meteorological data in the vicinity of the beehives, such as temperature and humidity (Fig. 1). The system integrates data from the Korea Meteorological Administration (KMA)’s weather forecast Application Programming Interface (API) and the Korean National Institute of Forest Science (NIFOS)’s native plant distribution API, along with the “Kakao Maps” API (Kakao, Jeju, Korea), to establish a GIS. The collected information is stored on a dedicated server. Researchers from the National Institute of Agricultural Sciences (NAS) can access this information for data analysis, and can provide to beekeepers with information to be aware of, such as weather disasters or pesticide spraying. Users such as beekeepers can access the data through a smartphone application designed as part of the study over the internet (Fig. 1). The Beehive Location Tracking Unit (BLTU) is designed as hardware to provide information on the location of beehives and the surrounding weather conditions. The primary functions of this unit include the use of high-precision GPS to measure the location of beehives and temperature and humidity sensors to measure the meteorological conditions around the beehives. These data are transmitted every 3 h through the Narrow Band-Internet of Things (NB-IoT) network (provided by LG, Korea). The BLTU is designed for ultra-low power consumption, ensuring more than one year of usability. It is waterproof and dustproof for effective outdoor use (Fig. 2-A, B). Its installation is as simple as turning it on and placing it on top of the beehive, after which data collection begins immediately (Fig. 2-C).
2. Selection of participating beekeepers
To validate the utility of the MBGIS, 39 beekeepers engaged in migratory beekeeping in six different provinces were recruited (Table 1). The recruitment criteria in cluded beekeepers with more than 10 years of migratory beekeeping experience and those operating more than 100 beehives. On April 25, 2023, the selected beekeepers were invited and trained on how to use the system. Subsequently, each beekeeper was equipped with one BLTU and a user smartphone application (Fig. 3). They began installing the BLTU on their beehives starting on April 28, upon returning to their respective apiaries.
3. Data collection and analysis
Data were collected from 39 BLTUs from April 28th to August 7th. The collected data were analyzed using log files stored on the server. To visually assess the distribution of beehives during the study period, the 3D map tour feature in Excel (Microsoft, Redmond, WA, USA) was used for analysis (Fig. 4). From the collected data, specific data from the honey flow period, which ran from April 28th to July 1st, were selected to calculate the maximum, minimum, and average values of temperature and humidity around the beehives. Using the location information of the beehives, the maximum, minimum, and average values of longitude and latitude of the beehives were determined. Beehive movement distances were calculated when there was a change in the location information collected at 3-h intervals using the following formula:
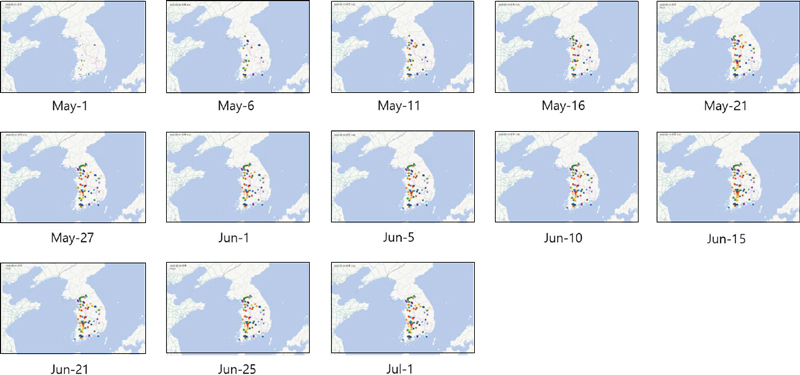
Changes in beehive location over time during honey flow period. The various colored small dots represent individual beehives.
From the total of 39 beehives surveyed, units with calculated movement distances of 1 km or more were selected for further analyses. For each of the selected 19 beehives, cumulative movement distances were computed, and the maximum cumulative movement distance, minimum movement distance, and average cumulative movement distance were determined. Furthermore, the average single-trip distance was secured for each unit, and the maximum, minimum, and average values were derived.
To analyze the temporal changes in the surrounding environment, distribution, and movement paths of beehives, the correlation between the study period and the temperature and humidity around the beehives was examined. The study period was divided into 5-day intervals to analyze the changes in beehive locations. In addition, a correlation analysis between the study period and beehive movement distances was conducted to observe the changes in beehive movement distances during the study period.
4. Statistical analysis
The correlation between the study period, temperature, humidity, around the beehives, and beehive movement distances was assessed using Pearson’s correlation analysis. The differences in beehive location distributions based on the study period were tested for significance using Chi-square tests. A comparison of honeybee movement distances based on the study period was conducted through the one-way analysis of variance (ANOVA) test after checking data normality, followed by post hoc tests using Tukey’s Honestly Significant Difference (HSD) to group the dependent variables. In cases where homoscedasticity was not met in the analysis of variance, significance was tested using Welch’s ANOVA test. All statistical analyses were performed using the SPSS PASW 22.0 package for Windows (IBM, Chicago, IL, USA).
RESULTS AND DISCUSSION
1. Measurement of meteorological and geographic information for migratory beehives
During the study period, a total of 10,353 meteorological and geographic data points were collected from 39 beehives. Monthly data collection statistics revealed that, on average, 84 data points were collected daily from 25 beehives in April, 118.2 data points daily from 38 beehives in May, 106.5 data points daily from 32 beehives in June, 84.7 data points daily from 18 beehives in July, and 72.7 data points daily from 17 beehives in August (Welch’s ANOVA test, F4,11.388=24.376, p= 0.0001).
The average temperature around the beehives was 24.8℃, with a maximum temperature of 43.8℃ and a minimum of 11.4℃. The relative humidity around the beehives was recorded with an average of 64.2%, a maximum of 89.4%, and a minimum of 29.2% (Table 2). Among the 39 beehives, it was observed that only 19 beehives had moved more than 1 km.
An analysis of the installation locations of the beehives showed that the highest latitude of beehive installation was 37.1°N near Hwacheon-gun, Gangwon-do, while the lowest latitude was 34.5°N near Mokpo-si, Jeollanam-do (Table 3). The highest longitude of beehive installation was 129.0°E near Taebaek-si, Gangwon-do, and the lowest longitude was 126.3°E near Mokpo, Jeollanam-do. During the study period, the cumulative movement distance of each beehive averaged 578.5 km, with beehives covering distances ranging from 47.7 km to 1,744.9 km (Table 4). On average, each beehive covered 64.2 km per single trip, with a maximum of 89.4 km and a minimum of 29.2 km.
In Korea, the honey flow period typically spans from May to June when the acacia trees bloom (RDA, 2020). The newly collected movement data of beehives exhibited significant variation by month (Chi-square test: x22=171.182, p=0.001). The highest number of beehives movement data recorded in May and June, coinciding with the honey flow period. A comparison of the temperature around the beehives with weather data from the Korean Meteorological Administration’s statistics portal (KMA, 2023) revealed that the average temperature around the beehives was approximately 2℃ higher than that in the weather data from the KMA statistics portal from May to July. The distribution of the beehives ranged from the southern to the northern regions of South Korea. The beehives of migratory beekeeping in South Korea covered an average distance of 578 km during the honey flow period, which was less than the average distance of 4,000 km in the United States (Melicher et al., 2019) and 3,000 km in China (Zheng et al., 2018), and similar to the 400 km average distance in Spain (Jara et al., 2021).
2. Analysis of meteorological changes and beehive location during the honey flow period
A significant positive correlation was observed between the honey flow period (from April 28th to July 1st) and the ambient temperature around the beehives (r= 0.429, p=0.0001; Fig. 5). However, no significant correlation was found between humidity and the honey flow period (p=0.074). This lack of correlation is thought to be due to the increased humidity during May, due to frequent rainfall, and during June, due to the rainy season (KMA, 2023). When analyzing the location information (latitude) of beehives at 5-day intervals during the honey flow period (Fig. 6), the range of 37.4-38.1°N latitude accounted for the highest percentage at 47.1%, followed by 36.4-37.4°N, 35.4-36.4°N, and 34.4-35.5°N (Oneway ANOVA test, F3,52=49.598, p=0.0001). The ratio of beehive locations by date exhibited significant differences (Chi-square x239=165.847, p=0.0001).
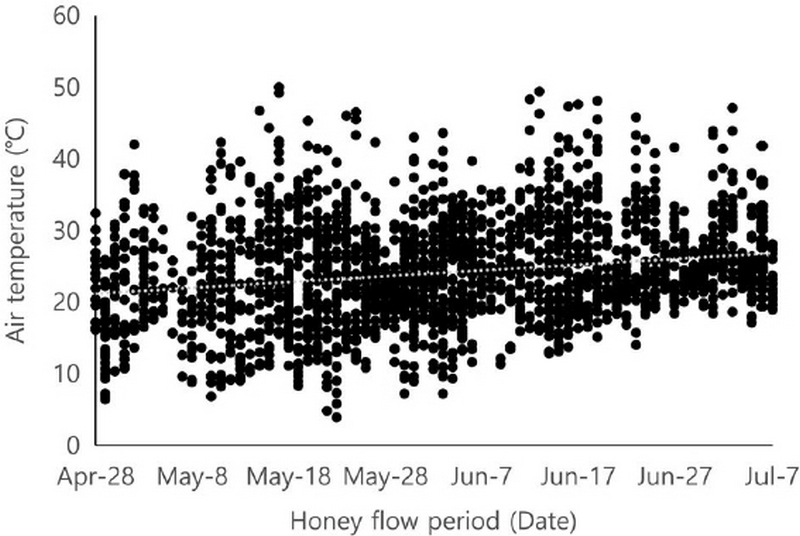
Correlation between air temperature surrounding beehive and honey flow period. The gray dashed line represents the trendline. Pearson’s correlation analysis revealed a significant correlation with an r-value of 0.456.
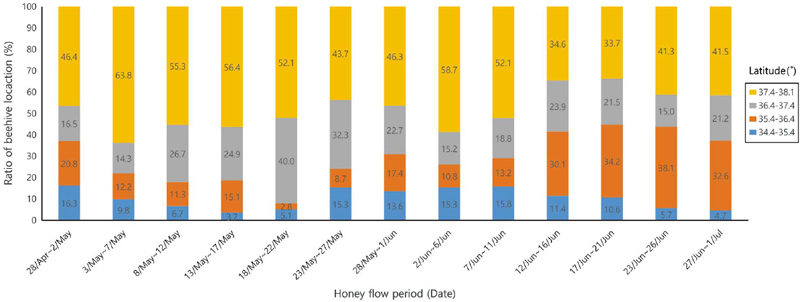
Comparing the proportional changes in beehive location (Latitude) daily during the honey flow period. Significant differences were observed in beehive location ratios across dates (Chi-square test: x239=165.847, p=0.0001).
From April 28th to June 11th, there was a tendency for a higher proportion of beehives to be located in regions at higher latitudes, with Seosan-si, Chungcheongnam-do (36.4°N), serving as the reference point. However, after June 11th, a trend emerged with a higher proportion of beehives located in the regions between Mokpo-si, Jeollanam-do (34.4°N), and Jeongeup-si, Jeollabuk-do (35.4°N).
There was a significant negative correlation between the single-trip distance of beehives and the honey flow period (r=-0.396; Fig. 7). When analyzing the single-trip distance of beehives at 5-day intervals during the honey flow period, significant differences in the beehive movement distance were observed by period (One-way ANOVA test, F11,48=3.477, p=0.010; Fig. 8). The longest single-trip distance recorded was 90.2 km between May 8th and 12th. The second-longest distance group were 51.4 km between May 13th and May 27th and between April 28th and May 2nd. The third-longest distance group recorded was 32.5 km between June 2nd and June 11th.
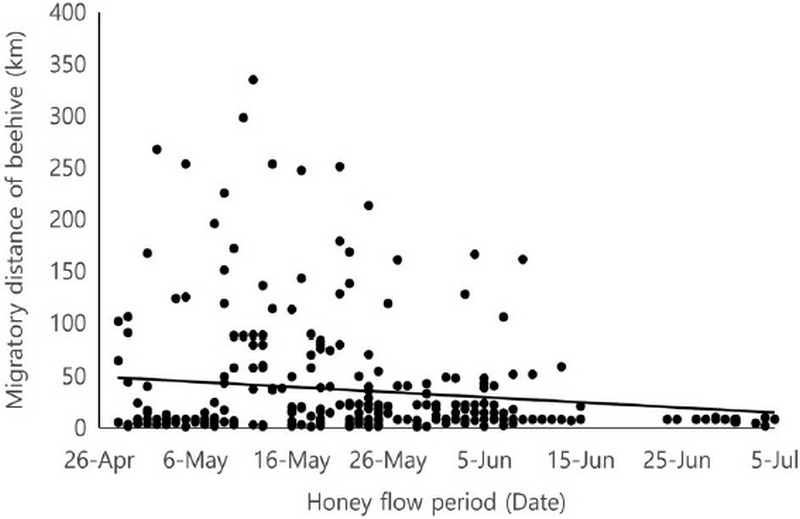
Correlation between the honey flow period and migratory distance of beehives. Pearson’s correlation analysis revealed a significant correlation with an r-value of -0.396. The solid black line represents the trendline.
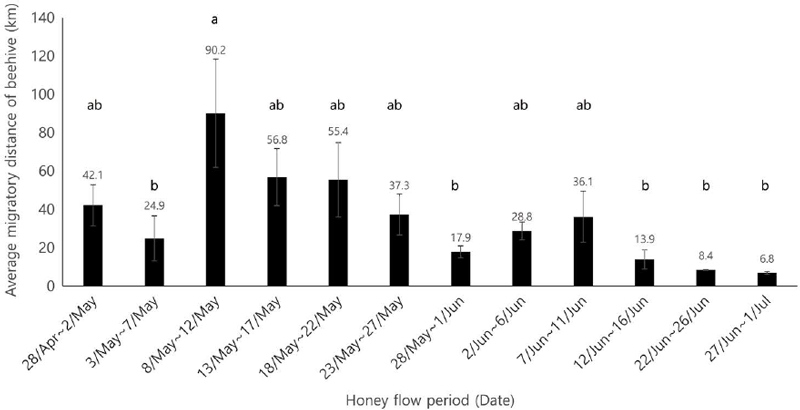
Comparison of daily average beehive migratory distances during the honey flow period. There was a statistically significant difference in the average beehive migratory distance for each period (one-way ANOVA test). The error bars on the bar chart represent standard deviation values. Different letters indicate significant differences among at 5-day intervals during the honey flow period, based on the results of one-way ANOVA and Tukey’s HSD (p<0.05).
In Korea, migratory beekeeping primarily involves moving beehives in May, coinciding with the flowering of acacia trees, with some hives being relocated in June in response to the blooming of chestnut trees (Han, 2015; Kang et al., 2017). Acacia trees typically bloom from late April to early June, spanning from southern to northern regions throughout the country (Han et al., 2009; Choi et al., 2021). On the other hand, chestnut trees typically bloom from mid to late June, primarily in the central and southern regions (Kim et al., 2003; Park et al., 2011). Therefore, beehive movement was expected to be concentrated mainly during early to mid-May, coinciding with the acacia flowering period. In this study, a significant negative correlation was found between the honey flow period and beehive movement distance, further supporting this trend.
Moreover, it was observed that by the end of April and early May, beehive locations were relatively evenly distributed across various latitudes. However, as May progressed, beehive locations were predominantly concentrated in regions at latitudes above 35°N. Similarly, beehive movement distances increased in early May and then decreased by the end of May. This can be explained by the fact that acacia trees started blooming in late April in the southern regions and continued blooming through May, covering central and northern regions. Consequently, beehive movement was concentrated in May, and the beehive locations predominantly shifted to mid and high latitudes.
Additionally, from early June to late June, beehives were primarily distributed in the central and southern regions, particularly between 34.4°N and 36.4°N latitudes. Beehive movement distances also exhibited a temporary increase from June 2nd to June 11th, corresponding to the typical blooming period of chestnut trees and matching the distribution regions.
CONCLUSION
We have developed a system for providing location-based services to migratory beekeepers by attaching GPS units to beehives. To evaluate the utility of this system, we distributed it to 39 migratory beekeepers. As a result, we were able to obtain meteorological data around beehives during the honey flow period. Additionally, we collected beehive location information from 19 beehives that moved more than 1 km during the study period, allowing us to calculate their movement distances. Based on these data, we confirmed that the distribution and movement patterns of beehives during the honey flow period generally coincide with the blooming periods and regions of acacia and chestnut trees. Our research is valuable as the first study that provides empirical data on the paths and distributions of migratory beekeepers in South Korea during the honey flow period. This research can serve as fundamental data source for formulating studies and policies supported to the migratory beekeepers, and can be used for various purposes, including managing beekeeping in the face of climate change, monitoring insect distribution, and predicting annual honey production.
However, this study has certain limitations. First, meteorological conditions such as precipitation, wind velocity and direction and atmospheric pressure was not considered, which can significantly affect beekeepers’ decisions when moving beehives. Additionally, the data on acacia and chestnut trees used in this study are based on previously reported general blooming periods and distribution, making it insufficient to confirm the correlation with beehive movement or conduct regression analysis. Therefore, in future research, it is essential to collect data from a larger number of migratory beekeepers and conduct concurrent surveys of the blooming characteristics in different regions. Moreover, further analysis is needed to examine whether economic benefits, such as cost reduction in beekeeping management, arise through the utilization of the system, by comparing the movement patterns and decision-making patterns of migratory beekeepers who received the system with those who did not. Expanding on our research findings, by investigating beehive interior environments, bee traffic patterns, and honey flow, a model can be developed to help beekeepers maximize honey production during the honey flow period. Integration with artificial intelligence technology can evolve the developed system into a decision support system for beekeepers (Albayrak et al., 2018, 2021).
Acknowledgments
This work was supported by a grant from the National Institute of Agricultural Sciences, Rural Development Administration, Republic of Korea (Project No.: PJ01595301).
References
-
Abou-Shaara, H. F. 2016. Expectations about the potential impacts of climate change on honey bee colonies in Egypt. J. Apic. 31: 157-164.
[https://doi.org/10.17519/apiculture.2016.06.31.2.157]

-
Abou-Shaara, H. F. 2019. Geographical information system for beekeeping development. J. Apic. Sci. 63: 5-16.
[https://doi.org/10.2478/jas-2019-0015]

- Adgaba, A., A. G. Al-Ghamdi, A. G. Shenkute, S. Ismaiel, S. Al-Kahtani, Y. Tadess, M. J. Ansari, W. Abebe and M. Q. A. Abdulaziz. 2014. Socio-economic analysis of beekeeping and determinants of box hive technology adoption in the Kingdom of Saudi Arabia. J. Anim. Plant Sci. 24: 1876-1884.
-
Albayrak, A., F. Duran and R. Bayir. 2018. Development of intelligent decision support system using fuzzy cognitive maps for migratory beekeepers. Turk. J. Electr. 26: 2476-2488.
[https://doi.org/10.3906/elk-1610-324]

-
Albayrak, A., S. Çeven and R. Bayır. 2021. Modeling of migratory beekeeper behaviors with machine learning approach using meteorological and environmental variables: The case of Turkey Ecol. Inform. 66. Article 101470.
[https://doi.org/10.1016/j.ecoinf.2021.101470]

-
Al-Ghamdi, A., N. Adgaba, A. Getachew and Y. Tadesse. 2016. New approach for determination of an optimum honeybee colony’s carrying capacity based on productivity and nectar secretion potential of bee forage species. Saudi J. Biol. Sci. 23: 92-100.
[https://doi.org/10.1016/j.sjbs.2014.09.020]

-
Altunel, T. and B. Olmez. 2019. Beekeeping as a rural development alternative in the Turkish Northwest. Appl. Ecol. Environ. Res. 17: 6017-6029.
[https://doi.org/10.15666/aeer/1703_60176029]

-
Ambarwulan, W., C .E. Sjamsudin and L. Syaufina. 2017. Geographic information system and analytical hierarchy process for land use planning of beekeeping in forest margin of bogor regency, Indonesia. Jurnal Silvikultur Tropika 7: 50-57.
[https://doi.org/10.29244/j-siltrop.7.3.S50-S57]

-
Choi, J., K. Lim, M. Oh and S. Lee. 2021. Foraging activity of honeybee and seasonal composition of major honey plants in central area of South Korea. J. Apic. 36: 125-139.
[https://doi.org/10.17519/apiculture.2021.09.36.3.125]

- Halbich, C. and V. Vostrovský. 2012. Monitoring of infection pressure of American Foulbrood disease by means of Google Maps. Agris On-line Pap. Econ. 4: 19-26.
- Han, J., M. S. Kang, S. H. Kim, K. Y. Lee and E. S. Baik. 2009. Flowering, honeybee visiting and nectar secretion characteristics of Robinia pseudoacacia L. in Suwon, Gyeonggi province. J. Apic. 24(3): 147-152.
-
Han, J. H. 2015. A study on management of apiary and main factors for developing the beekeeping industry in Korea. J. Apic. 30: 127-133.
[https://doi.org/10.17519/apiculture.2015.06.30.2.127]

-
Jara, L., C. Ruiz, R. Martín-Hernández, I. Muñoz, M. Higes, J. Serrano and P. De la Rúa. 2021. The effect of migratory beekeeping on the infestation rate of parasites in honey bee Apis mellifera colonies and on their genetic variability. Microorganisms 91: 22.
[https://doi.org/10.3390/microorganisms9010022]

-
Kang, D. Y., A. Seol, J. C. Oh, Y. K. Jung, H. Han and J. S. Chung. 2017. Analyzing the management characteristics of beekeeping households according to their beekeeping types. J. Apic. 32: 1-9.
[https://doi.org/10.17519/apiculture.2017.04.32.1.1]

- Kekeçoğlu, M., E. K. Gürcan and M. I. Soysal. 2007. The status of beekeeping for honey production in Turkey. J. Tekirdag Agric. Fac. 4: 1-3.
- Kim, M. J., W. Lee, M. S. Hwang, S C. Kim and M. H. Lee. 2003. Blooming, Fructification and Nut Characteristics of Chestnut Cultivars Cultivated in Korea. J. Korean Soc. For. Sci. 92: 321-332.
-
Kishan Tej, M., R. Aruna, G. Mishra and M.R. Srinivasan. 2017. Beekeeping in India industrial entomology, Springer, Singapore, pp. 35-66.
[https://doi.org/10.1007/978-981-10-3304-9_3]

- KMA (Korea Meteorological Administration). 2023. Data Open Portal. (n.d.). 23. Climate Statistics Analysis. Retrieved from https://data.kma.go.kr/cmmn/main.do/ClimateStatisticsAnalysis
- MAFRA (Ministry of Agriculture, Food, and Rural Affairs). 2021. Other domestic animals statistics. MAFRA Press Sejong, Korea.
-
Martínez-López, V., C. Ruiz and P. De la Rúa. 2022. Migratory beekeeping and its influence on the prevalence and dispersal of pathogens to managed and wild bees. IJP-PAW 18: 184-193.
[https://doi.org/10.1016/j.ijppaw.2022.05.004]

-
Melicher, D., E. S. Wilson, J. H. Bowsher, S. S. Peterson, G. D. Yocum and J. P. Rinehart. 2019. Long-distance transportation causes temperature stress in the honey bee, Apis mellifera (Hymenoptera: Apidae). Environ. Entomol. 48: 691-701.
[https://doi.org/10.1093/ee/nvz027]

-
Owen, R. 2017. Role of human action in the spread of honey bee (Hymenoptera: Apidae) pathogens J. Econ. Entomol. 110: 797-801.
[https://doi.org/10.1093/jee/tox075]

- Park, J. H., M. S. Hwang, M. G. Cho, M. S. Choi, J. K. Kim and H. S. Moon. 2011. Characteristics of leaf unfolding and flowering of chestnut varieties cultivated in Southern Korea. J. Agric. Life Sci. 45: 49-58.
-
Pirk, C. W., H. Human, M. R. Crewe and D. VanEngelsdorp. 2014. A survey of managed honey bee colony losses in the Republic of South Africa 2009 to 2011. J. Apic. Res. 53: 35-42.
[https://doi.org/10.3896/IBRA.1.53.1.03]

-
Pocol, C. B., P. Šedík, I. S. Brumă, A. Amuza and A. Chirsanova. 2021. Organic beekeeping practices in Romania: status and perspectives towards a sustainable development. Agriculture 11: 281.
[https://doi.org/10.3390/agriculture11040281]

- RDA (Rural Development Admintration). 2020. Apiculture. RDA press, Jeonju, Korea.
- Sharma, R. and R. Bhatia. 2001. Economics of stationary and migratory beekeeping in Himachal Pradesh. Agric. Sci. Dig. 21(3): 196-197.
-
Sponsler, D. B., E. G. Matcham, C.-H. Lin, J. L. Lanterman and R. M. Johnson. 2017. Spatial and taxonomic patterns of honey bee foraging: A choice test between urban and agricultural landscapes. J. Urban Ecol. 3: juw008.
[https://doi.org/10.1093/jue/juw008]

-
Sudarsan, R., C. Thompson, P. G. Kevan, P. G. and H. J. Eberl. 2012. Flow currents and ventilation in Langstroth beehives due to brood thermoregulation efforts of honeybees. J. Theor. Biol. 295: 168-193.
[https://doi.org/10.1016/j.jtbi.2011.11.007]

-
Switanek, M., K. Crailsheim, H. Truhetz and R. Brodschneider. 2017. Modelling seasonal effects of temperature and precipitation on honey bee winter mortality in a temperate climate. Sci. Total Environ. 579: 1581-1587.
[https://doi.org/10.1016/j.scitotenv.2016.11.178]

-
Traynor, K. S., J. S. Pettis, D. R. Tarpy, C. A. Mullin, J. L. Frazier, M. Frazier and D. vanEngelsdorp. 2016. In-hive Pesticide Exposome: assessing risks to migratory honey bees from in-hive pesticide contamination in the Eastern United States. Sci. Rep. 6: 1-16
[https://doi.org/10.1038/srep33207]

-
vanEngelsdorp, D., D. R. Tarpy, E. J. Lengerich and J. S. Pettis. 2013. Idiopathic brood disease syndrome and queen events as precursors of colony mortality in migratory beekeeping operations in the eastern United States. Prev. Vet. Med. 108: 225-233.
[https://doi.org/10.1016/j.prevetmed.2012.08.004]

-
Zheng, H., L. Cao, S. Huang, P. Neumann and F. Hu. 2018. Current status of the beekeeping industry in China. Asian beekeeping in the 21st century, pp. 129-158.
[https://doi.org/10.1007/978-981-10-8222-1_6]

