
기문응애 (Acarapis woodi) 특이 유전자 검출을 위한 초고속 nested PCR법 개발
Abstract
Tracheal mite ( Acarapis woodi ) is an internal parasite that is parasitic on the bronchus of adult bees and sucks fluid from the trachea. Since its first report by Rennie, it has been spread throughout Europe and in some Asian regions, with adjacent Japan and China reported in 2011 and 2012, respectively. Korea detected specific genes of A. woodi in 2015, but only one of 99 samples has been identified and the being of A. woodi has not been confirmed. In this study, we established a specific nested PCR method to confirm for detecting low-copy number of A. woodi-specific gene in bee samples. As a result, A. woodi-specific COI gene was amplified in 15 of 23 samples, and they were judged positive by melting point analysis and sequencing analysis. Although we could not observe the existence of the mites in bees, our results suggest that tracheal mit might exist in nature.
Keywords:
Acarapis woodi, Low copy detection, Ultra-rapid nested PCR서 론
기문응애 (Acarapis woodi)는 1919년 영국의 와이트섬에서 꿀벌이 폐사될 때 발견되었으나, 첫 기록은 1921년 Rennie에 의해서 Tarsonemus woodi의 학명으로 보고된 후 Acarapis woodi로 바뀌었다 (Lindquist, 1986; Wilson et al., 1997; Sammataro et al., 2000). 이들은 최초 발견 이래로, 유럽 전역과 일부 아시아 지역에 만연하게 분포하고 있다. 우리나라와 인접한 일본은 2011년, 중국은 2012년에 기문응애의 존재가 보고되었다 (Kojima et al., 2011; Yang et al., 2012). 우리나라는 안 등 (2015)이 Acarapis spp.의 특이 유전자의 존재를 보고한 바 있으나, 아직 그 실체가 보고된 바 없다. 그들은 Acarapis 3종에 대한 universal primer를 사용하여 3종의 Acarapis 특이 유전자의 존재만을 확인하였다.
기문응애는 서양종 꿀벌 (Apis mellifera) 성체의 기관지에 침입하고, 기관벽을 뚫어서 체액을 먹으며 기생하는 내부 기생자이다. 길이 125~175 μm, 너비 60~84 μm로, 꿀벌응애 (Varroa destructor) 크기의 약 1/20 수준이다. 이들은 꿀벌의 첫 번째 기문으로 침입하여 생활하다가, 암컷은 산란을 위해 1~2일령 꿀벌의 기문으로 이동한다. 암컷은 기문에 5~7개의 알을 낳고, 성체가 되기까지 약 20일이 소요된다 (Pettis and Wilson, 1996). 기문응애는 꿀벌의 기문을 막기 때문에 비행근육이나 뇌로 향하는 산소의 확산을 방해하고, 다른 세균성 및 바이러스성 병원균의 숙주로써 작용할 수 있다. 또한 심각한 수준의 감염은 꿀벌의 수명을 줄이고 봉군의 약화 및 소실을 야기하여 결국은 봉군의 사멸을 이끈다 (Sammataro et al., 2000).
일반적으로 응애의 침입에 대한 가장 일반적인 진단 방법은 형태학적 식별이다 (안 등, 2015). 특히 기문응애는 산란을 위한 이동을 제외하면 기문 내에만 존재하기 때문에, 꿀벌의 기문을 관찰하여 존재 여부를 판단할 수 있다. 꿀벌의 기문은 가슴에서 머리와 첫 번째 다리 쌍을 분리하면 드러나며, 이 부분을 해부현미경이나 전자현미경을 사용하여 관찰한다 (Sammataro, 2006). 그러나 이 방법은 소비적이고 실험자의 세밀하고 지속적인 관심이 필요하기 때문에 보다 간편하고 민감한 분자적 진단법이 요구되었다.
Polymerase chain reaction (PCR)법은 현재 의학적 연구 및 임상에서 분자적 진단법으로 응용되고 있는 실험법이다. 그러나 1회만 진행하는 일반적인 PCR은 100분자 이하의 적은 주형에 대해서 증폭이 어렵고, 증폭된다 하더라도 증폭양이 미미하여 판단이 모호한 경우가 발생한다. 이를 보완하기 위하여 1차 PCR 산물을 주형으로 진행하는 nested PCR법을 적용시켰다.
본 연구는 꿀벌성체와 봉변을 이용하여 기문응애의 특이 유전자를 추적하고자, 기문응애의 특이 유전자를 추적하는 PCR 기반의 유전자 검사법을 고안하였다. Nested PCR법은 극미량의 주형에 대해서도 증폭할 수 있어 민감도와 정확도 측면에서 강점을 가진다. 이 방법은 추후 기문응애의 실체가 확인됐을 때 육안검사와 함께 사용될 수 있는 빠르고 정확한 진단법이 되기를 기대하는 바이다.
재료 및 방법
공시시료
서양종 꿀벌 성체 (Apis mellifera)와 봉변 (Bee debris)은 경기도 수원, 강원도 강릉, 경북 청송, 전남 보성, 울산, 제주 등 전국 11개 지역으로부터 수집되었으며, 수집된 시료들은 -20℃에서 보관하며 본 연구에 사용하였다.
기문응애 유전자 합성 및 Recombinant DNA 제작
표준 DNA로 사용하기 위하여 기문응애의 특이 유전자를 합성하였다. Genbank에 보고된 기문응애 유전자 중, 미토콘드리아 DNA에 위치하는 Cytochrome oxidase subunit I (COI) 유전자 (Accession No. HQ162656)를 기준으로 합성할 부위를 설계하였다. 합성할 기문응애 COI 유전자는 299 bp 크기를 가지며, AW-299라 명명하였다. AW-299의 합성을 위하여 6개의 long-nucleotide를 설계하여 (Supplement table 1) 주문 제작하였고 (Bionics, Korea), 3단계를 거쳐 합성을 수행하였다.
또한, AW-299를 탑재한 재조합 DNA를 제작하여 pAW-COI299이라 명명하였으며, 탑재된 염기서열의 sequencing 분석을 의뢰하여 (Bionics) 기문응애의 고유 유전자임을 다시 한 번 확인하였다.
기문응애 검출을 위한 특이 detection primer & nested primer 설계
기문응애의 특이 유전자를 검출하기 위한 특이 primer 쌍을 설계하기 위하여, NCBI (National Center for Biotechnology Information)의 Primer-BLAST 프로그램을 사용하였다. 꿀벌이나 다른 꿀벌 기생충인 꿀벌응애, 중국가시응애 (Tropilaelaps clareae)의 것과 구분할 수 있고 기문응애만을 특이적으로 검출할 수 있는 detection primer (AW-COI-F/R) 및 nested primer (AW-COI-NF/NR)를 설계하였다 (Table 1).
기문응애 특이 detection PCR 및 nested PCR의 최적조건
초고속 PCR을 적용시키기 위하여 기문응애 특이 primer 쌍들의 농도와 기문응애 특이 PCR의 혼성온도의 최적조건을 확립하였다.
우선 기문응애 특이 detection PCR 및 nested PCR의 조성에서 detection primer와 nested primer의 최적농도를 구하기 위하여 각 기문응애 특이 primer 쌍의 최종농도를 0.5 μM (5 pmole/μL), 1.0 μM (10 pmole/μL), 2.0 μM (20 pmole/μL), 4.0 μM (40 pmole/μL)으로 조성하였다. Genechecker™ (Genesystem Corp., Korea)기기를 사용하였고, 재조합 DNA pAW-COI299 1.0×10⁸ 분자를 주형으로, 2×Rapimix (Genesystem Corp., Korea)에 각 농도의 primer 쌍을 넣어 반응액 당 총 10 μL가 되도록 조성하여 초고속 PCR을 수행하였다. 이때 detection primer를 사용한 초고속 PCR 조건은 Pre-denaturation 95℃ 30초 후, Denaturation 95℃ 2초, Annealing 55℃ 2초, Extension 72℃ 2초를 1 cycle로 하여 총 50 cycles이었으며, nested primer를 사용한 초고속 PCR 조건은 detection PCR과 동일하나 Annealing 온도를 50℃로 하여 반응시켰다. 또한, 기문응애 특이 detection PCR과 nested PCR의 최적 혼성온도 조건을 구하였다. 온도구배 PCR (Temperature-gradient PCR)이 가능한 기기인 PTC-200 Peltier thermal cycler (MJ Research, USA)를 사용하여 55±10℃의 온도범위에서 각 PCR의 혼성가능 온도를 추론하였다. 각 반응당 재조합 DNA pAW-COI299 1.0×10⁸ 분자를 주형으로 사용하였고, 각각의 특이 primer 쌍의 최종농도 1.0 μM, TOPsimple™ DryMIX-HOT (Enzynomics, Korea)를 사용하여 최종 20 μL PCR 반응액이 되도록 조성하였다. 결과는 1.5% agarose 전기영동으로 분석하였으며, 각 DNA 증폭산물의 density를 Image J program으로 측정하여 각 primer 쌍의 혼성가능 온도를 추론하였고, 이 결과를 초고속 PCR에 적용하여 검증하였다.
Detection primer (AW-COI-F/R)를 사용한 detection PCR은 혼성온도 52℃, 54℃, 56℃에서 수행하였으며, 각 반응 당 재조합 DNA pAW-COI299 1.0×10⁸ 분자부터 1.0×100 분자까지를 주형으로 사용하였고, 특이 primer의 최종농도는 2.0 μM, 2×RapiMix를 사용하여 최종 10 μL PCR 반응액이 되도록 조성하였다. PCR 조건은 Pre-denaturation 95℃ 30초 이후, Denaturation 95℃ 2초, Annealing 각 52℃ 54℃, 56℃에서 2초, Extension 72℃ 2초를 1 cycle으로 하여 총 50 cycles로 수행하였다. 한편, nested primer AW-COI-NF/NR을 사용한 nested PCR은 혼성온도 50℃, 52℃, 54℃에서 수행하였으며, PCR의 조성은 nested primer를 사용한 것을 제외하면 기문응애 특이 detection PCR과 동일하게 조성하였다. PCR 조건은 Pre-denaturation 95℃ 30초 이후, Denaturation 95℃ 2초, Annealing 각 50℃, 52℃, 54℃에서 2초, Extension 72℃ 2초를 1 cycle로 하여 총 50 cycles 수행하였다.
기문응애 특이 detection 및 nested PCR의 검출 한계 측정
확립된 최적조건 하에서, 기문응애 특이 detection PCR과 nested PCR의 검출한계를 측정하기 위하여 재조합 DNA pAW-COI299를 1.0×10⁸ 분자부터 1.0×100 분자까지 연속 희석한 것을 주형으로 사용하였으며, 2×RapiMix와 각 primer 쌍의 최적농도를 사용하여 총 10 μL PCR 반응액으로 조성하였다. 초고속 PCR은 각 최적 혼성온도에서 총 50 cycles를 진행하여 검출한계를 측정하였다. 최적조건에서의 검출한계와 정량범위를 측정하였으며 Ct (threshold cycles)값 및 Tm (mid-point of melting temperature)값과 주형 분자간의 회귀식 (regression equation) 및 결정계수 (R2)를 확인하였다.
공시시료로부터 기문응애 특이 유전자 검출
수집된 시료들은 서로 섞이거나 오염되지 않도록 하루 이상의 간격을 둬서 유전자를 추출하였으며, DNeasy Blood & Tissue Kit (Qiagen, USA)와 액체질소 (LN2)를 사용한 급속 동결을 통해 DNA를 추출하였다. 꿀벌시료는 날개를 제거한 것 1마리를, 봉변시료는 100 mg을 1.5 mL 원심분리관에 넣고 1.5 mL 원심분리관 전용 homogenizer를 사용하여 분쇄한 후, 제조사에서 제안하는 프로토콜을 따라 DNA 추출을 진행하였다. 또한, 날개를 제거한 꿀벌시료와 봉변 100 mg을 1.5 mL 원심분리관에 넣고 100 μL D.W.를 부가한 후 homogenizer를 사용하여 분쇄, 액체질소에 잠기게 하여 1분간 동결한 것을 상온에서 5분간 정치하여 녹였다. 이후 13,000 rpm에서 1분간 원심분리한 후 상등액 1.0 μL를 기문응애 특이 detection PCR의 초기기질로 사용하였다. 음성대조군으로 3차 멸균수를 사용하였고 양성대조군으로 재조합DNA를 사용하였다.
기문응애 특이 detection primer를 사용한 1차 PCR은 2×RapiMix, 최종농도 2.0 μM의 detection primer를 넣어 반응당 10 μL가 되도록 조성하였다. 초고속 PCR 조건은 Pre-denaturation 95℃ 20초 후, Denaturation 95℃ 2초, Annealing 56℃ 2초, Extension 72℃ 2초를 1 cycle로 하여 총 50 cycles의 초고속 PCR을 수행하였다.
이후 1차 PCR 증폭산물들을 각각 1/1,000로 희석하여 nested PCR의 주형으로 사용하였으며, 2×RapiMix, 최종농도 4.0 μM의 nested primer를 넣어 반응당 10 μL PCR 반응액이 되도록 조성하였다. 이때, 조건은 Pre-denaturation 95℃ 20초 후, Denaturation 95℃ 2초, Annealing 52℃ 2초, Extension 72℃ 2초를 1 cycle로 하여 총 50 cycles로 nested 초고속 PCR을 수행하였다. 결과는 Ct값과 Tm값의 비교 및 분석을 통하여 기문응애의 특이 유전자 유무와 감염정도를 계산하였다.
결과 및 고찰
기문응애 특이 유전자 합성 결과
기문응애 특이 long-nucleotide들을 순차적으로 사용하여 최종 299 bp 크기의 기문응애 특이 COI 유전자 합성여부를 확인하였다. AW-COI-F1/R1에 의한 증폭산물은 112 bp 크기를 가지고, 이를 주형으로 사용하여 F2/R2에 의해 신장시켰을 때는 214 bp, 최종적으로 F3/R3에 의해 신장되었을 때 299 bp 크기를 가지는 것을 확인하였다 (Supplement Fig. 1). 합성된 AW-299가 탑재된 pAW-COI299는 전문회사 Bionics에 sequencing 분석을 의뢰하였으며, 목적으로 했던 Accession No. HQ162656과 100% 일치함을 확인하였다 (Supplement Fig. 2).
기문응애 특이 detection PCR 및 nested PCR의 최적조건
초고속 PCR법에 적용시키기 위한 두 쌍의 기문응애 특이 primer의 최적 농도를 확립하기 위하여 0.5 μM, 1.0 μM, 2.0 μM, 4.0 μM의 최종농도로 조성하여 초고속 PCR을 진행하였다 (Table 2).
이론적으로 프라이머의 농도가 높을수록 혼성단계에서 주형가닥과 붙을 수 있는 프라이머의 수가 증가하게 되므로, 보다 빠른 증폭이 가능하여 빠른 Ct값이 측정된다. 그러나 실제 실험에서는 사용하는 프라이머의 혼성능력에 따라 최적의 농도가 있으므로, 측정된 각 농도별 Ct값 및 최종형광값 그리고 melting graph에서 비특이적 증폭 양상을 보이지 않는 조건을 실험을 통해 결정하였다. pAW-COⅠ299 1.0×10⁸ 분자를 주형으로 사용했을 때, detection primer는 2.0 μM, nested primer는 4.0 μM에서 가장 빠른 Ct값과 높은 최종형광값을 가지는 것을 확인할 수 있어 이를 두 기문응애 특이 primer의 최적조건으로 정립하였다.
Detection primer를 사용한 온도구배 PCR 결과, 실험된 전체 혼성온도에서 비교적 고른 증폭산물이 관찰되었으며, 52~56℃의 범위에서 많은 PCR산물이 생산되었다. 이를 바탕으로 detection PCR은 혼성온도 52℃, 54℃, 56℃의 Ct값 및 최종형광값, 검출한계를 기준으로 하여 최적 혼성온도를 판단하였다 (Table 3).

Summarization of data and detection limit of A. woodi-specific detection PCRs at each annealing temperature
Detection PCR은 54℃에서 가장 빠른 Ct값을 가지는 것을 확인할 수 있었다. 최종형광값은 모든 혼성온도에서 큰 차이가 없었으나, 검출한계는 56℃에서 가장 우수함을 확인하였다. 따라서 56℃를 기문응애 특이 detection PCR의 최적 혼성온도로 결정하였다.
한편, nested primer를 사용한 온도구배 PCR은 60℃ 이하에서 고른 증폭산물이 관찰되었고, 50~54℃의 온도 범위에서 보다 많은 PCR 산물이 생산되었다. 이를 토대로 nested PCR은 혼성온도 50℃, 52℃, 54℃에서 Ct값 및 최종형광값, 검출한계를 기준으로 최적의 혼성온도를 구하였다 (Table 4).
Nested PCR은 혼성온도 52℃에서 가장 빠른 Ct값을 가지는 동시에 우수한 검출한계를 가진다고 판단하였으며, 52℃를 nested PCR의 최적 혼성온도로 결정하였다.
기문응애 특이 detection PCR은 primer 최적농도 각 2.0 μM (최종농도), 혼성온도 56℃에서, 그리고 기문응애 특이 nested PCR은 primer 최적농도 4.0 μM (최종농도), 혼성온도 52℃에서 빠른 Ct값과 높은 검출한계를 가지는 것을 확인함으로써, 각 primer 쌍에 의한 초고속 PCR에서 최적조건으로 사용하였다.
기문응애 특이 primer의 검출한계 측정
두 쌍의 기문응애 특이 primer의 민감도를 평가하기 위하여 결정된 최적 혼성온도 및 primer 농도에서 재조합 DNA 주형을 1.0×10⁸ 분자부터 1.0×100 분자까지 연속 희석한 것을 초고속 PCR의 주형으로 사용하였으며, 이에 대한 검출한계 및 민감성을 측정하였다 (Fig. 1, Supplement Fig. 3).
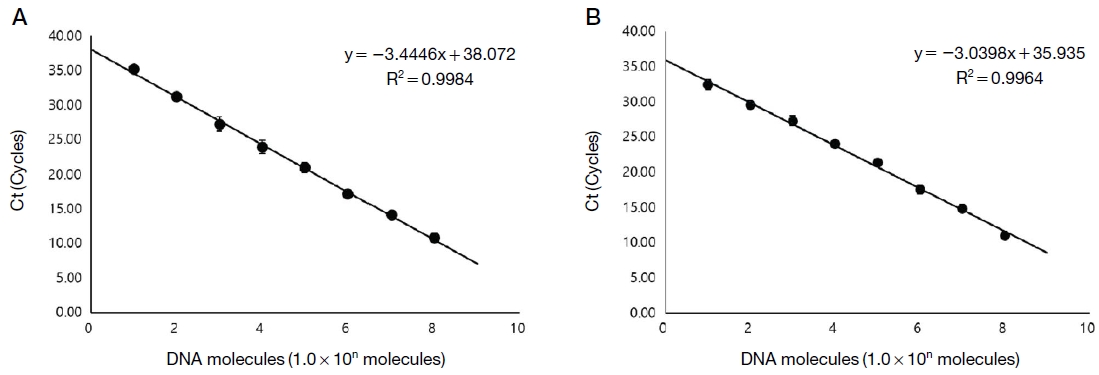
Detection limit in each A. woodi-specific PCR. Each ultra-rapid A. woodi-specific PCR was performed at optimal condition. pAW-COⅠ 299 as template was diluted from 1.0×10⁸ to 1.0×100 molecules/PCR, respectively. Panel A show detection limit for A. woodi-specific detection PCR. It was calculated regression equation (y= -3.4446x+38.072) and regression coefficient (R2=0.9984). Panel B show detection limit for A. woodi-specific nested PCR. It was calculated regression equation (y= -3.0398x+35.935) and regression coefficient (R2=0.9964).
기문응애 특이 detection PCR은 1.0×101 분자 이상의 정량 증폭이 가능함을 보여주었다. Ct값과 주형 분자 수를 사용한 회귀식은 y= -3.4446x+38.072로 계산되었으며, 이에 따른 결정계수는 R2=0.9984로 나타나 높은 정량성을 보여주었다. Tm값은 72.10±1.04℃로 측정되었다. 기문응애 특이 nested PCR 또한 1.0×101 분자 이상이 정량적으로 증폭됨을 확인하였다. Ct값과 주형 분자 수를 사용한 회귀식은 y=-3.0398x+35.935로 계산되었으며, 이에 따른 결정계수는 R2=0.9964로 나타나 높은 정량성을 가짐을 보여주었다. Tm값은 70.70±0.22℃로 측정되었다 (Supplement table 2).
공시시료로부터 기문응애 특이 유전자 검출
국내 11개 지역에서 수집된 기문응애 감염 의심 꿀벌 성충 및 봉변으로부터 추출한 DNA를 기문응애 특이 detection PCR의 주형으로 사용하였다.
결과로써, 기문응애 특이 detection PCR에서는 S4, US, MI, G 4개 시료에서 PCR 증폭이 관찰되었다. 이들은 표준 DNA (pAW-CO I 299)와 유사한 Tm값을 보였으며 (Fig. 2), 전기영동에 의한 PCR 산물의 크기분석에서도 표준 DNA의 PCR 산물 (299 bp)과 유사한 크기를 보였다 (자료 미제시).
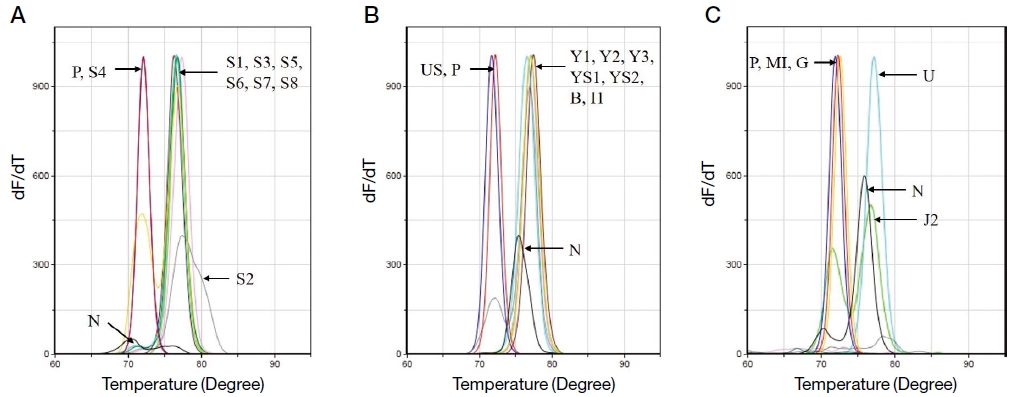
Detection of A. woodi by A. woodi-specific detection PCR. Samples of DNA extracted from each region were used as initial template and performed by A. woodi-specific detection PCR. Panel A, Of the eight samples, S4 was only specific amplification. Panel B, Of the eight samples, US was specific. Panel C, Of the seven samples, MI and G were specific. The four samples were measured to have values similar to the Tm value of standard DNA (72.10±0.00℃).
한편, 기문응애 특이 detection PCR 결과에서 기문응애 특이 유전자가 증폭된 S4, US, MI, G의 Ct값을 회귀식 y=-3.4446x+38.072 (Fig. 1A)에 대입하여, 각 시료에는 μL당 1.3×100 분자, 1.8×100 분자, 1.1×10⁻¹ 분자, 2.1×100 분자가 존재하는 것으로 추정되었다 (Table 5).
1회 진행한 detection PCR에 의한 결과는 23개 시료 중, 4개의 시료만 양성, 나머지 19개 시료는 모두 음성으로 판단되었다. Detection PCR에 의한 증폭산물을 각기 1,000배 희석하여 nested PCR의 초기 주형으로 사용한 2차 PCR을 수행하였다.
결과로, detection PCR에서 양성으로 판정하였던 S4, US, MI, G 모두 nested PCR에서 표준 DNA의 PCR 산물의 Tm값 (70.60±0.50℃)과 유사함이 재차 확인되었을 뿐만 아니라, 1차 PCR (A. woodi-specific detection PCR)에서 음성으로 판정되었던 11개 시료에서 추가로 양성의 결과를 보였다. 이는 PCR의 정규 증폭, Tm값 유사도, 전기영동에 의한 증폭산물 크기 비교 (217 bp)의 결과로 판정된 것이다 (Fig. 3).
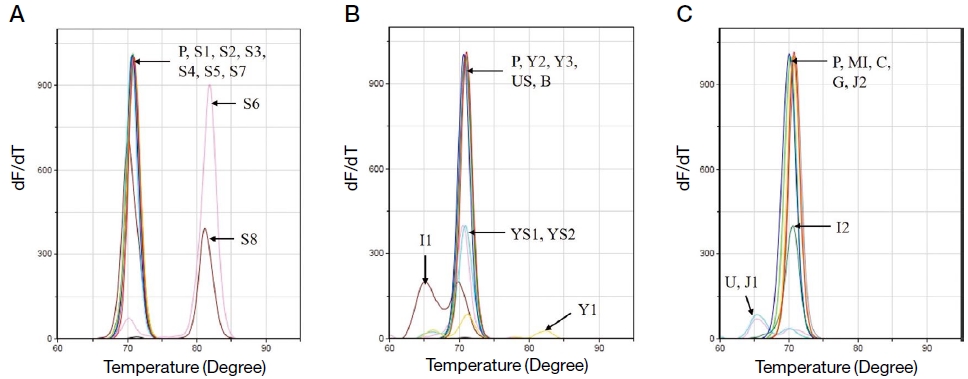
Secondary detection of A. woodi gene by A. woodi-specific nested PCR. Secondary PCR was performed using 1:1000 diluted A. woodi-specific detection PCR product. Panel A, all Tms except S6 and S8 were identical with positive one. Panel B, Tm of Y2, Y3, US and B were identical with positive one. Panel C, all Tms except U and J1 were identical with positive one. The 15 samples were measured to have values similar to the Tm value of standard DNA (70.60±0.50℃).
Nested PCR 결과는 융점분석과 agarose gel 상에서의 증폭산물 여부를 통해 판단하였으며, 앞서 detection PCR에서 증폭되었던 4개의 시료 (S4, US, MI, G)와 11개의 시료 (S1, S2, S3, S5, S7, Y2, Y3, B, I2, C, J2)를 포함하여 총 15개의 시료가 양성으로 판정되었다. Y1, YS1, YS2, I1의 Tm값은 표준 DNA와 유사한 것으로 측정되었으나, 추가로 진행한 전기영동에 의한 증폭산물 비교에서 모호함이 있어 의양성으로 판정하였다 (자료 미제시). 표준 DNA의 Tm값과 차이를 보인 S6, S8, US, J1은 음성으로 판정하였다 (Table 6).
23개 시료에 대한 기문응애 특이 detection PCR 및 nested PCR을 수행하여 최종적으로 15개의 양성, 4개의 양성, 4개의 음성결과를 얻었다.
기문응애 특이 유전자 Sequence 분석
양성으로 판단한 15개 시료의 증폭산물이 기문응애의 고유 유전자임을 명확히 하기 위하여 증폭된 PCR 산물의 sequencing 분석을 의뢰하였다 (Bionics). AW-COI-NF/NR을 사용한 양방향 sequencing을 진행한 결과, 평균 187 bp의 서열이 확인되었다. 15개 시료에 대해 공통적으로 추론된 염기서열은 기문응애 고유의 COI 유전자와 100% 일치하였으며, 각 시료에 대한 계통수를 작성하였다 (Fig. 4).
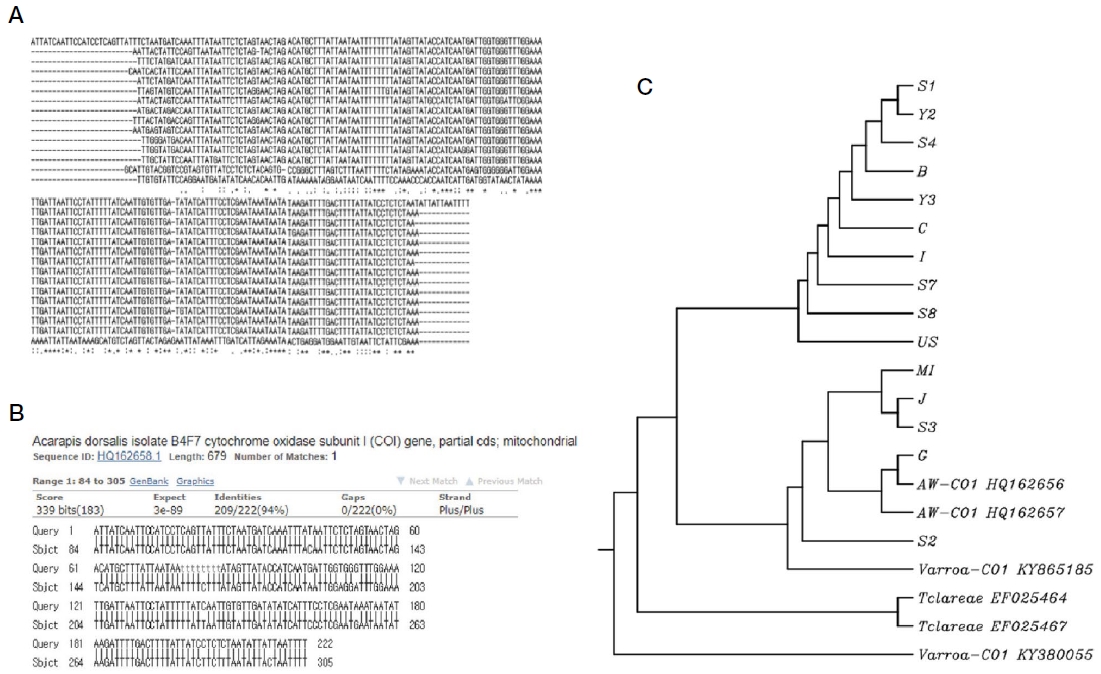
Sequence analysis of 15 samples. Sequencing of 15 samples that was detected by A. woodi-specific primers showed specific amplification using AW-COI-NF/NR in both directions, around 187 bp mutually identical nucleotide sequences were obtained. Panel A, the sequence comparison for 15 samples that proceeded in one direction. Panel B, A common sequence of 15 samples was 100% match with the specific COⅠ gene of tracheal mite. Panel C, The phylogenetic tree of 15 samples with tracheal mite, Varroa mite and Tropilaelaps spp.
공통으로 추론된 염기서열은 100% 상동성을 보였으나, 15개 시료 각각의 염기서열은 기문응애의 유전자 와 99.4%의 상동성을 보임으로써, 증폭된 시료들은 모두 기문응애의 고유 유전자라 판단하였다. 꿀벌응애 (Varroa-CO1)와는 27.0%, 그리고 중국가시응애 (T. clarae)와는 33.0%의 상동성을 보임을 확인하였고, 계통수에서도 꿀벌응애나 중국가시응애와 구분됨을 확인하였다.
적 요
기문응애는 1919년 최초 발견 이래 세계적으로 다양한 나라 및 지역에서 발견되고 있다. 2015년 국내 기문응애 관련 보고에 따르면, 99개 시료를 이용한 실험 중 1개 시료에서 기문응애 특이 유전자가 검출되었으나 그 실체는 발견되지 않았었다. 그 이후로 기문응애와 관련된 문헌이 지속적으로 발표되지 않아, 기문응애의 존재 및 피해에 대한 인식이 부족한 현황이다. 이와 더불어, 꿀벌의 내부기생충인 기문응애의 육안관찰에 큰 어려움이 있어, 분자적 기법을 이용한 기문응애 특이 nested PCR법을 개발하고자 하였다.
Nested PCR법은 100분자 이하의 주형도 증폭 가능하게 함으로써, 시료 내 극미량 존재할 수 있는 기문응애의 유전자를 검출할 수 있었다. 1회의 초고속 PCR (detection PCR)은 23개 시료 중 4개의 시료만이 양성 결과를 보였으나, 연속으로 진행한 nested 초고속 PCR에서는 11개의 시료가 추가로 양성 결과를 보였다. 이처럼 우리는 nested PCR법을 적용시킴으로써 총 15개의 시료에서 기문응애의 특이 유전자가 검출된 것을 확인함으로써, 보다 정확하고 민감한 유전자 검사법이 되도록 개발할 수 있었다.
우리는 분자 진단 결과를 근거로 특이 유전자가 검출된 시료로부터 기문응애의 실체를 확인하기 위한 실험도 함께 진행하였으나, 채집된 개체들에서는 확인할 수 없었다. 그러나 기문응애 특이 유전자 진단을 통한 국내 기문응애의 존재 가능성을 제시하였으며, 이를 근거로 실체 확인을 비롯한 기문응애의 지속적인 연구가 필요하다고 사료된다.
Acknowledgments
본 연구는 2018학년도 농촌진흥청 연구사업 (세부 과제번호: PJ01408002) 지원에 의하여 수행되었으며, 농림축산식품부의 재원으로 농림수산식품기술기획평가원의 농생명기술개발 사업 (과제번호 318093-03)과 수출전략기술개발사업 (과제번호 115067-02)에 의한 연구 결과물임을 밝힙니다.
References
- 안아진, 안성규, 노진형, 김하영, 유미선, 강승원, 우도현, 신성식, (2015), Molecular prevalence of Acarapis mite infestations in honey bees in Korea, Korean J. Parasitol., 53, p315-320.
- Kojima, Y., M. Yoshiyama, K. Kimura, and T. Kadowaki, (2011), PCR-based detection of a tracheal mite of the honey bee Acarapis woodi, J. Invertebr. Pathol., 108, p135-137.
- Lindquist, E. E., (1986), The World Genera of Tarsonemidae (Acari: Hetersotigmata): A morphological, phylogenetic and systematic revision with a reclassification of family-group taxa in the Heterostigmata, Mem. Entomol. Soc. Can., 136, p1-517.
-
Pettis, J. S., and Wilson, W. T., (1996), Life history of the honey bee tracheal mite (Acari: Tarsonemidae), Ann. Entomol. Soc. Am., 89, p368-374.
[https://doi.org/10.1093/aesa/89.3.368]

- Sammataro, D., Gerson, U., and Needham, G., (2000), Parasitic mite so honey bees: Life history, implications and impact, Annu. Rev. Entomol., 45, p519-548.
- Sammataro, D., (2006), An easy dissection technique for finding the tracheal mite, Acarapis woodi (Rennie) (Aari: Tarsonemidae), in honey bees, with video link, Int. J. Acarol., 32, p339-343.
- Wilson, W. T., J. S. Pettis, C. E. Henderson, and R. A. Morse, (1997), Tracheal Mites, In: Honey Bee Pests, Predators, and Diseases R.A. Morse Eds., and K. Flottum, Third edition, A.I.Root Co., Medina, OH., p253-278.
-
Yang, B., G. Peng, T. Li, and T. Kadowaki, (2013), Molecular and phylogenetic characterization of honey bee viruses, Nosema microsporidia, protozoan parasites, and parasitic mites in China, Ecol. Evol., 3, p298-311.
[https://doi.org/10.1002/ece3.464]

Appendix

Artificially synthesized A. woodi-specific DNA. Using six A. woodi-specific long-nucleotides sequentially, the artificial synthesis were performed. The amplified products by AW-COⅠ-F/R had a size of 112 bp (A), 214 bp when expanded by F2/R2 (B). When finally elongated by F3/R3, it was 299 bp (C). It was produced as recombinant DNA and used as standard DNA.
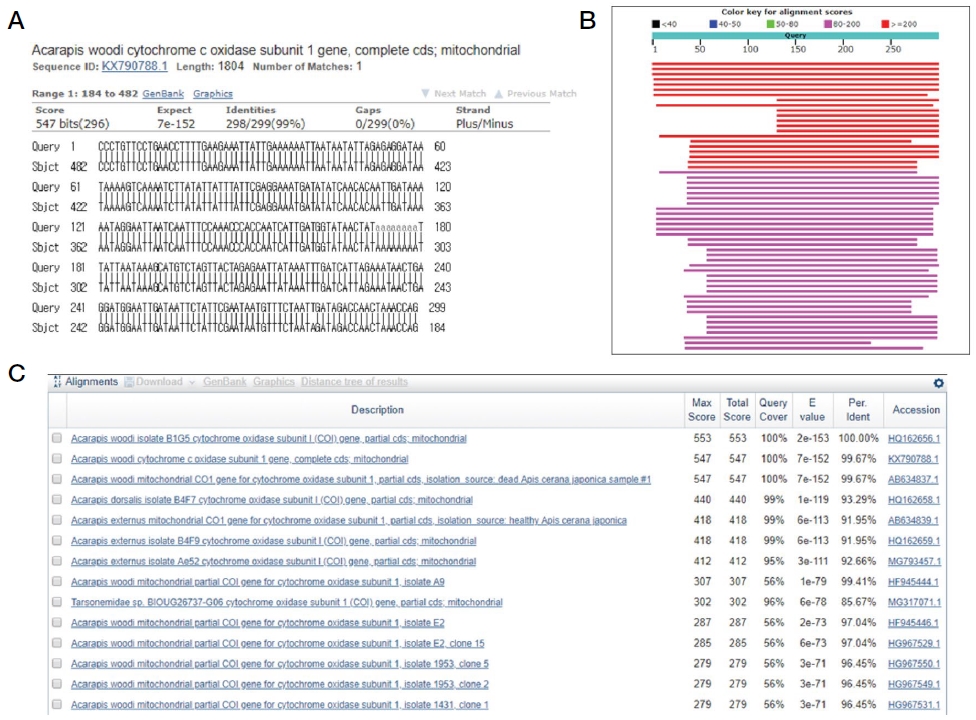
Sequence analysis of pAW-COⅠ299. Sequencing of pAW-COⅠ299 showed specific amplification using AW-COI-F/R, 299 bp mutually identical nucleotide sequences were obtained. When compared with HQ162656, it was confirmed that 100% match. Because the homology was 93% or less except for tracheal mite, it was judged to be a mite specificity gene.
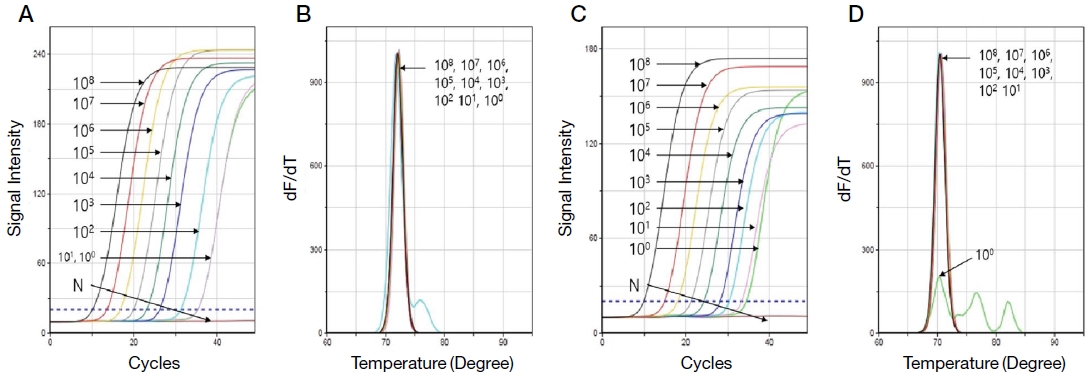
Detection limits of A. woodi-specific detection PCR and nested PCR. Each ultra-rapid A. woodi-specific PCR was performed at optimal condition. pAW-COⅠ299 as template was diluted from 1.0×10⁸ to 1.0×100 molecules/PCR, respectively. Panel A, up to 100 molecules can be amplified, and quantitative amplification is possible up to 101 molecules by detection PCR. Panel B, all peaks were similar (72.43±1.50℃). Panel C, up to 100 molecules can be amplified, and quantitative amplification is possible up to 101 molecules by nested PCR. Panel B, expect 100 molecules, all peaks were similar (70.70±0.22℃).