ICT 기반 이중 적외선 센서를 이용한 꿀벌 출입 자동 모니터링 시스템
Abstract
Honey bees are a vital part of the food chain as the most important pollinators for a broad palette of crops and wild plants. The climate change and colony collapse disorder (CCD) phenomenon make it challenging to develop ICT solutions to predict changes in beehive and alert about potential threats. In this paper, we report the test results of the bee-counting system which stands out against the previous analogues due to its comprehensive components including an improved dual infrared sensor to detect honey bees entering and leaving the hive, environmental sensors that measure ambient and interior, a wireless network with the bluetooth low energy (BLE) to transmit the sensing data in real time to the gateway, and a cloud which accumulate and analyze data. To assess the system accuracy, 3 persons manually counted the outgoing and incoming honey bees using the video record of 360-minute length. The difference between automatic and manual measurements for outgoing and incoming scores were 3.98% and 4.43% respectively. These differences are relatively lower than previous analogues, which inspires a vision that the tested system is a good candidate to use in precise apicultural industry, scientific research and education.
Keywords:
ICT, Beekeeping, Beecounter, Infrared sensor, Monitoring system서 론
미국에서 처음 보고된 군집붕괴현상 (CCD, Colony collapse Disorder)과 극심한 기후변화로 인해 봉군 관리에 대한 관심이 점차 높아지고 있다 (Ellis et al., 2010). 꿀벌은 주변환경에 매우 민감한 곤충으로, 기후변화에 따른 생리학적·행동학적 변화와 각종 질병에 의한 위협을 받고 있으며, 특히 밀원식물의 개화 상태와 화밀 분비에 큰 영향을 받는다 (Scaven and Rafferty, 2013). 국내에서는 최근 기후변화로 인해 벌꿀 생산에 70% 이상을 차지하는 아까시 나무의 동시 개화 현상이 일어나는 등 밀원식물의 개화 상황의 변동으로 벌꿀 생산이 크게 감소하였다 (산림청, 2017). 이러한 외부 환경 변화에 따른 봉군 내부의 꿀벌 활동과 외부 환경에 반응하는 꿀벌의 외역 활동을 지속적으로 원격에서 모니터링하는 기술에 대한 요구가 증가하고 있는 실정이다.
최근 다양한 농업 생산 분야에서 정보통신기술 (ICT, Information and Communications Technologies)을 융복합 기술로 접목하여 괄목할 만한 발전을 이루고 있다 (Basnet and Bang, 2018). 최근 양봉산업분야에서도 ICT기술을 도입하여 봉군 내·외 활동 상황을 지속적으로 자동 예찰, 감시하는 체계를 확립하여 봉군관리효율을 극대화하는 추세에 있다 (Gil-Lebrero et al., 2016; Sampangi and Sampalli, 2017; Debauche et al., 2018; Dineva and Atanasova, 2018). 국내에서는 김과 정 (2015)이 클라우드를 기반으로 한 실시간 정보 송출이 가능한 봉군 온·습도 모니터링 시스템을 구현한 바 있으며, 이에 추가하여 음파, 이산화탄소, 암모니아, 황화수소 농도 등 다양한 봉군내·외 물리적, 화학적 요인들에 대한 ICT융복합 시스템 개발 연구가 추진중에 있다 (임, 2015; 김 등, 2017). 하지만 이러한 봉군 내·외 환경적 요인들의 변동상황을 감시하는 체계만으로는 이에 반응하는 꿀벌의 직접적인 행동 양상을 추적하는 데 어려움이 있다.
외역봉 (外役蜂)의 외부 활동에 관련한 행동 패턴은 벌통 내·외의 다양한 물리·화학적 환경 요인과 더불어 봉군 내 식량의 충족도, 여왕벌의 산란, 분봉열 발생 여부는 물론 주변 밀원식물의 개화 유밀 상태에 관한 중요한 지표로 활용할 수 있다 (Abou-Shaara, 2014). 이와 더불어 일벌의 외역 활동을 응용한 꿀벌의 방화행동을 예찰하여 화분 매개의 효율을 분석하는 연구도 병행된 바 있는데, 이러한 연구는 주로 수동 분석에 의존해 왔다 (Verma and Dulta, 1986; 정과 최, 1988; Abrol, 2007; 한 등, 2009; 김 등, 2011; Dukku et al., 2013; Abou-Shaara, 2014).
꿀벌의 방화행동에 대한 수동 분석은 빠르게 날아가는 수백 마리의 꿀벌을 눈으로 전부 포착하는 것에 한계가 있다. 이를 극복하기 위해 꿀벌을 비롯하여 여러 곤충들의 빠른 움직임을 효율적으로 모니터링 할 수 있도록 RFID (Radio-Frequency Identification) 태그 (Streit et al., 2003; Robinson et al., 2009; Stelzer and Chittka, 2010; Schneider et al., 2012; Gill and Raine, 2014; He et al., 2016; Nunes-Silva et al., 2019), 카메라 영상 이미지 분석 (Chen et al., 2012; Chiron et al., 2013, 2014; Tashakkori and Ghadiri, 2015; Tu et al., 2016; Magnier et al., 2018), 적외선 센서 (Kevan et al., 2009; Geier et al., 2016; Jiang et al., 2016; Pešović et al., 2017) 등을 활용한 다양한 기술에 대한 연구가 이루어져 왔다.
본 연구에서는 적외선 센서를 활용한 기존 연구를 개선하여 효율적으로 꿀벌의 출입 활동량을 실시간 원격으로 모니터링 할 수 있는 ICT기반 시스템을 구현하였으며, 수동 모니터링 방식과의 실효성을 비교하였다. 향후 다양한 봉군 내·외 환경 요인에 대한 모니터링 시스템 확장을 통한 복합정보들을 축적하여, 기후 변화에 대응할 수 있는 봉군 관리 체계와 봉군의 활동 양상에 관한 ICT 융복합 연구의 발전방향을 제시하고자 한다.
재료 및 방법
시스템 구성 및 알고리즘
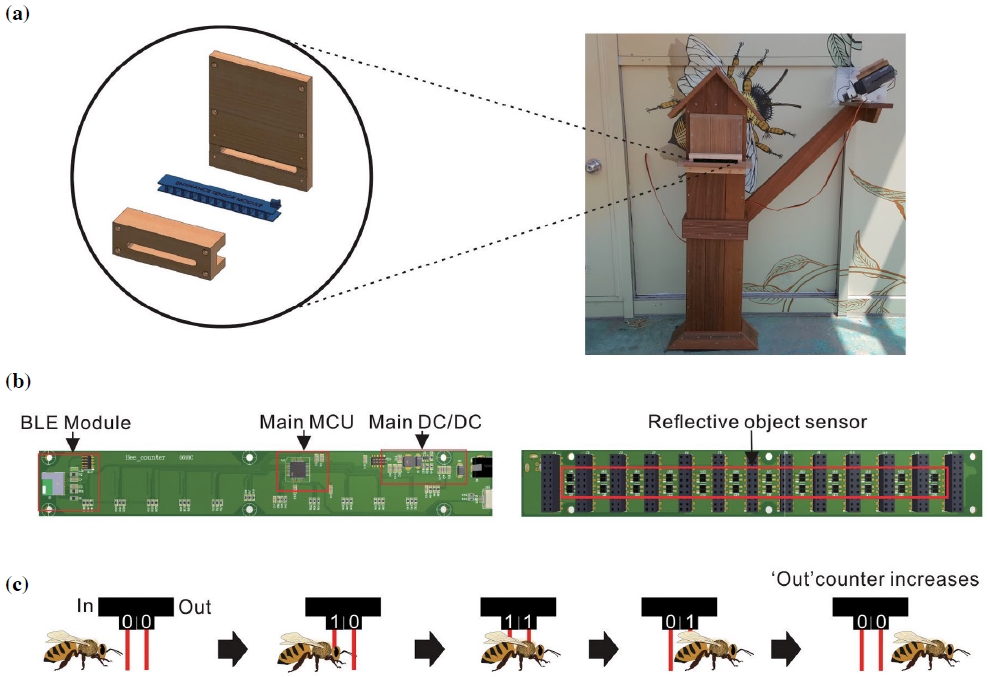
이 연구를 위해 구현한 꿀벌 출입 모니터링 시스템은 국립과천과학관 (곤충생태관) 내 제작된 벌통 입구에 Figure 1a와 같이 설치하였으며, 본 시스템의 주요 구성요소는 Figure 1b, Table1과 같다. 꿀벌의 출입 여부에 관한 분석은 12개의 출입통로에 장착한 두 개의 반사형 적외선 센서 (QRE111)에서 각각 감지되는 값들을 메인 MCU (MicroController Unit)에 입력하여 알고리즘에 따라 디지털 정보로 처리하였다. 알고리즘은 Figure 1c에서 설명한 바와 같이 초기 센서 값은 모두 0으로 지정하고, 꿀벌이 외부로 출봉하는 경우 내부 센서가 먼저 이를 감지하고 (1,0), 외부 센서가 감지 (1,1)한 후, 두 개의 센서 값이 차례로 (0,1), (0,0)이 되면 출봉수를 입력한다. 반대의 경우 입봉수를 입력한다.

The overall Bee-Counting system diagram. (a) The design of the Bee counting system (blue) installed in the Gwacheon National Science Museum. (b) The Bee-Counting system hardware and (c) algorithm.
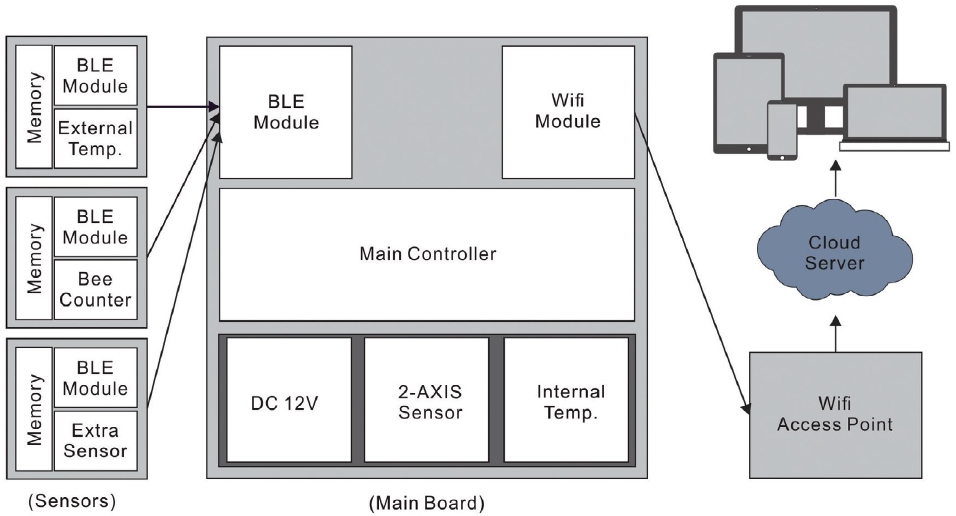
꿀벌 출입 모니터링 시스템을 비롯하여, 향후 확장 가능한 센서들의 값을 각각 BLE (Bluetooth low energy) 모듈을 통해 메인 보드로 전송하는 방식으로 시스템의 확장성을 확보하였다. 메인 보드로 전송된 데이터를 Wifi무선 네트워크를 통해 클라우드에 데이터를 저장하여 다양한 ICT기술로 활용가능하게 구성하였다 (Fig. 2).
실효성 검증
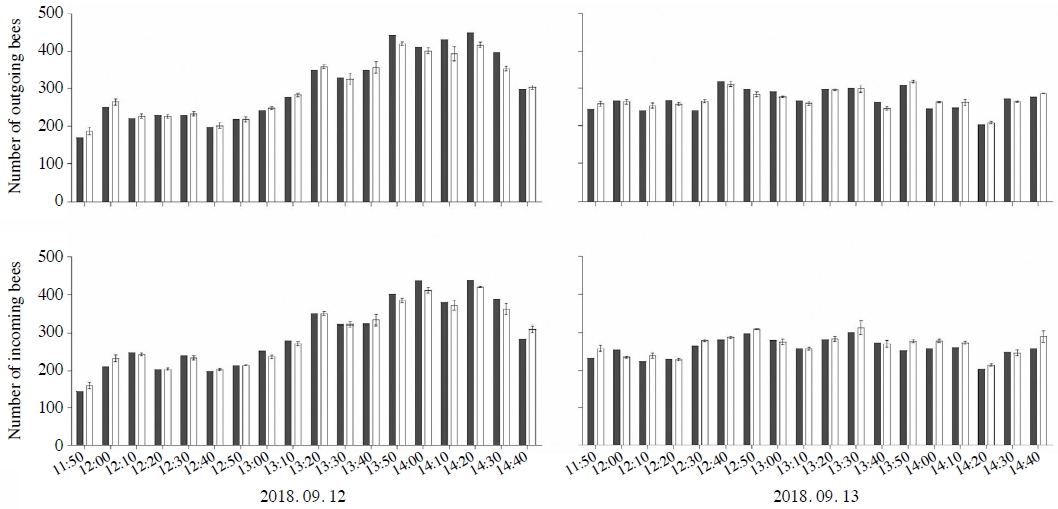
본 시스템의 정확도를 확인하기 위해 국립과천과학관 (곤충생태관)에 설치한 봉군 입구에 카메라 (SJ9000 HD, Shenzhen baker audio digital technology co., Hong Kong)를 설치하여 특정 시간대 동영상을 제작하였다. 영상을 10분 단위로 분할하여 출입량을 계수하였고, 측정자에 따른 오차를 고려하여 같은 영상에 대해 3인 반복 측정을 수행하였다 (Fig. 3). 수동 분석 측정값과 자동 모니터링 시스템 측정값의 상대적 오차를 다음과 같이 계산하였다.
이와 더불어 내·외부 온도센서를 부착하여 시스템의 확장성을 확보하였고, 정확도를 검증하기 위한 시험 기간은 2018년 9월 5일부터 10월 4일까지였고, 국립 과천 과학관에 학습 전시용으로 사육 중인 봉군을 대상으로 수행하였다.
결과 및 고찰
이중 적외선 센서를 이용한 꿀벌 출입 자동 모니터링 시스템은 국립과천과학관 (곤충생태관)에 설치하여 알고리즘의 정확도, 시스템의 확장성 및 과학적 활용을 위한 데이터를 수집하였다. 시스템을 통해 자동 측정한 값과 촬영한 영상으로 3인이 수동으로 측정한 수치를 비교 분석한 결과는 Figure 4와 같다. 각 막대는 평균값±상대 오차 (SE)를 나타낸다 (Fig. 4). 10분 단위, 36구간의 출봉량과 입봉량에 대한 두 측정값의 상대적 오차는 각각 3.98%/4.43%로 근접한 수준이었다. 본 시스템을 통하여 수동 분석의 단점 (소요시간 및 인력)을 보완하면서 유사한 결과 값을 수집할 수 있다는 것을 확인하였다.

Comparative analysis of manual (grey) and automatic (white) bee-counting systems in 10 minutes. Each bar represents the mean±SE (Nmanual=3).
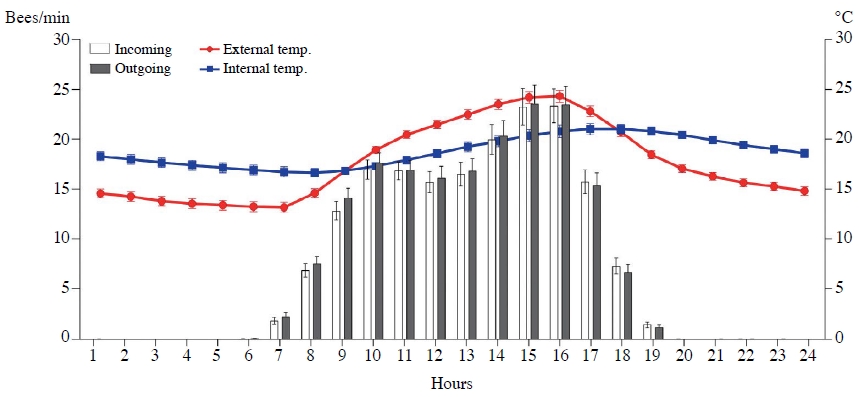
본 연구에서 하나의 모듈과 다수의 모듈이 통신을 할 수 있고, 전력·크기·비용의 측면에서 경제적인 차세대 근거리 데이터통신기술인 BLE 모듈 (Boualouache et al., 2015)을 이용하여 꿀벌 출입 자동 모니터링 시스템에 내·외부 온도 센서를 추가함으로써 확장성을 검증하였다. 이를 통해 자동 기록한 외부 온도 센서 데이터는 인근 지역에 대한 기상청 관측 자료와 유사하였으며, 내부 온도 센서는 벌통의 모서리에 설치하여 측정한 값으로 Figure 5에서 볼 수 있듯이 외부 온도와 무관하게 하루평균 약 18.7°C (±0.3°C)로 비교적 일정하게 유지되었다. 이는 내부 온도가 18~19°C일 때 봉구 온도가 최적 육아권 온도인 33~35°C로는 보고에 부응하는 값이었다 (장과 이, 1998).

Daily dynamics of outgoing/incoming honeybees’ average number (bees/min) and internal/external temperature (°C) on average for 30 days from 5th September to 4th October. Each bar and point represents the mean±SE (Nday=30).
꿀벌의 방화행동에 대한 선행 연구들은 주로 밀원식물의 꽃에 방문한 개체 수를 중심으로 관찰한 내용이었다 (정과 최, 1988; 한 등, 2009; 김 등, 2011; Abou-Shaara, 2014). 본 연구에서 자동 꿀벌 출입 모니터링 시스템을 통해 수집된 데이터를 기반으로 단일 봉군 수준의 방화 행동을 분석하였다. 2018년 9월 5일부터 10월 4일까지 하루 평균 10,900±514마리가 출역하고 10,695±491마리가 귀소하였다 (Table 2). 수집된 데이터값에 의하면 출역한 꿀벌 중 평균적으로 약 1.88% (205±29마리)가 귀소하지 못한 것을 확인하였다. RFID나 마킹 태그 이미지 분석을 이용한 선행연구에서 천적, 퇴출, 자연사 또는 태그의 탈착 등에 의하여 하루 약 20~40%가 손실됨을 관찰하였는데 (Decourtye et al., 2011; Chen et al., 2012), 이는 태그가 부착된 벌들을 대상으로만 관찰이 가능하고 부착태그의 영향요인이 있기 때문으로 볼 수 있다 (Souza et al., 2018). 추가 부착물 없이 봉군 전체의 이동량을 파악할 수 있는 본 시스템이 전체적인 미복귀 꿀벌의 파악에 알맞은 것으로 사료된다. 이와 같은 꿀벌 미복귀 수에 대한 모니터링은 궁극적으로 군집붕괴현상 (CCD)의 중요한 지표가 될 수 있을 것이다.
시간대별 평균 방화행동량과 온도를 분석해본 결과 Figure 5에서 볼 수 있듯이 외부 온도가 증가하기 시작하는 오전 7시부터 꿀벌의 출입 활동이 증가하기 시작하였으며, 오전은 10시, 오후는 3~4시 각각 분당 입·출봉 각각 평균 18마리, 23마리로 최고 피크를 보인 후 외부 온도가 낮아지는 오후 5시부터 감소하였다. 온도 변화에도 불구하고 오전 10시에 피크를 보인 후 정오에 오히려 외역활동량이 감소하는 것을 볼 수 있었다. 이 결과는 오전의 높은 상대습도에 의한 왕성한 유밀에 의하여 방화행동량이 최고 피크를 이루고, 정오가 되면서 상대습도가 떨어져 유밀이 감소하기 때문이며, 이후 광주기, 일사량 등이 영향을 끼쳐 다시 증가한다는 Núñez (1977)의 추론에 의해 해석할 수 있다. 향후 본 시스템과 온도 이외 습도, CO2 농도, 방향성 화합물 등 모니터링 시스템들의 추가 확장을 통한 데이터 축적으로 방화행동에 대해 보다 정밀한 상관관계 분석이 가능할 것으로 사료된다.
호주 연방과학산업연구기구 (CRISO)는 꿀벌에 RFID 태그를 달아 꿀벌을 직접 모니터링 하는 연구를 수행하고 있으나 1) RFID 태그의 추가 비용, 2) 태그 무게의 영향, 3) 개체에게 끼치는 부착 태그의 영향, 4) 태그 미부착 개체 감지불가 등의 한계점을 제시하고 있다 (Souza et al., 2018). 최근, 벌통 입구 상단부에 설치한 카메라로 영상을 녹화하여 SNR (Singal to Noise Ratio) 분석 (Tashakkori and Ghadiri, 2015), 배경분리 (Background subtraction) 분석 (Tu et al., 2016), 3D 분석 (Chiron et al., 2013, 2014), 이미지 카운팅 소프트웨어 (Magnier et al., 2018) 등을 활용하여 꿀벌의 활동을 모니터링 하는 방식이 연구되고 있다. 그러나 현재까지의 영상 가공 이미지 분석 방법은 입구 주변의 꿀벌 밀도가 높을 때 측정이 불가능하거나 낮은 정확도를 보이며, 분석을 위해 높은 해상도와 초당 프레임수를 요구하는 카메라, 영상 저장용 저장장치 및 매체 등이 필요하기에 비용 면에서 비교적 경제적이지 못하다. 이에 반해 적외선 센서를 이용한 자동 꿀벌 출입 모니터링은 추가적인 비용과 노력 없이 보다 정확하게 입구를 드나드는 모든 꿀벌을 파악할 수 있는 장점을 가지고 있어, 해외에서는 각기 다른 모듈을 통해 시도한 것으로 알려져 있다 (Kevan et al., 2009; Jiang et al., 2016; Pešović et al., 2017).
본 연구와 기존의 적외선 센서를 이용한 자동 출입 모니터링은 기본적인 알고리즘이 유사하다 (Fig. 1c). 그러나 본 연구와 가장 유사한 방식의 원격 모니터링 기반의 (Jiang et al., 2016) 연구에서 10분 단위, 27구간의 출봉량과 입봉량에 대한 수동 분석값과의 상대적 오차는 각각 10.71%/9.59%로, 36구간에서 상대적 오차가 3.98%/4.43%인 이번 연구의 결과에 비해 2배 이상 높은 것을 볼 수 있다. 이는 기존의 연구에서 사용된 이중 적외선 센서는 모두 전송기 (transmitter)에서 나온 적외선 파장을 수신기 (receiver)가 받아들이는 과정에 물체 방해가 감지되는 투과형 광전센서 (transmission photosensor)인 반면, 이번 연구에서 사용된 적외선센서 (QRE1113)는 전송·수신기가 하나로 되어서 물체로부터 반사되는 빛을 감지하게 되는 반사형 광전센서 (reflective photosensor)로 비교적 계수에 효율적이기 때문이다 (이병철, 2016). 투과형 적외선센서를 이용한 뒤영벌의 출입 모니터링 시스템은 수동 분석과의 정확도가 높았으나 (Kevan et al., 2009), 뒤영벌과 꿀벌의 크기 및 빛에 대한 투과·반사율의 차이가 있어 비교가 불가능하다고 사료된다.
본 연구에서 ICT를 기반으로, 이중 적외선 센서를 이용한 자동 꿀벌 출입 모니터링을 위한 시스템을 구현하여 실효성을 검증하였고, 축적한 데이터를 꿀벌의 행동학적 분석 도구로 활용할 수 있음을 보였다. 또한, 국립과천과학관 내에 본 시스템을 자연관찰 학습용으로 전시하여 학생들과 국민들의 꿀벌 생태교육 자료로 활용하였다. 향후 복합적인 모니터링 센서로 확장할 경우에는 실제 양봉 산업 현장에 적용하여 양봉 산업 발전에 기여하고, 축적되는 빅데이터를 통해 꿀벌의 방화행동에 대한 환경과 행동 간 상호작용에 관한 폭넓은 연구가 가능할 것으로 생각된다.
적 요
다양한 농업 생산 분야에서 정보통신기술 (ICT, Information and Communications Technologies)이 융합하여 많은 발전을 이루어내고 있다. 꿀벌의 활동과 관련한 온·습도, 음파, 이산화탄소, 암모니아, 황화수소 등 다양한 봉군내·외의 요인들과 꿀벌의 활동 추적에 대한 ICT 융복합 시스템 개발연구가 최근 이슈화되고 있다. 본 연구에서는 이중 적외선 센서 (QRE1113)를 이용하여 꿀벌 출입 자동 모니터링 시스템을 구현하여 실측 자료를 비교·분석하였다. 꿀벌의 방화행동을 연구하는 기존의 밀원식물 방화 개체 수 측정, 영상촬영을 통한 출입 활동 수 수동 분석, 해외 다양한 자동 모니터링 시스템들과 비교하여 본 시스템은 모니터링 시간과 노력의 단축 및 외부 방화 활동과의 일치성, 수동 분석과 상대 오차 5% 미만으로 높은 실효성을 보였다. 또한, 저전력블루투스 (BLE)모듈을 활용한 내·외부 온도 센서와 병행을 통해 시스템의 확장성을 확보하였으며, 이 시스템으로부터 확보한 한달간의 데이터 분석을 통해 온도와 방화행동 간 상관관계 분석 및 하루 평균 손실되는 꿀벌의 개체수 (출역봉의 1.88%)를 측정할 수 있었다. 향후 복합적인 모니터링 시스템 확장과 빅데이터 축적을 통해 더욱 강력한 실시간 모니터링 도구 및 꿀벌 생태 교육자료로 양봉 산업 발전에 크게 기여할 수 있고, 과학적 분석 도구로 활용될 것이다.
Acknowledgments
Jae Deok Son and Sooho Lim are co-first authors and contributed equally.
본 논문은 농촌진흥청 공동연구사업 (PJ0125262019와 PJ0122852019)의 지원에 의해 이루어진 것입니다. 또한, 인천대학교 외국인박사후연구원 지원프로그램으로 일부 지원되었습니다.
References
- 김문섭, 김세현, 한진규, 강문수, 박영기, (2011), 중국 산사나무의 꿀벌 방화와 화밀 분비 특성, 한국양봉학회지, 26(2), p163-167.
- 김병순, 정성민, 김고은, 정철의, (2017), 장수말벌 공격 조기 경보 시스템 프로토타입 설계 및 실내 시연, 한국양봉학회지, 32(3), p191-198.
- 김병순, 정철의, (2015), 클라우드 기반의 실시간 봉군 온·습도 모니터링 시스템의 설계 및 구현, 한국양봉학회지, 30(4), p263-267.
- 산림청, (2017), 아까시나무 개화기간 10년전에 비해 50% 급감, 보도자료.
- 이병철, 김상용, (2016), 광센서 기술 및 응용, 전자공학회지, 43, p27-40.
- 임윤규, 손원근, 곽호영, 윤병수, 송정훈, (2015), Remote monitoring system of the honeybee-controlled microenvironment in the hive for the presice apiculture, 한국양봉학회 학술대회 자료집, p42.
- 장웅익, 이흥재, (1998), PTC 세라믹 히터를 이용한 꿀벌 산란 촉진방법에 관한 연구, 제44회 전국과학전람회 농수산부문.
- 정경성, 최승윤, (1988), 사과나무에서의 꿀벌방화의 일주활동(日週活動)에 관한 연구, 한국양봉학회지, 3(2), p16-21.
- 한진규, 강문수, 김세현, 이갑연, 백을선, (2009), 경기도 수원지역 아까시나무의 개화, 꿀벌방화 및 화밀분비 특성, 한국양봉학회지, 24(3), p147-152.
-
Abou-Shaara, H. F., (2014), The foraging behaviour of honey bees, Apis mellifera: a review, Vet. Med., 59(1).
[https://doi.org/10.17221/7240-vetmed]

- Abrol, D. P., (2007), Foraging behaviour of Apis mellifera L. and Apis cerana F. as determined by the energetics of nectar production in different cultivars of Brassica campestris var. toria, J. Apic. Sci., 51, p19-24.
-
Basnet, B., and J. Bang, (2018), The state-of-the-art of knowledge-intensive agriculture: a review on applied sensing systems and data analytics, J. Sens., 2018.
[https://doi.org/10.1155/2018/3528296]

-
Boualouache, A. E., O. Nouali, S. Moussaoui, and A. Derder, (2015), A BLE-based data collection system for IoT, p1-5, in 2015 First International Conference on New Technologies of Information and Communication (NTIC).
[https://doi.org/10.1109/ntic.2015.7368748]

-
Chen, C., E.-C. Yang, J.-A. Jiang, and T.-T. Lin, (2012), An imaging system for monitoring the in-and-out activity of honey bees, Comput. Electron. Agric., 89, p100-109.
[https://doi.org/10.1016/j.compag.2012.08.006]

- Chiron, G., P. Gomez-Krämer, and M. Ménard, (2013), Detecting and tracking honeybees in 3D at the beehive entrance using stereo vision, EURASIP Journal on Image and Video Processing 2013, p59.
- Chiron, G., P. Gomez-Krämer, and M. Ménard, (2014), 3D tracking based on possibilities rather than probabilities, p9, in VAIB-Workshop on Visual Observation and Analysis of Vertebrate And Insect Behavior, in Conjunction of ICPR.
-
Debauche, O., M. El Moulat, S. Mahmoudi, S. Boukraa, P. Manneback, and F. Lebeau, (2018), Web monitoring of bee health for researchers and beekeepers based on the internet of things, Procedia Comput. Sci., 130, p991-998.
[https://doi.org/10.1016/j.procs.2018.04.103]

-
Decourtye, A., J. Devillers, P. Aupinel, F. Brun, C. Bagnis, J. Fourrier, and M. Gauthier, (2011), Honeybee tracking with microchips: a new methodology to measure the effects of pesticides, Ecotoxicology, 20, p429-437.
[https://doi.org/10.1007/s10646-011-0594-4]

- Dineva, K., and T. Atanasova, (2018), OSEMN Process for Working over Data Acquired by IOT Devices Mounted in Beehives..
- Dukku, U., Z. Russom, and A. G Domo, (2013), Diurnal and seasonal flight activity of the honey bee, Apis mellifera L, and its relationship with temperature, light intensity and relative humidity in the savanna of Northern Nigeria, Global Journal of Science Frontier Research, 13, p1-7.
-
Ellis, J. D., J. D. Evans, and J. Pettis, (2010), Colony losses, managed colony population decline, and Colony Collapse Disorder in the United States, J. Apic. Res., 49, p134-136.
[https://doi.org/10.3896/ibra.1.49.1.30]

-
Geier, M., M. Weber, A. Rose, U. Obermayr, C. Pruszynski, and M. Dole, (2016), A smart Internet of Things (loT) device for monitoring mosquito trap counts in the field while drinking coffee at your desk.
[https://doi.org/10.13140/RG.2.1.5156.5843]

-
Gil-Lebrero, S., F. J. Quiles-Latorre, M. Ortiz-López, V. Sánchez-Ruiz, V. Gámiz-López, and J. J. Luna-Rodríguez, (2016), Honey Bee Colonies Remote Monitoring System, Sensors (Basel), 17.
[https://doi.org/10.3390/s17010055]

-
Gill, R. J., and N. E. Raine, (2014), Chronic impairment of bumblebee natural foraging behaviour induced by sublethal pesticide exposure, Funct. Ecol., 28, p1459-1471.
[https://doi.org/10.1111/1365-2435.12292]

-
He, X.-J., L.-Q. Tian, X.-B. Wu, and Z.-J. Zeng, (2016), RFID monitoring indicates honeybees work harder before a rainy day, Insect Science.
[https://doi.org/10.1111/1744-7917.12298]

-
Jiang, J.-A., C.-H. Wang, C.-H. Chen, M.-S. Liao, Y.-L. Su, W.-S. Chen, C.-P. Huang, E.-C. Yang, and C.-L. Chuang, (2016), A WSN-based automatic monitoring system for the foraging behavior of honey bees and environmental factors of beehives, Comput. Electron. Agric., 123, p304-318.
[https://doi.org/10.1016/j.compag.2016.03.003]

-
Kevan, P. G., E. Cooper, A. Morse, J. P. Kapongo, L. Shipp, and S. Khosla, (2009), Measuring foraging activity in bumblebee nests: a simple nest-entrance trip recorder, J. Appl. Entomol., 133, p222-228.
[https://doi.org/10.1111/j.1439-0418.2008.01338.x]

- Magnier, B., G. Ekszterowicz, J. Laurent, M. Rival, and F. Pfister, (2018), Bee hive traffic monitoring by tracking bee flight paths, p563-571, in Proceedings of the 13th International Joint Conference on Computer Vision, Imaging and Computer Graphics Theory and Applications - Volume 5: VISAPP, INSTICC.
- Nunes-Silva, P., M. Hrncir, J. T. F. Guimarães, H. Arruda, L. Costa, G. Pessin, J. O. Siqueira, P. de Souza, and V. L. Imperatriz-Fonseca, (2019), Applications of RFID technology on the study of bees, Insectes Soc., 66, p15-24.
-
Núñez, J., (1977), Nectar flow by melliferous flora and gathering flow by Apis mellifera ligustica, J. Insect Physiol., 23, p265-275.
[https://doi.org/10.1016/0022-1910(77)90041-5]

- Pešović, U., S. RanĎić, and Z. Stamenković, (2017), Design and Implementation of Hardware Platform for Monitoring Honeybee Activity, in Proceedings of 4th International Conference on Electrical, Electronics and Computing Engineering-Serbia.
-
Robinson, E. J. H., T. O. Richardson, A. B. Sendova-Franks, O. Feinerman, and N. R. Franks, (2009), Radio tagging reveals the roles of corpulence, experience and social information in ant decision making, Behav. Ecol. Sociobiol., 63, p627-636.
[https://doi.org/10.1007/s00265-009-0715-8]

-
Sampangi, R. V., and S. Sampalli, (2017), HiveSec: security in resource-constrained wireless networks inspired by beehives and bee swarms, Int. J. Inf. Secur., 16, p417-433.
[https://doi.org/10.1007/s10207-016-0341-1]

-
Scaven, V. L., and N. E. Rafferty, (2013), Physiological effects of climate warming on flowering plants and insect pollinators and potential consequences for their interactions, Curr. Zool., 59, p418-426.
[https://doi.org/10.1093/czoolo/59.3.418]

-
Schneider, C. W., J. Tautz, B. Grünewald, and S. Fuchs, (2012), RFID tracking of sublethal effects of two neonicotinoid insecticides on the foraging behavior of Apis mellifera, PLoS One, 7, e30023.
[https://doi.org/10.1371/journal.pone.0030023]

-
De Souza, P., P. Marendy, K. Barbosa, S. Budi, P. Hirsch, N. Nikolic, T. Gunthorpe, G. Pessin, and A. Davie, (2018), Low-cost electronic tagging system for bee monitoring, Sensors (Basel), 18.
[https://doi.org/10.3390/s18072124]

-
Stelzer, R. J., and L. Chittka, (2010), Bumblebee foraging rhythms under the midnight sun measured with radiofrequency identification, BMC Biol., 8, p93.
[https://doi.org/10.1186/1741-7007-8-93]

-
Streit, S., F. Bock, C. W. W. Pirk, and J. Tautz, (2003), Automatic life-long monitoring of individual insect behaviour now possible, Zoology (Jena), 106, p169-171.
[https://doi.org/10.1078/0944-2006-00113]

- Tashakkori, R., and A. Ghadiri, (2015), Image processing for honey bee hive health monitoring, p1-7, in SoutheastCon 2015.
-
Tu, G. J., M. K. Hansen, P. Kryger, and P. Ahrendt, (2016), Automatic behaviour analysis system for honeybees using computer vision, Comput. Electron. Agric., 122, p10-18.
[https://doi.org/10.1016/j.compag.2016.01.011]

- Verma, L. R., and P. C. Dulta, (1986), Foraging behaviour of Apis cerana indica and Apis mellifera in pollinating apple flowers, J. Apic. Res., 25, p197-201.


