Development of Imaging-Based Honeybee Traffic Measurement System and Its Application to Crop Pollination
Abstract
Bee traffic can be used as an indicator of the health of bee colonies, age, production of honeybee products, and crop pollination. To study bee pollination processes, we developed an algorithm that can automatically measure bee traffic through an image processing system. The match rate between the bee traffic observed through the system and the traffic that was visually observed was 93.6%. However, the higher the bee traffic, the lower the match rate. We applied the system in a strawberry cultivation greenhouse containing two colonies (one with 12500 bees and one with 10000 bees), and there was a significant difference in bee traffic between the two colonies. In addition, bee traffic depends on the climatic conditions inside the greenhouse (air temperature, relative humidity, illumination, and UV radiation), and there was a significant correlation between these indicators and the level of bee traffic observed. There was also a strong correlation (R>0.8) between bee traffic and foraging activity (which is correlated with pollination), and the foraging activity could be estimated with a high probability (R2=0.74). Therefore, the bee traffic measurement system developed in this study can be used to study the effect of pollination on crops, and is expected to be applied as a major model for producing high-quality agricultural products in smart beekeeping and crop smart farms.
Keywords:
Bee traffic, Foraging activity, Honeybee, Image processing, Smart beehiveINTRODUCTION
Honeybees (Apis mellifera L.) play a very important role in commercial crop pollination. This is demonstrated by the fact that the area of crops pollinated by honeybees accounts for most of the area of crops pollinated by all insects (Allsopp et al., 2008). The foraging behavior of honeybees, which collect nectar and pollen to maintain their colonies, provides multiple benefits to commercial pollination services: they increase crop yields of plants cultivated in greenhouses, such as strawberries and watermelons, and they pollinate economical fruit crops such as almonds, apples, and blueberries (Free, 1968; Kevan and Baker, 1983; Young et al., 2007; Pott et al., 2010). The foraging activity of honeybees is an important indicator of the effect of pollination on crops (Gary, 1992). However, because the mean range of the activity of honeybees is 2~3 km, it is virtually impossible to investigate the behavior of hundreds of worker bees visiting flowers (Gould and Gould, 1988). Because bee traffic, which is defined as the number of bees leaving and entering an area, can directly identify bee activity, it can be used as an important indicator of colony health, colony age, climate change, honey flow, and foraging activity (Gary, 1992; Meikle and Holst, 2015). However, the study of bee traffic is also limited because each investigator visually inspects the state of tens to hundreds of different bees coming and going from the hives, and it is difficult to collect a large amount of data in a limited time (Faberge, 1943). In order to solve this problem, various techniques for automatically measuring bee traffic have been attempted since 1940. Until the 1980s, a technique to generate and record an electrical signal by causing the bees to touch a specific device when they enter or exit the hive was used (Erickson et al., 1975; Danka et al., 1987). In the 1990s, a bidirectional bee counter that records the number of bees passing through a portal equipped with an infrared sensor (Struye et al., 1994) was developed. Currently, there are three methods for mechanically measuring bee traffic, which can be divided into three categories: using infrared or laser sensors, analyzing images or videos through cameras, and analyzing RFID (radio-frequency identification) tags. In the methods using infrared or laser sensors, the sensor can be easily installed in the hive, but a portal with a separate sensor installed at the entrance of the hive is required. In addition, all bees entering and exiting the hive can be detected, and therefore it is not suitable for counting only foraging bees (Erickson et al., 1975; Liu et al., 1990). Video image analysis through smart cameras using deep learning technology is the most recent development, and it facilitates the detection of bees through images of bee traffic (Magnier et al., 2018; Kulyukin and Mukherjee, 2019). However, while bee traffic measurement at the entrance of the hive may be straightforward, there are limitations in analyzing specific flight behavior or foraging behavior near flowers. Because the RFID technique can analyze bee behavior through a micro tag attached to the bee, it is able to track not only bee traffic but also the flight behavior characteristics of bees (Schneider et al., 2012; Minahan and Brunet, 2018; Klein et al., 2019). However, this method is difficult to employ in the field other than for research purposes because the RFID tag must be attached to individual bees and a bulky device must be used to analyze the RFID data.
In this study, we made a bee traffic measurement machine that can be attached to existing standard beehives so that beekeepers or farmers who use bees as pollinators can evaluate the activity of their bees. We also developed an algorithm that measures the bee traffic by tracking a specific bee in real time from an image taken by a smart camera based deep learning. The combination of the machine and the algorithm formed an embedded system that can be used in the field. The availability was evaluated by comparing the bee traffic measured by the system to the bee traffic measured visually in a field where bee pollination is required. The system was verified by its ability to reproduce the changes in bee traffic according to the colony size and weather conditions. In addition, the relationship between the bee traffic measured by the system and bee foraging activity was investigated, and it was evaluated for its effectiveness as an indicator of pollination effects.
MATERIALS AND METHODS
1. Algorithm
In order to measure the level and type of bee activities, different types of bee behavior were classified and labeled; “flying out of the hive”, “arriving at the hive and then entering the hive from the outside”, and “the sum of the number of outgoing bees and the number of incoming bees” were defined as the “outgoing bee”, “incoming bee”, and “bee traffic”, respectively. Bee traffic was measured by recognizing bees in images. First, an area suitable for recognizing an individual bee was chosen using a smart camera that can recognize a specific object in a restricted area. Then the camera captured an image. Through the object recognition program, the image was converted into a two-dimensional plane, and a honeybee was recognized by a bee-sized yellow pixel from multiple images (Fig. 1). Image capture was performed every 10 milliseconds (ms). The 10 images captured a total of 100 ms, and the image with the highest number of bee detections was selected first. Subsequently, 10 more images capturing an additional 100 ms were taken, and the image in this sequence with the highest number of bee detections was also selected. The two selected images were defined as “bef” and “aft.” After that, the following areas were defined, as shown in Fig. 2. Area A was the area of the camera’s field of view (Abef and Aaft), Area B was the entire area around the entrance (Bbef and Baft), and Area C was defined as Area B minus Area A (Cbef and Caft). Whether a given bee is an incoming bee or an outgoing bee was determined as follows. In the second selected image, if a bee disappeared at the entrance of the hive, it was an incoming bee, and the number of disappeared honeybees was counted (Abef>Aaft & Bbef>Baft). In the second selected image, if a bee disappeared outside the camera’s field of view, it was an outgoing bee, and this number of disappeared honeybees was also counted (Abef>Aaft & ΔB=0 & ΔC≤ΔA). If one of the above conditions was not satisfied, the number of honeybees was counted as zero. In summary, the number of worker bees entering and exiting the hive per 200 ms was recorded.
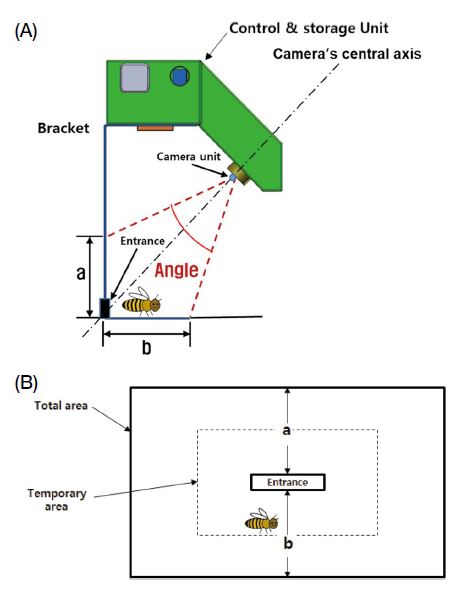
Image capture and transformation for honeybee recognition: (A) camera’s field of view for taking images; (B) two-dimensional transformation of image.
2. Construction of bee traffic measurement system
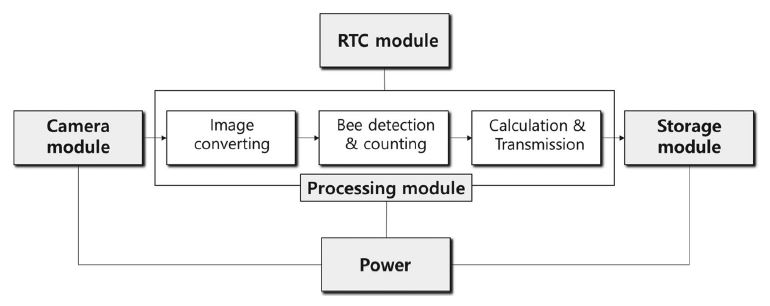
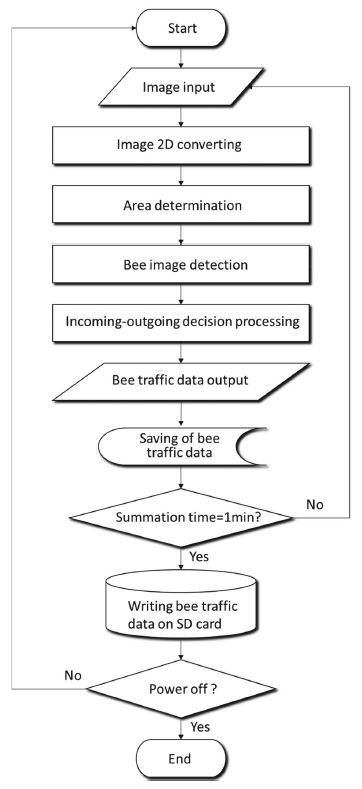
The honeybee traffic measurement system consisted of an image module that captures and recognizes images through a camera, an operation-control module that calculates the image-processed value, and a storage module that records the amount of entries in the SD card (Fig. 3). A smart cam system (Pixy2-CMUcam5, Charmed lab and Carnegie Mellon Univ., Austin, TX, USA) was selected as the image module, and PixyMon v2 (Charmed lab and Carnegie Mellon Univ., Austin, TX, USA) was used as the image recognition software. The operation and control module consisted of an Arduino 9 Mega 2560 REV3 (Arduino, Turin, Italy) and an RTC (real time clock) module (DS1307, Maxim Integrated, San Jose, CA, USA) for system operation at a specific time. The storage module used a micro SD (TF) storage board (3947, Waveshare, Shenzhen, China). Programming was performed in the Arduino IDE (Arduino Inc., Turin, Italy) for Windows environment. The system processing sequence was as follows: 1) from the time specified by the RTC module, the image module took one image per 10 ms; 2) after performing 2D image conversion on the captured image, a bee was recognized in the converted image, and bee traffic data per 200 ms was recorded according to the bee traffic determination algorithm; 3) the total bee traffic was the sum of the recorded bee traffic data for 1 min (60000 ms=200 ms×300) and was calculated as follows:
4) The summed data for each minute was saved in real time as a CSV file on the micro SD card. Fig. 4 shows the overall processing flow chart of the bee traffic measurement system.
3. Validation of the availability of bee transportation systems
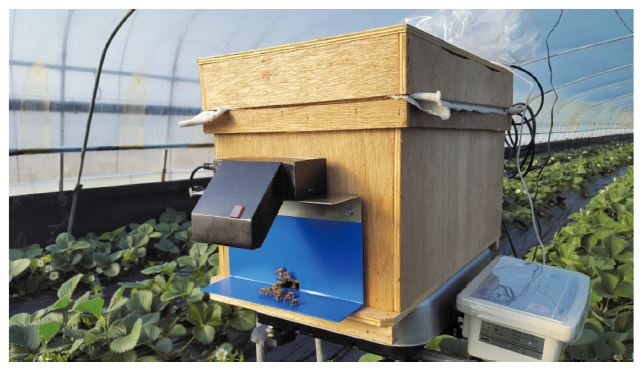
Experiments to verify the availability of the bee traffic measurement system were carried out from January 3 to March 5, 2018 in a 660 m2 strawberry (Fragaria×ananassa D. cv. Seolhyang) greenhouse in Susan-ri, Hanam-eup, Miryang-si, Gyeongsangnamdo, Korea (35° 27ʹ 03ʺN, 128° 46ʹ 13ʺE). Two honeybee (Apis mellifera L., Italyan) traffic measurement systems were installed (see Fig. 5 for an example): one for a colony of 10000 worker bees (five frames, styrofoam beehives) and one for a colony of 12500 worker bees (six frames, wooden beehives). In order to examine the difference between the bee traffic data measured by the system and the data measured visually, the match rate between the bee traffic observed visually for 1 min at a specific time and the bee traffic recorded by the system for 1 min at the same time was calculated as follows.
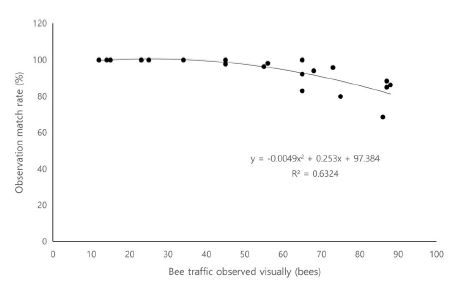
Through regression analysis between the match rate data and the bee traffic observed visually at the time at which each data point was observed, a regression equation was derived, and the change in the match rate according to the bee traffic was predicted.
4. Bee traffic variation with colony size
To verify whether the bee traffic measured by the system changes according to the colony size, the bee traffic of the two colonies with 12500 and 10000 bees was summed and compared monthly, daily, and hourly. Because the bee traffic may vary with time, the time with the most activity was selected for measurement.
5. Verification of bee traffic changes by weather conditions inside the greenhouse
To verify the correlation between weather conditions inside the greenhouse and the bee traffic, a data logger (Illuminance UV recorder TR-74Ui; T&D Co.; Matsumoto, Nagano, Japan) was installed 50 m from the entrance of the house at a height of 1.3 m. The temperature, illumination, humidity, and ultraviolet radiation inside the greenhouse during the irradiation period were recorded every 10 min. The data were compared to the average temperature, illuminance, humidity, and ultraviolet radiation at the same time that the bee traffic was recorded, and the correlation was confirmed.
6. Correlation verification between bee traffic and foraging activity
The bees on the flowers inside the greenhouse were defined as “foraging bees”. The number of foraging bees were counted every hour from 10 am to 4 pm from January 17~20, 2018. A correlation analysis between the number of foraging bees and the bee traffic measured over 30 min was performed and the bee traffic was measured simultaneously.
7. Statistical analysis
For both bee colonies, the significance was verified by a t-test between the bee traffic data measured through the device and that measured visually, and between the bee traffic and the number of foraging bees. A one-way ANOVA test was carried out to verify the differences between bee traffic in diurnal time. The relationship between bee traffic and the number of foraging bees was confirmed through a Pearson correlation analysis, and a regression analysis verified that foraging activity is related to bee traffic. In addition, the correlation between the bee traffic measured by the system and the match rate was confirmed through regression analysis. In addition, Pearson’s partial correlation analysis was carried out to verify the relationship between the weather conditions (air temperature, relative humidity, illuminance, and UV radiation) inside the greenhouse and the bee traffic. The weather factors with the highest correlation were selected. All data were statistically processed after normality was tested using the Kolmogorov-Smirnov test. All statistical analyses were performed using the SPSS PASW 22.0 package for Windows (IBM, Chicago, IL, USA).
RESULTS
1. Availability of bee transportation systems
The difference between the performance of the two methods was compared to confirm that the bee traffic measurement system was as accurate as visual observation. At low bee traffic levels, there was no significant difference between the visual observation data and the system over the course of 1 min (t-test: t40= -0.488, p=0.628), and the match rate between the two methods was 93.6±8.6%. However, as the level of bee activity increased, the difference between the system and the visual observation data tended to increase (Pearson correlation: R= -0.729, p<0.0001). Accordingly, the bee traffic data measured by visual observation for 1 min to obtain highly reliable bee traffic data through the system was confirmed through regression analysis (Fig. 6). As a result, the second order regression equation
where xbee traffic is visual observation of traffic and ymatch rate is the match rate between the bee traffic observed visually for 1 min at a specific time and the bee traffic recorded by the system for 1 min at the same time was derived (ANOVA test: F2,18=15.486, p=0.0001. R2=0.632, DW=1.800). When the bee traffic per minute was 40, the concordance rate was the highest at 99%, and when the bee traffic per minute was more than 80, the match rate decreased to less than 80%.
2. Bee traffic variation with colony size
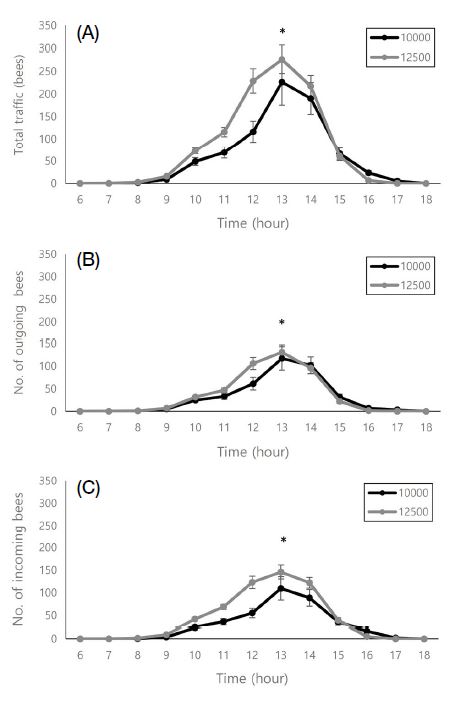
Table 1 shows the number of incoming bees, outgoing bees, and total traffic per month, day, and hour through the bee traffic measurement system. The daily bee traffic exhibited significant differences between the two colony sizes. The incoming, outgoing, and total bee traffic in the colony with 12500 bees were 1.6-fold (monthly: t-test: t4= -3.372, p=0.028, daily: t178= -5.030, p=0.0001), 1.2-fold, and 1.4-fold (daily: t178= -3.506, p=0.001) greater than that of the colony with 10000 bees, respectively, in the monthly and daily bee traffic observations. For the amount of activity per hour, a one-way ANOVA test revealed a large difference in the diurnal activity of the bees (10000 bees: F2,12=15.347, p=0.0001; 12500 bees: F2,12=53.414, p=0.0001; see Fig. 9). The activity was compared based on the data collected at 1 p.m., when the highest activity level occurred. The incoming, outgoing, and total bee traffic for the colony with 12500 bees was 1.6-fold (t178= -3.779, p=0.0001), 1.2-fold, and 1.4-fold (daily: t178= -3.506, p=0.001) greater than that of the colony with 10000 bees (t178= -2.783, p=0.006), respectively.
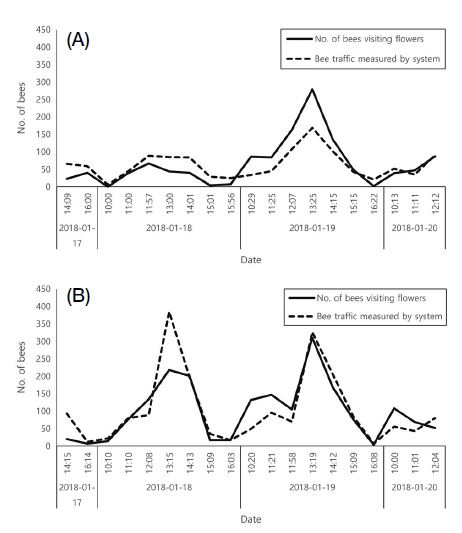
Bee traffic and foraging behavior of A. mellifera in the strawberry greenhouse: (A) colony of 10000 bees; (B) colony of 12500 bees.
3. Bee traffic by climatic conditions
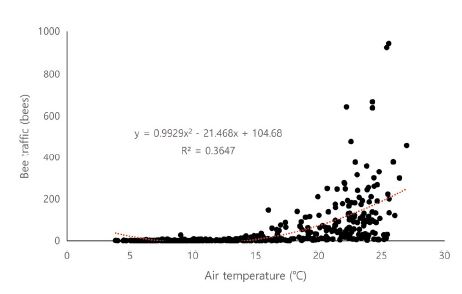
Table 2 shows the correlation between the weather conditions in the greenhouse and the bee traffic. The air temperature, illuminance, and UV radiation were all positively correlated (R=0.353-0.530, p<0.001), and the relative humidity was negatively correlated (R=-0.481 to -0.498, p<0.001). However, because the air temperature and the relative humidity, illuminance, and UV radiation are highly correlated with each other, a partial correlation analysis between the bee traffic and the climatic conditions was performed. As a result, only air temperature was found to have a significant correlation with incoming, outgoing, and total bee traffic (Pearson partial correlation: R=0.160~0.177, p<0.001). Based on this result, a regression analysis was performed to predict the change in bee traffic due to the change in air temperature (Fig. 10). As a result, a significant quadratic regression equation,
was derived (ANOVA test: F2,433=124.286, p= 0.0001, R2=0.365, DW=1.026).
4. Correlation between bee traffic and foraging activity
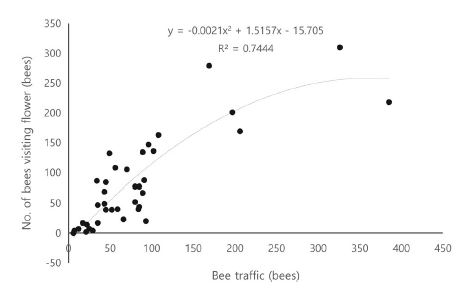
In order to confirm whether bee traffic can be used as an important factor in the effect of pollination on crops by insect pollinators, the correlation between the bee traffic and the foraging activity of the bees was investigated. The bee traffic in both colonies showed patterns similar to the foraging activity (Fig. 7). In addition, a strong correlation between the bee traffic and the foraging activity was confirmed, and a quadratic regression equation with a high coefficient of determination,
was derived through regression analysis (ANOVA test: F2,35=50.973, p=0.0001; R2=0.744, DW=1.285; see Fig. 8).
DISCUSSION
The foraging behavior of bees is closely related to crop pollination (Klein et al., 2019). Foraging occurs when a bee leaves the hive, visits a flower, collects pollen or nectar, and returns to the hive. Because foraging behavior always accompanies flight behavior at the entrance to the beehive, an algorithm was used to recognize bees by photographing an image of the hive entrance. The results of the bee traffic measured through the system we developed and the bee traffic measured visually showed more than 90% agreement. However, the higher the bee activity that occurred in one minute, the lower the match rate. This is presumed to be because, when there are many bees within a limited field of view, an image of overlapping bees appears, which is difficult for the image processor to recognize. In addition, because the image processing algorithm recognizes a bee by its RGB color range and pixel size, the result can be greatly affected by sunlight. This is because the colors of the bees and the sizes of their shadows change according to the elevation of the sun, which depends on the diurnal time (Magnier et al., 2018; Kulyukin and Mukherjee, 2019). This problem can be overcome by taking as many types of images as possible. In addition, when the worker bee traffic was less than 40 bees per minute, the match rate was 99%, but when there were more bees per minute, the match rate decreased to as low as 80%. We expect that the bee traffic data necessary for studying other bee colonies will be sufficiently collected through our system because, in previous pollination studies of crops such as watermelon (Lee et al., 2018), strawberry (Lee et al., 2008), and mango (Park et al., 2014), the bee traffic over 5 min is less than 120 bees.
We measured the bee traffic through our bee measurement system for three months at the strawberry greenhouse. In the winter, the bee traffic was 170 bees per hour, 767 bees per day, and 23000 bees per month. Kim et al. (2019) measured bee traffic based on laser counters and reported that 10000 bees entered and exited per day. This result was more than ten times larger than our result. This is thought to be due to the differences between the composition of the beehive, the environment, and the characteristics of the sensor. The number of foraging bees in the colony may vary depending on the oviposition period of the queen, the amount of oviposition, and the number of nurse bees at the time of oviposition (Abou-Shaara, 2014). In addition, oviposition by queen bees is greatly affected by weather conditions inside and outside the colony (Tarpy et al., 2000; De Souza et al., 2013). In the recognition algorithm, the infrared counter method counts all the bees passing through the entrance without tracking those that fly, whereas our method recognizes and counts the bees in pixels, and the number of bees flying away and entering in is mainly measured. The infrared or laser counter method is effective when determining the colony activity simply by the number of bees entering and exiting the hive, but the image analysis method is considered to be more effective for studying pollination activity, for which foraging activity must be determined.
In bee pollination studies of several crops, it was reported that the bee traffic depends on the colony size and weather conditions around the hive (Lee et al., 2016; Lee et al., 2018). The bee traffic data measured through our bee traffic measurement system also showed the same pattern. Lee et al. (2018) reported that larger colonies showed more bee traffic. In our results, as the number of worker bees in the hive increased, the system accurately measured the increased bee traffic. Weather conditions also have a great influence on the foraging behavior of bees (Klein et al., 2019). Lee et al. (2016) reported that air temperature, illuminance, and UV radiation have a significant influence on the foraging activity of honeybees, and temperature is the one variable that has the strongest influence on honeybees in various weather conditions. Our results also showed a clear correlation between air temperature and bee traffic for different weather conditions. Synthesizing the results thus far, the bee traffic measurement system can obtain the same quality of data as the conventional visual observation method, and therefore it can replace visual observation of bee traffic. We chose the method of image processing to measure bee traffic data because it is effective for measuring the number of bees entering and exiting the hive, which is relevant for measuring foraging activity. However, bees flying out of the hive do not only perform foraging, but can also engage in orientation flights, robbing flights, and defecation (Degen et al., 2015). Therefore, we confirmed that foraging activity can be predicted through the bee traffic measured by the system. As a result, the number of bees visiting a flower during the day and the bee traffic showed a similar pattern, with a correlation of 0.8 or more. Because the regression equation also has a coefficient of determination of 0.74, the method of using bee traffic as a proxy for foraging activity is effective. Therefore, as the foraging behavior of bees is directly related to the pollination of crops (Klein et al., 2019), we predict that the effect of pollination (fruit set rate or fruit quality) can be sufficiently explained through bee traffic data.
CONCLUSION
We developed an imaging-based bee traffic measurement system to more accurately measure bee traffic, which can be accurately measured through the image processing algorithm presented in this paper. Our technology can not only be used for pollination studies of crops, but it can easily determine the condition of bees simply by attaching the system to standard beehives. In particularly, it is possible to estimate the foraging activity of bees, which is highly correlated with pollination. However, there is a limit to the full application of our system to the study of pollination. We have not been able to fully clarify the correlation between bee traffic as measured by our system and the effect of pollination. Therefore, in order to use the system for the pollination of crops, a study that will reveal the causal relationship between bee traffic and crop yield and quality is needed. In addition, in order to use bees as pollinators more effectively, the behavioral changes in bees according to the conditions inside the hive, such as the oviposition of the queen and changes in the amount of food (such as pollen substitute and sugar syrup), should be studied. Furthermore, if the data on bee traffic is applied to the standard crop smart farm, it can be extended to a study on the modeling of pollinating bees and crop production. Such a study could reveal important indicators necessary to produce high-yield and high-quality crops.
Bee traffic can inform all areas of beekeeping, especially the effect of bee foraging activity on pollination, but also the production of beekeeping products (e.g., honey and propolis) and generation of bee diseases. In addition, in the future it will be possible to use wireless communication technology to enhance bee activity measurements by adding a sensor that can measure the environment inside the hive (i.e., a “smart beehive”). Our study can help crop growers and pollination service providers in pollination by honeybees. Crop growers help determine the condition of a bee even without knowledge of the bee. If bee activity is low, various measures can be adopted to increase the activity or to replace the hive to enable the production of stable crops. Furthermore, pollination service providers will be able to increase pollination efficiency through increasing the bee traffic by controlling the internal and external environments of the beehive. In addition, if big data correlated to bee traffic data and crop production are secured, crop production can be predicted by controlling bee traffic. This is expected to contribute to the development of the smart pollination industry.
Acknowledgments
This work was supported by a grant from the National Institute of Agricultural Sciences, Rural Development Administration, Republic of Korea (Project No.: PJ01331102).
References
-
Abou-Shaara, H. F. 2014. The foraging behaviour of honey bees, Apis mellifera: a review. Vet. Med. (Praha). 59: 1-10.
[https://doi.org/10.17221/7240-VETMED]

-
Allsopp, M. H., W. J. De Lange and R. Veldtman. 2008. Valuing insect pollination services with cost of replacement. PLos ONE 3: e3128.
[https://doi.org/10.1371/journal.pone.0003128]

-
Danka, R. G. and N. E. Gary. 1987. Estimating foraging populations of honey bees (Hymenoptera: Apidae) from individual colonies. J. Econ. Entomol. 80: 544-547.
[https://doi.org/10.1093/jee/80.2.544]

-
De Souza, D. A., M. A. F. Bezzera-Laure, T. M. Francoy and L. S. Gonçalves. 2013. Experimental evaluation of the reproductive quality of Africanized queen bees (Apis mellifera) on the basis of body weight at emergence. Genet. Mol. Res. 12: 5382-5391.
[https://doi.org/10.4238/2013.November.7.13]

-
Degen, J., A. Kirbach, L. Reiter, K. Lehmann, P. Norton, M. Storms, M. Koblofsky, S. Winter, P. B. Georgieva, H. Nguyen, H. Chamkhia, U. Greggers and R. Menzel. 2015. Exploratory behaviour of honeybees during orientation flights. Anim. Behav. 102: 45-57.
[https://doi.org/10.1016/j.anbehav.2014.12.030]

-
Erickson, E. H., H. H. Miller and D. J. Sikkema. 1975. A method of separating and monitoring honey-bee flight activity at the hive entrance. J. Apic. Res. 1: 119-125.
[https://doi.org/10.1080/00218839.1975.11099814]

-
Faberge, A. C. 1943. Apparatus for recording the number of bees leaving and entering a hive. Rev. Sci. Instrum. 20: 28-311.
[https://doi.org/10.1088/0950-7671/20/2/302]

-
Free, J. B. 1968. Dandilion as a competitor to fruit trees for bee visit. J. Appl. Ecol. 5: 168-178.
[https://doi.org/10.2307/2401281]

- Gary, N. E. 1992. Activities and behavior of honey bees. In: The Hive and The Honey Bee (Ed. J.M. Graham), Dadant and Sons, Hamilton, IL, pp. 269-372.
- Gould, J. L. and C. G. Gould. 1988. The Honey Bee. New York, NY, Scientific American Library.
-
Kevan, P. G. and H. G. Baker. 1983. Insects as flower visitors and pollinators. Annu. Rev. Entomol. 28: 407-453.
[https://doi.org/10.1146/annurev.en.28.010183.002203]

-
Klein, S., C. Pasquaretta, X. J. He, C. Perry, E. Søvik, J. M. Devaud, A. B. Barron and M. Lihoreau. 2019. Honey bees increase their foraging performance and frequency of pollen trips through experience. Sci. Rep. 9: 6778.
[https://doi.org/10.1038/s41598-019-42677-x]

-
Kulyukin, V. and S. Mukherjee. 2019. On video analysis of omnidirectional bee traffic: counting bee motions with motion detection and image classification. Appl. Sci. 9: 3743.
[https://doi.org/10.3390/app9183743]

-
Lee, K. Y., J. Lim, H. J. Yoon and H. J. Ko. 2018. Effect of climatic conditions on pollination behavior of honeybees (Apis mellifera L.) in the greenhouse cultivation of watermelon (Citrullus lanatus L.). J. Apic. 33(4): 239-250.
[https://doi.org/10.17519/apiculture.2018.11.33.4.239]

-
Lee, K. Y., S. H. Yim, H. J. Seo, S. Y. Kim and H. J. Yoon. 2016. Comparison of pollination activities between honeybee (Apis mellifera L.) and bumblebee (Bombus terrestris L.) during the flowering period of asian Pear (Pyrus pyrifolia N.) under variable weather Conditions. J. Apic. 31: 247-261.
[https://doi.org/10.17519/apiculture.2016.09.31.3.247]

- Lee, S. B., N. G. Ha, K. Y. Lee, H. J. Yoon, I. G. Park, H. S. Gang, S. J. Hwang, M. Y. Lee and K. Choi. 2008. Characteristics and effects on the pollinating activities of honeybee, Apis mellierfa L. and white tailed Bumblebee, Bombus terrestris L. (Hymenoptera: Apidae) in strawberry vinyl houses. J. Apic. 23: 73-81.
-
Liu, C., J. J. Leonard and J. J. Feddes. 1990. Automated monitoring of flight activity at a beehive entrance using infrared light sensors. J. Apic. Res. 29: 20-27.
[https://doi.org/10.1080/00218839.1990.11101193]

-
Magnier, B., G. Ekszterowicz, J. Laurent, M. Rival and F. Pfister. 2018. Bee hive traffic monitoring by tracking bee flight paths. 13th International Joint Conference on Computer Vision, Imaging and Computer Graphics Theory and Applications, January 27-29, 2018, in Funchal, Madeira, Portugal, pp. 563-571.
[https://doi.org/10.5220/0006628205630571]

-
Meikle, W. G. and N. Holst. 2015. Application of continuous monitoring of honeybee colonies. Apidologie 46: 10-22.
[https://doi.org/10.1007/s13592-014-0298-x]

-
Minahan, D. F. and J. Brunet. 2018. Strong interspecific differences in foraging activity observed between honey bees and bumble bees using miniaturized radio frequency identification (RFID). Front. Ecol. Evol. 6: 156.
[https://doi.org/10.3389/fevo.2018.00156]

-
Park, I. G., H. J. Yoon, M. A. Kim, K. Y. Lee, H. C. Park and S. H. Kim. 2014. Effect on pollinating activities on mango flower by bumblebee (Bombus terrestris), honeybee (Apis mellifera) and oriental latrine fly (Chrysomyia megacephala) in green house. J. Apic. 29: 235-243.
[https://doi.org/10.17519/apiculture.2014.11.29.4.235]

-
Potts, S. G., J. C. Biesmeijer, C. Kremen, P. Neumann, O. Schweiger and W. E. Kunin. 2010. Global pollinator declines: trends, impacts and drivers. Trends Ecol. Evol. 25: 345-353.
[https://doi.org/10.1016/j.tree.2010.01.007]

-
Schneider, C. W., J. Tautz, B. Grünewald and S. Fuchs. 2012. RFID tracking of sublethal effects of two neonicotinoid insecticides on the foraging behavior of Apis mellifera. PLos ONE 7: e30023.
[https://doi.org/10.1371/journal.pone.0030023]

-
Son, J. D., S. Lim, D. I. Kim, G. Han, R. Ilyasov, U. Yunusbaev and H. W. Kwon. 2019. Automatic bee counting system with dual infrared sensor based on ICT. J. Apic. 34: 47-55.
[https://doi.org/10.17519/apiculture.2019.04.34.1.47]

-
Struye, M. H., H. J. Mortier, G. Arnold, C. Miniggio and R. Borneck. 1994. Microprocessor-controlled monitoring of honeybee flight activity at the hive entrance. Apidologie 25: 384-395.
[https://doi.org/10.1051/apido:19940405]

-
Tarpy, D. R., S. Hatch and D. J. Fletcher. 2000. The influence of queen age and quality during queen replacement in honeybee colonies. Anim. Behav. 59: 97-101.
[https://doi.org/10.1006/anbe.1999.1311]

-
Young, H. J., D. W. Dunning and K. W. Von Hasseln. 2007. Foraging behavior affects pollen removal and deposition in Impatiens capensis (Balsaminaceae). Am. J. Bot. 94: 1267-1271.
[https://doi.org/10.3732/ajb.94.7.1267]


