A Simple and Sensitive Gene-Based Diagnosis of Aspergillus flavus by Loop-Mediated Isothermal Amplification in Honeybee
Abstract
Stonebrood is a well-known fungal disease of the honeybee. This disease is caused by several species of the fungus Aspergillus. One of these species is Aspergillus flavus. In Korea 2013, Stonebrood disease showed a 13% infection rate in diseased honeybees, but current hive management lacks a rapid field detection system for this fungus. In this study, for easy detection of A. flavus, an A. flavus-specific loop-mediated isothermal amplification detection method was developed. A. flavus-LAMP employs Bst DNA polymerase and a set of four specially designed primers (A. flavus-LAMP F3, B3, FIP, and RIP) which recognize six distinct genetic sequences in A. flavus 18S rRNA gene. As a result, A. flavus was successfully amplified under isothermal conditions at about 59°C within 1 hour. The amplified A. flavus-specific LAMP products were visualized by adding fluorescent dye, SYBR Green I or GeneFinderTM enabling observation with the naked eye under daylight without electrophoresis. This method is expected to be used for field detection of A. flavus.
Keywords:
LAMP, Fungal diseases, Stonebrood, Aspergillus flavus, Honey beeINTRODUCTION
Stonebrood is caused by species of Aspergillus, with most cases coming from Aspergillus flavus. (Gilliam Vandenberg, 1990). Aspergillus flavus (A. flavus) was firstly isolated from Germany (Maassen, 1913). The infection pattern of A. flavus is to permeate the digestive organ and stiffen the body.
This symptom is very similar to that of Chalkbrood, caused by Ascosphaera apis, so we could not distinguish both by the naked eye easily. In Korea, Chalkbrood and Stonebrood made incorrect detection report by beekeepers. (Lee et al., 2004). So a rapid and specificity detection system is available for use in the field will be important in hive management.
Loop-mediated isothermal amplification (LAMP) is a novel nucleic acid amplification method characterized by high specificity, sensitivity, and rapidity under isothermal conditions, and it employs self-recurring strand displacement synthesis primed by a specially designed set of target-specific primers (Notomi et al., 2000). The LAMP method has three main features. Firstly, all reactions are carried out under isothermal conditions.
Compared to conventional PCR and real-time PCR assays, expensive equipment is not necessary to obtain a high level of precision, and there are fewer preparation steps as well (Ushikubo, 2004). Secondly, the amplification efficiency is extremely high, resulting in a tremendous amount of amplification products (Yamazaki et al., 2008). Thirdly, the reaction is high specificity (Yamazaki et al., 2009). In this study, we developed a LAMP method for detection of A. flavus, termed A. flavus-LAMP, for easy detection in the field and for the monitoring of natural infection in Apis mellifera by A. flavus.
MATERIALS AND METHODS
Honeybee sample
Honeybee samples were collected in Korea in 2013. The samples of honeybees infected with pathogens of A. flavus were selected and stored at -20°C until used.
Genomic DNA extraction
Each 50 mg honeybee sample was homogenized in 200μl lysis buffer with 20μl proteinase K using a Genomic DNA extraction kit (Bioneer, Daejeon, Korea), followed by incubation for 1 hour at 60°C. The final concentration of total DNA was determined using a spectrophotometer (Effendorf, Germany) before applying the LAMP reaction.
Template DNAs preparation
The partial gene of A. flavus was amplified by PCR using A. flavus-LAMP Outer primers. The amplified PCR product specific to A. flavus was inserted into Vector pBX TA. The recombinant pBX-A. flavus DNA clone was extracted using DNA-spinTM‚ Plasmid DNA purification kit (iNtRON, Seongnam, Korea) according to the manufacturer’s instructions.
Primer design for LAMP
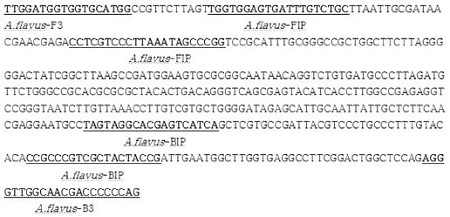
LAMP primers were designed based on the sequence of A. flavus (GenBank accession no. D63696) using the Primer Explorer version 4 soft-ware program (http://primerexplorer.jp/elamp4.0.0/index.html). Details of the final primers are shown in Table 1. The primers were synthesized by Bionics, Korea.
Optimization of LAMP reaction
The LAMP reaction was performed in a total volume of 50μl containing 10 pmole each of F3 and B3, 40 pmole each of FIP and BIP, 2.5 mM dNTPs, 8 units of Bst DNA polymerase large fragment (New England Biolabs), 1X ThermoPol Reaction Buffer (20mM Tris-HCl, 10mM KCl, 10mM (NH4)2SO4, 2mM MgSO4, 0.1% Triton X-100, and 1.0μl of template DNA). The mixture was incubated at 59°C for 60 min and the reaction was terminated by heating to 80°C for 10 min. To optimize the LAMP reaction, different reaction temperatures, dNTP concentrations, and reaction times were examined. After LAMP reaction, the amplicons were confirmed by agarose-gel electrophoresis.
Detection of LAMP products by fluorescent dyes
LAMP amplicons in the reaction tube were directly visualized through the addition of 1X SYBR Green I or Gene FinderTM‚ to the tube and observation of solution color under UV light or visible light as detected by the naked eye. The solution fluoresces in the presence of LAMP amplicons.
RESULTS
Primer design
The specific primers for A. flavus were designed based on the genomic DNA sequence of A. flavus 18S (GenBank accession no. D63696). The sequences of A. flavus primers are underlined in Fig. 1.
Optimal temperature for LAMP reaction
To determine the optimal temperature for the A. flavus-LAMP amplification reaction, the LAMP reaction was performed using pBX-A. flavus clone (107 copy) as a template and carried out from 45°C to 65°C for 60 min in a thermocycler. The amplicons of the LAMP reaction with pBX-A. flavus were formed at all temperatures, with the clearest product appearing at 59°C (Fig. 2).
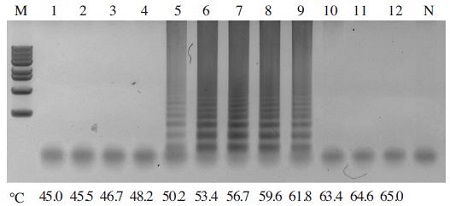
Gradient-Temperature for A. flavus-LAMP reaction. The A. flavus-LAMP reaction was carried out from 45°C to 65°C for 60min with pBX-A. flavus clone used as a template. LAMP reaction was performed in a total 50μl volume containing 10 pmole each of F3 and B3, 40 pmole each of FIP and BIP, 2.5mM dNTPs, 8 units of Bst DNA polymerase large fragment (New England Biolabs), 1X ThermoPol Reaction Buffer (20mM Tris-HCl, 10mM KCl, 10mM (NH4)2SO4, 2mM MgSO4, 0.1% Triton X-100, and 1.0μl of template DNA) Optimal elongation temperature on LAMP reaction was determined at 59.0°C. Lane M : 1kb DNA ladder marker (Basic Bio); Lane 1-12: 45.0°C, 45.5°C, 46.7°C, 48.2°C, 50.2°C, 53.4°C, 56.7°C, 59.6°C, 61.8°C, 63.4°C, 64.6°C and 65.0°C, respectively.
Optimal dNTP concentration for specific-A. flavus LAMP reaction
To determine the optimal dNTP concentration for A. flavus-LAMP amplification, the LAMP reaction was carried out with dNTP concentrations ranging from 1.25mM to 10 mM. The LAMP products were successfully formed as a characteristic ladder of triple bands from 5mM to 10mM, but dNTPs were not amplified at concentrations below 5mM. Thus, the optimal dNTP concentration chosen for the reaction was 7.5mM (Fig. 3).
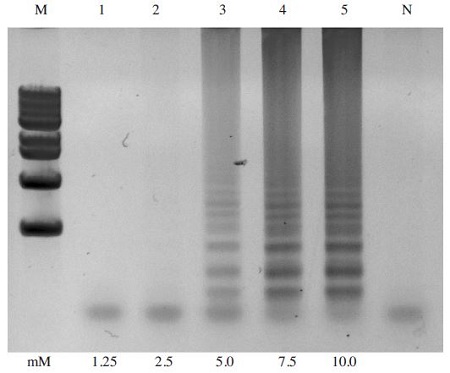
Effect of dNTP concentrations on LAMP reaction. The A. flavus-LAMP reaction was carried out 59°C for 60min using dNTPs concentration ranging from 1.25mM to 10mM with pBX-A. flavus plasmid DNA as a template. LAMP reaction was performed in a total 50μl volume containing 10 pmole each of F3 and B3, 40 pmole each of FIP and BIP, XmM dNTPs, 8 units of Bst DNA polymerase large fragment (New England Biolabs), 1X ThermoPol Reaction Buffer (20mM Tris-HCl, 10mM KCl, 10mM (NH4)2SO4, 2mM MgSO4, 0.1% Triton X-100, and 1.0μl of template DNA) The optimal concentration of dNTP was determined at 7.5mM. Lane M: 1kb DNA ladder Marker (Basic Bio); Lane N: negative control without template; Lane 1-5: 1.25mM, 2.5mM, 5mM, 7.5mM and 10mM dNTP, respectively.
Optimal primer concentration
To determine the optimal concentration of primer mix for the A. flavus-LAMP reaction, several primer mixtures raging from inner primer concentrations of 20 pmole to 100 pmole and outer primer concentrations of 5 pmole to 25 pmole were tested. 107 copy/ul of pBX-A. flavus clone was used as a template for the reaction. No amplification products were produced using 40 pmole FIP/BIP primer and 10 pmole F3/B3 primer. The amounts of LAMP products were identical using all primer mixtures from inner primer concentrations of 40 pmole to 100 pmole and from outer primer concentrations of 10 pmole to 25 pmole (Fig. 4). Therefore the optimal primer mixture for the LAMP reaction was determined to be 40 pmole outer primers and 10 pmole inner primers.
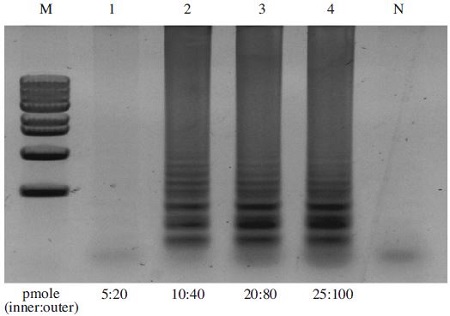
Optimal concentration of primer sets on LAMP reaction. The A. flavus-LAMP reaction was carried out 59°C for 60min using several primer mixtures raging from 20 pmole to 100pmole of inner primer and 5 pmole-25 pmole of outer primer. pBX-A. flavus clone was used as a template in LAMP reaction. LAMP reaction was performed in a total 50μl volume containing X pmole each of F3 and B3, X pmole each of FIP and BIP, 75mM dNTPs, 8 units of Bst DNA polymerase large fragment (New England Biolabs), 1X ThermoPol Reaction Buffer (20mM Tris-HCl, 10mM KCl, 10mM (NH4)2SO4, 2mM MgSO4, 0.1% Triton X-100, and 1.0μl of template DNA) he optimal concentration of primer mixture was determined at 40 pmole FIP/BIP primer and 10 pmole F3/B3 primer. Lane M: 1kb DNA ladder Marker (Basic Bio); Lane 1-4: 20 pmole FIP/BIP primer and 5 pmole F3/B3 primer, 40 pmole FIP/BIP primer and 10 pmole F3/B3 primer, 80 pmole FIP/BIP primer and 20 pmole F3/B3 primer, 100 pmole FIP/BIP primer and 25 pmole F3/B3 primer, Lane N: negative control with no template; respectively.
Specificity of A. flavus-LAMP reaction
To assess the specificity of the LAMP assay for different pathogens, LAMP reactions with specific LAMP primer sets were performed using genomic DNA of several pathogens, A. flavus, A. apis, and Nosema Ceranae, as templates. All of the LAMP products were analyzed by agarose gel electrophoresis. LAMP primer sets specifically amplified the LAMP products only in genomic DNA of A. flavus, whereas no amplification of LAMP product occurred using genomic DNA for A. apis and Nosema Ceranae. (Fig. 5).
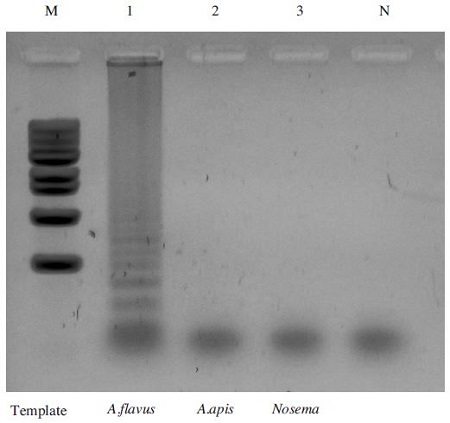
Specificity of the A. flavus-LAMP assay. Each plasmid DNAs containing different pathogen; A. flavus, A. apis and Nosema Ceranae were used as the template on LAMP assay. LAMP reaction was performed in a total 50μl volume containing 10 pmole each of F3 and B3, 40 pmole each of FIP and BIP, 7.5mM dNTPs, 8 units of Bst DNA polymerase large fragment (New England Biolabs), 1X ThermoPol Reaction Buffer (20mM Tris-HCl, 10mM KCl, 10mM (NH4)2SO4, 2mM MgSO4, 0.1% Triton X-100, and 1.0μl of template DNA). Lane M: 1Kb DNA ladder Marker, Lane 1: LAMP products using genomic DNA for A. flavus Lane 2: LAMP products using genomic DNA for A. apis Lane 3: LAMP products using genomic DNA for Nosema Ceranae Lane N: negative control.
Determination of optimal time for A. flavus-LAMP reaction
To determine the optimal reaction time for the A. flavus-LAMP assay, several reaction times range from 10 min to 60 min were tested. 107copy/ul of pBX-A. flavus clone was used as a template for the reaction. Negative sample were amplified at 60 minutes. The amount of LAMP products were divided equally and amplified for different reaction times from 10 to 60 min (Fig. 4). Therefore, the optimal reaction time for the LAMP reaction was 60 min.
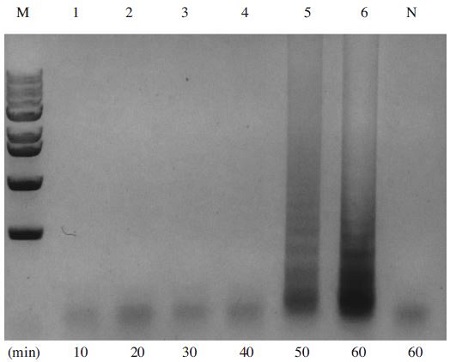
A. flavus-specific LAMP was performed under range of 10 min to 60min as reaction time after denaturation step. LAMP reaction was performed in a total 50μl volume containing 10 pmole each of F3 and B3, 40 pmole each of FIP and BIP, 7.5mM dNTPs, 8 units of Bst DNA polymerase large fragment (New England Biolabs), 1X ThermoPol Reaction Buffer (20mM Tris-HCl, 10mM KCl, 10mM (NH4)2SO4, 2mM MgSO4, 0.1% Triton X-100, and 1.0μl of template DNA). Lane M is 1KB ladder marker (Enzynomics, Korea). Lane 1 to 6 were carried out at 10, 20, 30, 40, 50 and 60min, respectively. A. flavus-specific LAMP products could be amplified in 50 min reaction time.
Detection of LAMP product with fluorescent dye
The LAMP amplification products in the tubes were visualized using the fluorescent dyes, SYBR Green I or Gene finderTM. When SYBR Green I was added to the tubes after the reaction, green fluorescence of LAMP product was observed clearly with the naked eye, with a positive reaction indicating infection with A. flavus. The negative control presented no signal or orange color in UV light and the Gene finderTM. A positive signal in Gene finderTM is yellow, while the negative signal is orange (Fig. 7). The LAMP products were also confirmed by agarose gel electrophoresis (data not shown).
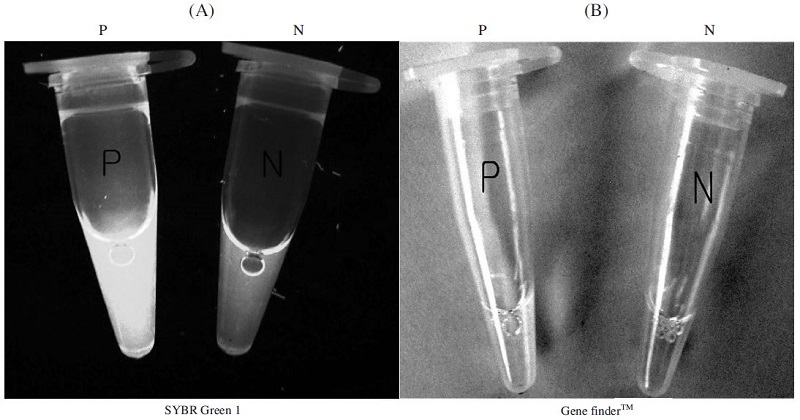
Fluorescent test of A. flavus-LAMP products. After the reaction, a fluorescent dye, SYBR Green I, Gene finderTM ware mixed with the LAMP products and the observed under an ultraviolet trans illuminator and light Panel A: using the SYBR Green I a fluorescence test of A. flavus-LAMP product (P) and negative control (N). Panel B: using the Gene finderTM a fluorescence test of A. flavus-LAMP product (P) and negative control (N). Positive reaction tubes appeared Yellow and negative reaction tubes appeared orange with white background.
DISCUSSION
A. flavus is a well-known pathogen that causes the Stonebrood fungal diseases in honeybees and larvae. In 2013,?according to the Korea Center for Honeybee disease control, Stonebrood diseases showed a 13% infection rate among diseased honeybees (Yoo, M.S., 2013). All current molecular detection system is only working in the laboratory. It is needed to develop a rapid detection system that is suitable for use in the apiary field. Rapid detection of Stonebrood could lead to control of stonebrood in hive management.
In this study, the LAMP diagnostic protocol was carried out for the detection of the fungal diseases caused by A. flavus in honeybees. The amplified products demonstrated a ladder-like pattern on the 1.5% Agarose gel. The two sets of primers, outer and inner primers, were designed based on the 18S gene sequences. The A. flavus-LAMP reaction was confirmed to be highly specific for the existence of A. flavus.
Hence, one advantage of this method is that it does not require expensive equipment such as a thermocycler. Therefore, this specific A. flavus-LAMP is able to perform field detection with simple incubator.
This advantage is very important for the rapid control of disease through early diagnosis. Further, naked eye analysis using SYBR Green I and Gene finderTM can be a useful tool for field analysis. A. flavus-LAMP not only is expected to be used for the detection of fungal pathogens, but also the monitoring of natural infection in Apis mellifera by A. flavus.
Acknowledgments
This work was supported by Bio-Industry Technology Development Program (312027-3) and Advanced production technology Program (112042-03), ministry of Agriculture, Food and Rural Affairs, and Kyonggi University's Graduate Research Assistantship 2014, This work was supported by Kyonggi University Research Grant 2013.
LITERATURE CITED
- Alexandra, K, Bernard, V, James, C, Ingolf, Steffan-Dewenter, 1 Saul A, Cunningham, Claire, Kremen, Teja, Tscharntke., (2007), Importance of pollinators in changing landscapes for world crops, Proc Biol Sci, 274(1608), p303-313, This work was supported by Kyonggi University Research Grant 2013.
-
Allen, M.F., and B.V. Ball, (1996), The incidence and world distribution of honey bee viruses, Bee World, 77, p141-162.
[https://doi.org/10.1080/0005772X.1996.11099306]

- Cho, Y.H., M.S. Yoo, E.H. Kim, D.W. Lee, I.W. Kim, M.H. Kang, S.H. Han, and B.S. Yoon, (2007), Development of Rapid detection method for Black Queen Cell Virus (BQCV) using the Loop-mediated Isothermal Amplification (LAMP) in Honeybees, Korean J. Apiculture, 22(2), p139-146.
-
Fujiyuki, T., Ohk, S, Takeuchi, S, Ono, M, Nomoto, A., and Kubo, T., (2006), Prevalence and Phylogeny of Kakugo Virus, a Novel Insect Picorna-Like Virus That Infects the Honeybee (Apis mellifera L.), under Various Colony Conditions, Journal of Virology, p11528-11538.
[https://doi.org/10.1128/JVI.00754-06]

-
Jie, Luo, Marta H. Taniwaki, Beatriz T. Iamanaka, Rudi F. Vogel, Ludwig Niessen, (2014), Application of loop-mediated isothermal amplification assays for direct identification of pure cultures of Aspergillus flavus, A. nomius, and A. caelatus and for their rapid detection in shelled Brazil nuts, International Journal of Food Microbiology, 172, p5-12.
[https://doi.org/10.1016/j.ijfoodmicro.2013.12.001]

- Lee, H.M., J.S. Ha, Y.H. Jo, S.H. Nam, B.S. Yoon, (2004), PCR Detection Method of Ascosphera apis, Aspergillus flavus for Rapid Identification of Fungal Disease in Honeybee, Korean J. Apiculture, 19(2), p139-148.
- Lee, H.M., J.S. Ha, Y.H. Jo, S.H. Nam, and B.S. Yoon, (2004), PCR Detection Method of Ascosphera apis, Aspergillus flavus for Rapid Identification of Fungal Disease in Honeybee, Korean J. Apiculture, 19(2), p139-148.
- Lee, J.S., H.Y. Lim, and B.S. Yoon, (2013), Development of Specific Detection Method for Fungal Pathogens in Honeybee by Loop-Mediated Isothermal Amplification, Korean J. Apiculture, 28(4), p245-250.
- Maassen, A., (1913), Weitere Mitteilungen uberder seuchenhaften Brut-krankheiten der Bienen [Further communication on the epidemic brood disease of bees], Mitteilungen ausder Kaiserlichen Bioligischen Anstalt fur Land-und Forstwirtscshaft, 14, p48-58.
-
Nagamine, K., T. Hase, and T. Notomi, (2002), Accelerated reaction by loop-mediated isothermal amplification using loop primers, Molecular and Cellular Probes, 16(3), p223-229.
[https://doi.org/10.1006/mcpr.2002.0415]

-
Norihiro, T., M. Yasuyoshi, K. Hidetoshi, and N. Tsugunori, (2008), Loop-mediated isothermal amplification (LAMP) of gene sequences and simple visual detection of products, Nature protocols, 3(5), p877-882.
[https://doi.org/10.1038/nprot.2008.57]

-
Notomi, T., H. Okayama, and H. Masubuchi, (2000), Loop-mediated isothermal amplification of DNA Nucleic Acids Research, 28, pe63.
[https://doi.org/10.1093/nar/28.12.e63]

-
Notomi, T., H. Okayama, H. Masubuchi, T. Yonekawa, K. Watanabe, N. Amino, and T. Hase, (2000), Loopmediated isothermal amplification of DNA, Nucleic Acids Research, 28(12), pe63.
[https://doi.org/10.1093/nar/28.12.e63]

-
Ohori, Akira, Shigeo, Endo, Ayako, Sano, Koji, Yokoyama, Kyoko, Yarita, Masashi, Yamaguchi, Katsuhiko, Kamei, Makoto, Miyaji, and Kazuko, Nishimura., (2006), Rapid identification of Ochroconis gallopava by a loopmediated isothermal amplification (LAMP) method, Vet Microbiol, 114(3-4), p359-365.
[https://doi.org/10.1016/j.vetmic.2005.11.064]

- Tsugunori, N., (2007), Loop-mediated isothermal amplification, Nippon Rinch, 65, p957-961.
-
Xu, H.D., Zhi-Xun Guo, Y.J. Ou, and J.Y. Wang, (2009), Detection of redspotted grouper nervous necrosis virus by loop-mediated isothermal amplification, J. Virol. Methods, 163(1), p123-128.
[https://doi.org/10.1016/j.jviromet.2009.09.009]

- Yoo, M.S., Y.H. Cho, I.W. Kim, M.H. Kang, S.H. Kwon, S.H. Han, and B.S. Yoon, (2008), Development of Rapid Detection Method for Honeybee Viral Diseases using the Loomediated Isothermal Amplification (LAMP), Korean J. Apiculture, 23(3), p185-190.
- Yoo, M.S., Y.H. Kim, N.H. Kim, H.N. Jung, Thi, B., Reddy, K., S.C. Jung, S.W. Kang, (2013), Molecular Detection of Honeybee Disease in Apis mellifera and Apis cerana in Korean apiaries, 2013, The 29th Conference of the Apicultural Society of Korea, 2013, p66.

