
사후 조건의 꿀벌 내역봉에서 qRT-PCR을 위한 안정적인 reference 유전자 선발
Abstract
The western honey bee (Apis mellifera) is essential for pollination, supporting both ecosystem stability and agricultural productivity. Recently, mass colony losses have been reported worldwide, including in Korea. Investigating gene expression in postmortem honey bee samples may help identify the causes of colony collapse. However, selecting stable reference genes under postmortem conditions is critical for accurate gene expression analysis using quantitative real-time PCR (qRT-PCR). In this study, we evaluated the expression stability of 10 candidate reference genes (RPS5, RPS18, GAPDH, ARF1, RAB1a, PPI, PGK, SDH, TBP, and EF1) in the head tissues of honey bees collected at postmortem intervals(PMIs) ranging from 1 to 7 days. We assessed gene stability using Cq value distribution and four algorithms: NormFinder, BestKeeper, geNorm, and RefFinder. In addition, expression levels of the target gene EcR were compared using both single and multiple reference genes. Among the candidates, RAB1a showed the highest overall stability across all PMIs and was most consistent with multi-gene normalization results, making it the most suitable single reference gene. Abdominal tissues exhibited greater variability due to decomposition, suggesting head tissue is more appropriate for postmortem gene expression analysis. These results provide a foundation for postmortem molecular studies in honey bees and may contribute to understanding colony loss and estimating PMI in apiculture.
Keywords:
Honey bee, qRT-PCR, Reference gene, Expression stability, Postmortem interval서 론
서양 꿀벌 (Apis mellifera)은 생태계의 안정성과 농업 생산성 유지를 위한 수분 매개 활동을 수행하는 주요 곤충으로, 생태적·경제적으로 매우 중요한 역할을 한다 (Jung, 2008; Martins et al., 2008). 그러나 2006년 미국 Florida, Georgia, North Carolina, Pennsylvania 지역에서 꿀벌 군집의 대량 손실 사례가 처음 보고된 이후 (VanEngelsdorp et al., 2007), 미국 전역은 물론 유럽 각국에서도 유사한 군집 붕괴 현상이 지속적으로 보고되고 있다 (Bruckner et al., 2023; Gray et al., 2023). 우리나라 또한 예외는 아니며, 2021년 겨울철 남부 지방을 중심으로 월동 봉군의 집단 소실이 발생한 이래 (Kim, 2022), 현재는 전국적으로 그 피해가 확산되고 있는 실정이다.
꿀벌 폐사의 원인으로는 외부 기생충 감염, 병원체 감염, 이상 기후, 봉군 내 역할 불균형 등 다양한 요인이 지목되고 있으나 (Dainat et al., 2012; Perry et al., 2015; Kim, 2022; Lee et al., 2022), 단일 요인보다는 여러 요인이 복합적으로 작용하여 집단 폐사를 유발하는 것으로 이해되고 있다. 기존 연구들은 주로 살충제, 병원체 등 스트레스 요인을 부여한 후 생존한 개체의 생리학적 변화를 분석하는 데 초점을 맞추어 왔다 (Johnson et al., 2009; Zaobidna et al., 2017; Butolo et al., 2021; You et al., 2025). 그러나 실제 양봉현장에서는 집단 폐사가 발생한 이후에 피해를 인지하게 되며, 분석 가능한 시료는 대부분 꿀벌 사체에 국한된다는 점에서, 사체를 활용한 생리학적 지표 분석이 꿀벌 폐사 원인 규명을 위한 중요한 수단으로 주목되고 있다.
사후생리학 (thanatobiology)은 생물체 사망 후 나타나는 생리적 변화를 연구하는 분야로, 사망 원인 규명 및 사후 경과일 (postmortem interval, PMI) 추정에 활용되고 있다. 생물체는 사망과 함께 생리 기능이 중단되지만, 스트레스, 면역, 염증, 세포사멸, 물질 수송, 발달, 후성유전 조절 등과 관련된 유전자들은 일정 시간 동안 발현이 지속될 수 있음이 알려져 있다 (Pozhitkov et al., 2017). 이러한 사후 유전자 발현은 인간 (Homo sapiens), 제브라피시 (Danio rerio), 생쥐 (Mus musculus) 등 척추동물뿐만 아니라, 화랑곡나방 (Plodia interpunctella), 누에나방 (Bombyx mori)과 같은 무척추동물에서도 확인된 바 있다 (Franz et al., 2005; González-Herrera et al., 2013; Pozhitkov et al., 2017; Shafeeq et al., 2020; Yang et al., 2024). 예를 들어, Shafeeq et al. (2020)은 사후 시간이 경과함에 따라 총 RNA가 점진적으로 분해되며, heat shock protein 70의 특이적인 발현 양상이 나타난다고 보고하였다. 또한 Yang et al. (2024)은 B. mori 사체에서 세포 주기 조절, 열 발생, 면역 반응, 아연 이온 항상성 등의 경로가 시간 특이적으로 활성화됨을 밝힌 바 있다. 더불어, 돼지와 생쥐 등 포유류를 대상으로 한 선행 연구에서는 hypoxia inducible factor 1, GAPDH, RPS29 등의 유전자들이 조직별 및 시간별로 특이적인 발현 패턴을 보이며, 이를 바탕으로 사후경과일의 추정이 가능함을 제시하였다 (Kimura et al., 2011; Cianci et al., 2024). 이러한 선행 결과들은 꿀벌에서도 유사한 원리를 적용하여 봉군 내 사체의 사후 경과일을 추정할 수 있는 가능성을 시사한다.
정량적 실시간 중합효소연쇄반응 (quantitative real-time PCR, qRT-PCR)은 생리적 조건 변화에 따른 유전자 발현을 정밀하게 분석할 수 있는 방법으로, 사후 유전자 발현 연구에도 활용 가능성이 높다. 타겟 유전자의 발현량을 정확히 정량화하기 위해서는 실험 조건과 무관하게 안정적으로 발현되는 reference 유전자의 선정이 필수적이다. 일반적으로 housekeeping 유전자가 reference 유전자로 활용되지만, 조직 유형, 계절, 종 (species)에 따라 발현 안정성에 차이가 발생할 수 있으므로 (Freitas et al., 2019; Jeon et al., 2020), 실험 조건에 적합한 reference 유전자를 사전에 검증하는 과정이 필요하다.
따라서 본 연구에서는 꿀벌 사체에서 사후 유전자 발현 분석에 적합한 reference 유전자를 선정하고자, 10개의 후보 housekeeping 유전자들 [40S ribosomal pro tein S5 (RPS5), 40S ribosomal protein S18 (RPS18), glyceraldehyde-3-phosphate dehydrogenase (GAPDH), ADP-ribosylation factor 1 (ARF1), Ras-related protein Rab-1A (RAB1a), peptidyl-prolyl cis-trans isomerase (PPI), phosphoglycerate kinase (PGK), succinate dehydrogenase [ubiquinone] flavoprotein subunit, mitochondrial (SDH), TATA-box-binding protein (TBP), elongation factor 1-alpha F2 (EF1)]의 발현 안정성을 평가하였다. 이전 연구들에서 RPS5, RPS18, GAPDH, ARF1, RAB1a은 다양한 조건에 노출된 꿀벌의 유전자 발현 연구에 사용된 reference 유전자들로 이용되었고 (Jeon et al., 2020; Kim et al., 2021; Kim et al., 2022; Kim and Kim, 2025), GAPDH, PPI, PGK, SDH, TBP, EF1은 포유동물의 사후 생리학 연구에 활용된 reference 유전자들로 (Koppelkamm et al., 2010; Liapi et al., 2015; Xue et al., 2016; Tolbert et al., 2018), 해당 유전자들은 꿀벌의 사후 조건에서 발현 안정성이 높을 것으로 예상되어 본 연구에서 후보 reference 유전자로 선정하였다. 이를 위해 Cq 값 분포 분석과 함께 NormFinder, BestKeeper, geNorm, RefFinder 등 4종의 안정성 분석 알고리즘을 활용하였다. 또한, 선정된 단일 및 다중 reference 유전자를 기반으로 타겟 유전자 [Ecdysone receptor (EcR)]의 발현량을 정량화하고, 그 결과를 비교 분석함으로써 사후 유전자 분석에 가장 적합한 reference 유전자를 제시하고자 하였다.
재료 및 방법
1. 샘플 준비
실험에 사용된 꿀벌 (A. mellifera)의 내역봉 (nurse bee)은 경상북도 상주시 소재 경북대학교 실험 양봉장에서 사육 중인 벌통으로부터 채집하였다. 돌발적인 봉군의 폐사 현상이 발생할 경우, 외역 활동으로 외부에서 사망할 가능성이 높은 외역봉보다는 봉군내에 머물고 있는 내역봉의 샘플 확보가 상대적으로 유리할 것으로 판단하여 본 연구에서는 내역봉을 대상으로 연구를 수행하였다. 유충 관리 및 소방 청소 등의 내역봉 특이 행동을 수행하는 일벌들로, 무작위로 선별하였다 (Johnson, 2010). 채집된 개체들은 32°C의 암 조건을 갖춘 인큐베이터 (JSBI-250C; JS Research Inc., Gongju-si, Republic of Korea)에서 24시간 동안 안정화시켰다.
사후 경과일이 서로 다른 꿀벌 사체를 확보하기 위해, 내역봉에 CO2 가스를 처리하여 안락사시켰으며, 반복 자극에도 반응하지 않는 개체를 사망한 것으로 간주하였다. 이후 꿀벌 사체는 14 oz 플라스틱 용기에 밀봉하여 실온에서 보관하였고, 사후 1일부터 7일까지 하루 간격으로 시료를 채취하였다. 곰팡이 발생이 육안으로 확인된 개체는 오염 방지를 위하여 분석에서 제외하였다. 확보된 모든 시료는 분석 전까지 -80°C에서 냉동 보관하였다.
2. RNA 추출, cDNA 합성, primer 설계 및 qRT-PCR
현장 조건에서 벌 사체의 부속지가 손상되거나 유실될 가능성을 고려하여, 모든 사체에서 더듬이 (antenna)를 제거한 후 머리와 복부 조직을 분리하였고, 각각 개체 단위 (n=1)로 RNA를 추출하였다. 각 조직은 stainless steel bead와 파쇄기 (Bertin Technologies, Bretonneux, France)를 이용하여 완전히 균질화하였으며, 총 RNA는 yesR Total Plus kit (GenesGen, Busan, Korea)를 사용하여 제조사 지침에 따라 추출하였다. 이 과정에서 genomic DNA는 gDNA eliminator buffer와 DNase I (GenesGen) 처리로 제거하였다. RNA의 농도 및 순도는 SpectraMax QuickDrop 분광광도계 (Molecular Devices, Sunnyvale, CA, USA)를 이용하여 측정하였으며, 추출된 RNA는 -80°C에서 보관하였다.
cDNA 합성은 총 RNA 1 μg을 oligo (dT) primer와 ReverTra Ace 역전사효소 (Toyobo, Osaka, Japan)가 포함된 10 μL 반응계에서 수행하였다. 합성된 cDNA는 Kim and Kim (2025)의 방법을 참고하여 SYBR Green 기반의 정량적 실시간 PCR을 수행하였으며, 장비는 CFX Connect Real-Time PCR Detection System (Bio-Rad, Hercules, CA, USA)을 사용하였다. 반응 혼합물은 각 시료에서 cDNA 50 ng, primer 10 pmol, 2× Thunderbird SYBR qPCR Master Mix (Toyobo)로 구성하였으며, 증폭 조건은 95°C에서 1분간 초기 변성 후, 95°C 15초, 56°C 15초, 72°C 30초의 조건으로 40사이클 수행하였다. 증폭 산물의 특이성은 melting curve 분석을 통해 확인하였다.
총 10개의 후보 reference 유전자 (RPS5, RPS18, GAPDH, ARF1, RAB1a, PPI, PGK, SDH, TBP, EF1)와 타겟 유전자 (EcR)의 Cq 값은 공통적으로 fluorescence threshold를 0.1로 설정하여 측정하였다. 후보 reference 유전자의 primer 정보는 기존 연구 (Jeon et al., 2020; Kim and Kim, 2023; Kim and Kim, 2025)를 참고하였으며, 타겟 유전자 (EcR)의 primer는 OligoCalc software (http://biotools.nubic.northwestern.edu/OligoCalc.html)를 통해 설계하였다. 각 primer의 증폭 효율은 cDNA를 10배씩 연속 희석한 후 생성된 표준 곡선의 기울기 (slope)를 이용하여, E=10-1/slope의 공식으로 계산하였다.
3. 사후 경과일에 따른 reference 유전자의 발현 안정성 평가
다양한 사후 경과일을 갖는 꿀벌 사체의 머리 및 복부 조직에서 후보 reference 유전자들의 발현 안정성을 평가 하기 위해, 각 유전자의 Cq 값을 기반으로 Cq 분포 분석과 NormFinder (version 0.953) (Andersen et al., 2004), BestKeeper (version 1) (Pfaffl et al., 2004), geNorm (version 3.2) (Vandesompele et al., 2002), RefFinder (Xie et al., 2023)를 포함한 네 가지 알고리즘을 활용하였다.
Cq 분포 분석에서는 각 유전자의 산술 평균 (arithmetic mean, AM), 표준편차 (standard deviation, SD), 변이계수 (coefficient of variation, CV=SD/AM)를 산출하여 각 유전자의 발현 일관성을 평가하였다. NormFinder는 발현 분산 기반의 stability value (SV)를 제공하며, SV 값이 낮을수록 높은 발현 안정성을 의미한다 (Andersen et al., 2004). BestKeeper는 각 유전자의 Cq 값의 기하 평균 (geometric mean)과 SD를 분석하며, SD 값이 작을수록 발현이 안정적인 것으로 간주된다 (Pfaffl et al., 2004). geNorm은 각 Cq 값들의 기하 평균을 기반으로 산출된 M 값을 이용하여 발현 안정성을 평가하며, 추가적으로 pairwise variation 분석 (Vn/Vn+1)을 통해 최적의 reference 유전자 수를 제안한다 (Vandesompele et al., 2002). RefFinder는 위의 세 가지 알고리즘 결과와 comparative ΔCq 방법의 결과를 통합하여 종합적인 발현 안정성 순위를 산출한다
4. 타겟 유전자 정량화를 위한 후보 기준 유전자의 적합성 평가
타겟 유전자의 정량 정확도를 향상시키기 위해 geNorm의 pairwise variation 분석은 두 개 이상의 reference 유전자 사용을 권장한다. 그러나 본 연구에서는 단일 reference 유전자를 사용하였을 때도 타겟 유전자 발현의 신뢰성 있는 정량이 가능한지를 검증하고자 하였다. 이를 위해 각 사후 조건에서 권장된 다중 reference 유전자 조합과 단일 reference 유전자를 각각 사용하여 타겟 유전자 EcR의 발현량을 정량화하였고, 두 방법 간의 차이를 비교 분석하였다.
정량화 결과 간 차이값 (difference)은 다음과 같이 정의하였다:
Difference
= (다중 reference 유전자들의 조합으로 정량화된 EcR 발현량)
-(단일 reference 유전자로 정량화된 EcR 발현량)
다중 reference 유전자는 각 사후 조건별로 geNorm의 pairwise variation 분석에서 도출된 최적 유전자 수를 반영하였으며, 유전자 조합은 RefFinder에서 제시한 순위를 기반으로 선정하였다. 정량화 방법 간 유사성 평가는 각 사후 조건에서 산출된 EcR 발현량 차이의 절대값 (absolute difference)의 총합으로 정의하였다 (Kim et al., 2023; Park et al., 2023; Kim and Kim, 2025). 또한, 단일 및 다중 reference 유전자를 활용해 사후 7일간 측정된 EcR 발현 양상의 통계적 차이는 반복측정 분산분석 (repeated-measures ANOVA)과 Tukey의 사후 검정 (Tukey’s multiple comparison test)을 통해 분석하였다 (SPSS for Windows, version 23.0; IBM, Armonk, NY, USA). p 값이 유의수준 0.05 이상일 경우 통계적으로 유의한 차이가 없는 것으로 간주하였으며, 이와 함께 absolute difference의 총합이 가장 작은 단일 reference 유전자는 사후 조건에 관계없이 타겟 유전자의 정량화에 적합한 유전자로 판단하였다.
결 과
1. 후보 reference 유전자와 타겟 유전자의 primer 정보
본 연구에서 분석 대상으로 선정한 10종의 후보 reference 유전자 (RPS5, RPS18, GAPDH, ARF1, RAB1a, PPI, PGK, SDH, TBP, EF1)와 타겟 유전자 EcR에 대해 primer의 특이성과 증폭 효율을 검증하였다. 모든 primer는 PCR 산물이 전기영동에서 단일 밴드를 형성하였으며, qRT-PCR melting curve 분석에서도 단일 peak를 나타내어 특이적인 증폭이 이루어졌음을 확인하였다 (data not shown). 증폭 효율은 90~110% 범위 내에 있었으며, 선형 회귀 계수 (R2)는 모두 0.9 이상으로, 본 연구 조건에 적합한 primer로 판단되었다 (Table 1).

Information on primer sets for candidate reference genes and target gene
2. Reference 유전자의 Cq 분포 분석
사후 경과일에 따른 reference 유전자들의 Cq 값 분포를 분석한 결과 (Fig. 1), 후보 유전자 전반에서 사후 시간이 증가함에 따라 Cq 값이 점진적으로 증가하는 경향을 보였다. 이는 사후 시간이 경과함에 따라 전체적인 전사 수준이 감소함을 시사한다. 특히, 동일한 유전자에서도 복부 조직은 머리 조직보다 추세선의 기울기가 큰 경향을 보여, 복부에서의 RNA 분해 속도가 상대적으로 빠른 것으로 나타났다 (Fig. 1). 복부 조직은 부패에 취약한 장기가 밀집되어 있어, 사후 시간이 경과할수록 유전자 발현의 안정성이 낮아질 가능성이 높다. 실제로 대부분의 후보 유전자가 사후 경과일 별로 복부 조직에서 더 큰 표준편차를 나타내어 (Fig. 1), 이후 분석에서는 복부를 제외하고 머리 조직 시료에서 도출한 Cq 데이터를 기반으로 reference 유전자의 발현 안정성을 평가하였다.
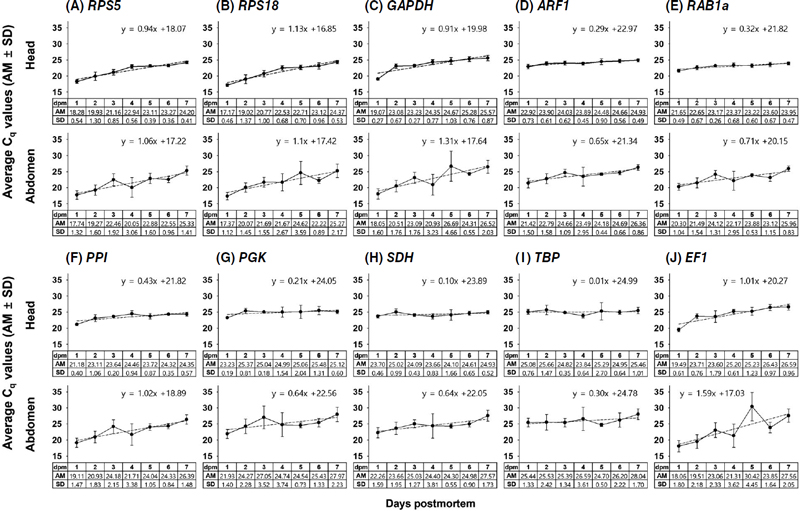
Average Cq values of candidate reference genes at different postmortem intervals (PMI) in nurse bee carcasses. The dashed blue line represents the regression curves. Abbreviations: AM, arithmetic mean; SD, standard deviation; dpm, day(s) postmortem.
머리 조직 내 후보 유전자들의 발현 변동성을 확인하기 위해 Cq 값의 AM, SD, CV 값을 산출하였다 (Fig. 2). CV 값이 1 미만일 경우 안정적인 발현을 가진 유전자로 간주할 수 있으며 (Ospina and Marmolejo-Ramos, 2019), 본 연구의 모든 후보 유전자가 해당 기준을 만족하였다. 사후 경과일별 CV 비교 결과, 사후 1일과 3일에 PGK의 CV (0.01)가 가장 낮았으며, 사후 2일과 4일에는 ARF1이 가장 작은 CV (0.02~0.03)를 나타내어, 해당 조건에서 각각 가장 안정적인 유전자로 분석되었다 (Fig. 2A~D). 또한, 사후 5일과 사후 7일 조건에서 공통적으로 RPS5 (CV=0.03~0.05)가 가장 안정적인 유전자로 확인된 반면, 사후 6일에서 발현 변동성이 가장 적은 유전자는 PPI (CV=0.01)로 제시되었다 (Fig. 2E~G). 전체 사후 조건을 통합한 CV 분석 결과, 10개의 후보 reference 유전자 중 ARF1가 가장 작은 CV (0.03)를 보여주었다 (Fig. 2H).
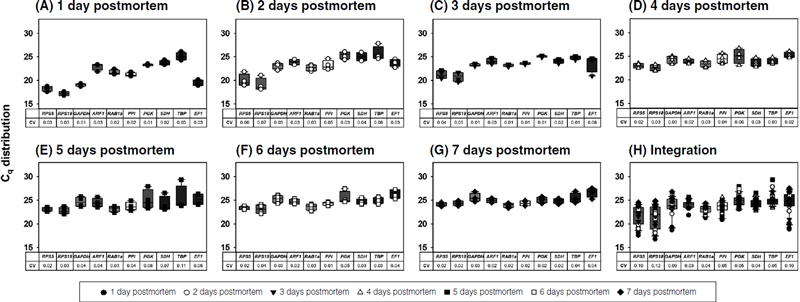
The distribution of Cq values for candidate reference genes in nurse bees at different postmortem intervals. Cq values were obtained from bee carcasses sampled at varying postmortem intervals (A~G) and under integrated conditions (H). Box plots show the 25th, 50th (median), and 75th percentiles, with whiskers representing minimum and maximum values. Each dot indicates the Cq value of an individual sample collected at 1~7 day(s) postmortem (dpm).
3. Reference 유전자의 발현 안정성 평가
NormFinder는 후보 reference 유전자의 발현 변이를 기반으로 안정성 값 (SV)을 산출하며 (Chai et al., 2020), SV가 1 미만일 경우 reference 유전자로 적합하다고 판단한다 (McMillan and Pereg, 2014; Julian et al., 2016). 다양한 사후 경과일을 갖는 샘플들의 머리 조직에서 후보 reference 유전자들의 SV들을 분석한 결과, 모든 후보 reference 유전자의 SV 값이 1 미만으로 reference로 적합하다고 판단되었다 (Fig. 3). 사후 경과일별 분석에서, 사후 1, 2, 3일 조건에서 PPI (SV=0.00), EF1 (SV=0.01), RAB1a (SV=0.01)이 각각 안정적인 유전자로 제시되었다 (Fig. 3A~C). 또한, 사후 4~5일 조건에서 ARF1가 가장 작은 SV 값들 (0.00~0.01)을 보여줬으며, 사후 6일과 7일 조건에서 각각 RPS5 (SV=0.01)와 SDH (SV=0.00)가 가장 발현 변이성이 낮은 것으로 확인되었다 (Fig. 3D~G). 전체 데이터를 통합한 분석에서는 PPI가 SV=0.02로, 머리 조직에서 가장 안정적으로 발현하는 유전자로 분석되었으며, RAB1a (0.02)와 ARF1 (0.03)가 그 다음으로 안정적인 유전자로 관찰되었다 (Fig. 3H).
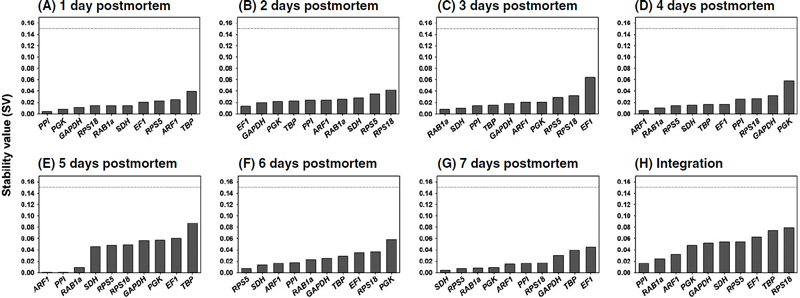
Comparison of stability values (SVs) for candidate reference genes in nurse bees at different postmortem intervals. Stability values were calculated using NormFinder based on samples collected at each postmortem interval (A~G) and under integrated conditions (H). SVs are presented in order from least stable (left) to most stable (right). The dashed red line indicates the cut-off value of 0.15.
BestKeeper 분석에서는 SD<1을 기준으로 안정성을 평가하였다 (Pfaffl et al., 2004). 분석 결과, 최소 6개 이상의 유전자가 모든 사후 조건에서 해당 기준을 충족하였다 (Fig. 4). 각 사후 경과일의 후보 reference 유전자들의 SD 값들을 분석했을 때, 사후 1일과 3일 조건에서 PGK (SD=0.13~0.14)가 공통적으로 가장 안정적으로 발현하는 것으로 나타났다 (Fig. 4AC). 또한, 사후 2, 4, 5, 6, 7일에 가장 발현 변동성이 낮은 유전자는 각각 GAPDH (SD=0.49), ARF1 (SD=0.34), RPS5 (SD=0.27), PPI (SD=0.26), RAB1a (SD=0.26)로 제시되었다 (Fig. 4B, D~G). 모든 사후 경과일의 샘플들을 통합하여 후보 유전자들의 발현 안정성을 분석한 결과 (Fig. 4G), ARF1 (0.67)>RAB1a (0.68)>SDH (0.73)>TBP (0.84)>PGK (0.91)>PPI (0.95) 순으로 나타났다.
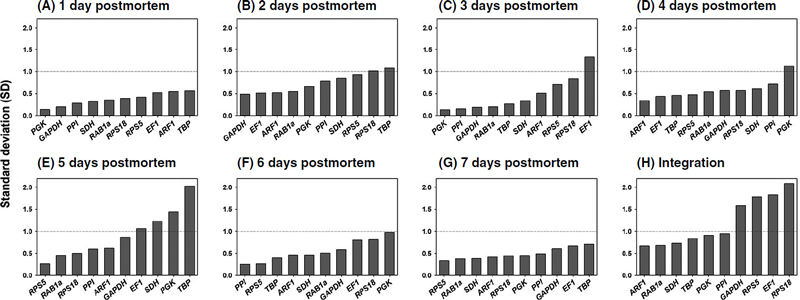
Comparison of standard deviations (SDs) for candidate reference genes in nurse bees at different postmortem intervals. SD values were calculated using the BestKeeper algorithm for samples collected at each postmortem interval (A~G) and under integrated conditions (H). SD values are arranged from the least stable (left) to the most stable (right). The dashed red line indicates the cut-off value of 1.0.
geNorm 분석에서는 M<1을 기준으로 안정성을 평가하였다 (Hellemans et al., 2007). 대부분의 유전자가 해당 기준을 충족하였으나, 사후 5일 조건에서는 일부 유전자가 기준을 초과하였다 (Fig. 5). 사후 조건별로 가장 낮은 M 값을 보인 유전자는 사후 1, 3, 6일 조건에서 RAB1a (M=0.14~0.23)였다 (Fig. 5A, C, F). 또한, 사후 2, 4, 5, 7일에는 각각 EF1 (M=0.21), RPS5 (M=0.23), ARF1 (M=0.28), PPI (M=0.15)가 가장 낮은 발현 변이성을 나타내었다 (Fig. 5B, D, E, G). 서로 다른 사후 경과일을 갖는 머리 조직 샘플들을 통합하여 geNorm으로 분석했을 때 (Fig. 5H), 5개의 후보 유전자 (ARF1, RAB1a, PPI, PGK, SDH)의 M 값이 발현 안정성 기준을 만족하는 것으로 확인되었으며, 이 중 ARF1가 가장 적은 M 값 (0.61~0.73)으로 분석되어 최적의 reference 유전자로 선정되었다.
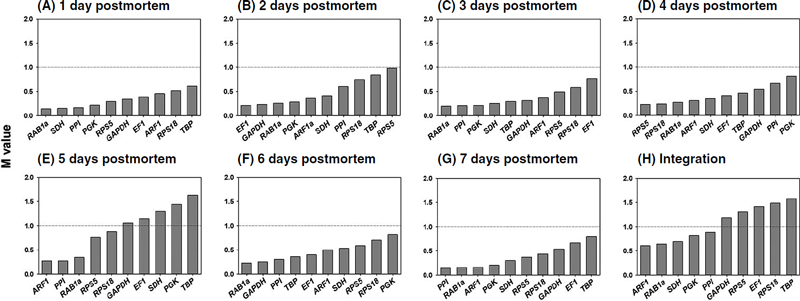
Comparison of M values for candidate reference genes in nurse bees at different postmortem intervals. M values were calculated using the geNorm algorithm for samples collected at each postmortem interval (A~G) and under integrated conditions (H). The values are arranged from the least stable (left) to the most stable (right). The dashed red line indicates the cut-off value of 1.0.
RefFinder는 comparative delta Cq 방법과 세 가지 알고리즘 프로그램들 (NormFinder, BestKeeper, geNorm)의 분석 결과들을 기반으로 후보 reference 유전자의 발현 안정성에 대한 종합적인 순위 (ranking value)를 제시한다 (Xie et al., 2023). 사후 1, 2, 6일에는 PPI, EF1, RPS5가 각각 가장 안정적으로 발현하는 유전자로 (Fig. 6A, B, F), 사후 3일과 7일 조건에서 RAB1a가 최적의 reference 유전자로 확인되었다 (Fig. 6C, G). 또한 사후 4~5일 조건에서는 ARF1가 가장 적은 발현 변동성을 보여줬다 (Fig. 6D, E). 모든 사후 샘플들을 통합하여 분석하였을 때 (Fig. 6H), RAB1a가 1.41로 최적의 reference 유전자로 선정되었고, ARF1 (1.73), PPI (2.78) 순으로 발현 안정성이 검증되었다 (Fig. 6H).
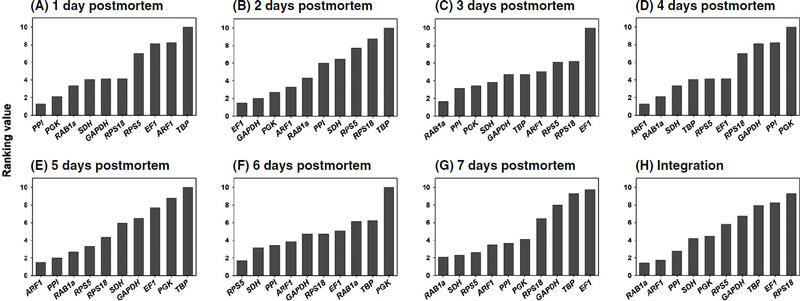
Comprehensive ranking of candidate reference genes in nurse bees across different postmortem intervals. Ranking values were calculated using the RefFinder for postmortem interval (A~G) and integrated conditions (H). Genes are ranked from the least stable (left) to the most stable (right).
geNorm의 pairwise variation 분석 (Vn/Vn+1)을 통해 다중 reference 유전자의 최적 수를 도출하였다 (Fig. 7). 모든 조건에서 Vn/Vn+1 값이 0.2 미만으로 나타나 (Xiong et al., 2021), 제안된 다중 reference 유전자 조합이 타겟 유전자 정량에 적합함을 확인하였다.
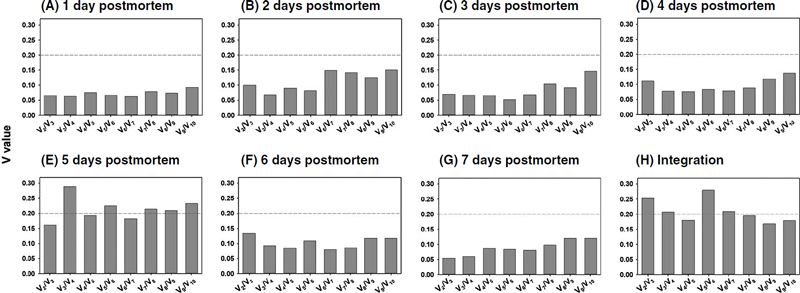
Pairwise variation (Vn/Vn+1) analysis for determining the optimal number of reference genes in nurse bees across different postmortem intervals Vn/Vn+1 values were calculated using geNorm to assess the necessity of adding additional reference genes for normalization at each postmortem interval (A~G) and under integrated conditions (H). Values are arranged from lowest (left) to highest (right). The red dashed line indicates the commonly used cut-off value of 0.2 for acceptable variation.
사후 경과일별 분석 결과, 사후 1일 (V6/V7=0.06)과 6일 (V6/V7=0.08) 조건에서 6개의 유전자가 다중 reference 유전자의 최적 수로 선정되었고 (Fig. 7A, F), 사후 2, 3, 4일 조건에서는 각각 3개 (V3/V4=0.07), 5개 (V5/V6=0.05), 4개 (V4/V5=0.08)의 사용이 권장되었다 (Fig. 7B~D). 또한, 사후 5일 (V2/V3=0.16)과 7일 (V2/V3=0.05)에서는 유전자 2개를 사용하는 것이 타겟 유전자 발현량의 정량화에 가장 적합하다고 나타났다 (Fig. 7E, G). 모든 사후 샘플들을 통합하여 Vn/Vn+1를 분석하였을 때, 8개의 reference 유전자를 사용하는 것을 권장하였다 (Fig. 7H).
geNorm pairwise variation 분석 (Vn/Vn+1)에서는 복수의 reference 유전자들을 통한 타겟 유전자의 발현량의 정량화를 제안하나, 실험 설계와 경제적 효율성을 고려한 단일 reference 유전자의 사용 가능성을 평가하였다. 각 조건별로 RefFinder의 분석 결과 (Ranking value)상의 유전자 순서에 근거하여 복수의 유전자를 선택하였고 (Fig. 6), 유전자의 수는 pairwise variation 분석 (Vn/Vn+1)에서 제시하는 reference 유전자의 수를 기준하였다 (Fig. 7). 사후 1일에 6개 (RPS18, GAPDH, RAB1a, PPI, PGK, SDH), 사후 2일에 3개 (GAPDH, PGK, EF1), 사후 3일에 5개 (GAPDH, RAB1a, PPI, PGK, SDH), 사후 4일에 4개 (ARF1, RAB1a, SDH, TBP), 사후 5일에 2개 (ARF1, PPI), 사후 6일에 6개 (RPS5, RPS18, GAPDH, ARF1, PPI, SDH), 사후 7일에 2개 (RAB1a, SDH)의 유전자 조합이 선정되었다. 또한, 통합 분석에서는 RPS5, GAPDH, ARF1, RAB1a, PPI, PGK, SDH, TBP 등 8개 유전자가 사용되었다.
EcR 발현량을 단일 및 다중 reference 유전자를 기반으로 각각 정량한 후 그 차이 (absolute difference)를 분석한 결과 (Fig. 8), 모든 조건에서 absolute difference의 총합이 PPI (sum=0.16~5.44)에서 가장 낮아 두 정량화 방법 간의 EcR 발현 패턴의 유사성이 가장 높았으며, ARF1 (sum=1.30~8.74), RAB1a (sum=1.39~12.29)가 그 뒤를 이었다. 또한, 총 7일간의 사후 샘플에서의 EcR의 발현량을 두 정량법으로 산출한 후 repeated-measures ANOVA로 발현 양상의 유사성을 통계적으로 분석한 결과, PGK (p=0.82)을 제외한 나머지 9개의 단일 reference 유전자들의 p=1.00으로, 각 단일 reference 유전자로 정량한 EcR의 발현량이 다중 reference 유전자를 이용했을 때와 유의미한 차이가 없음을 시사한다 (Fig. 8).
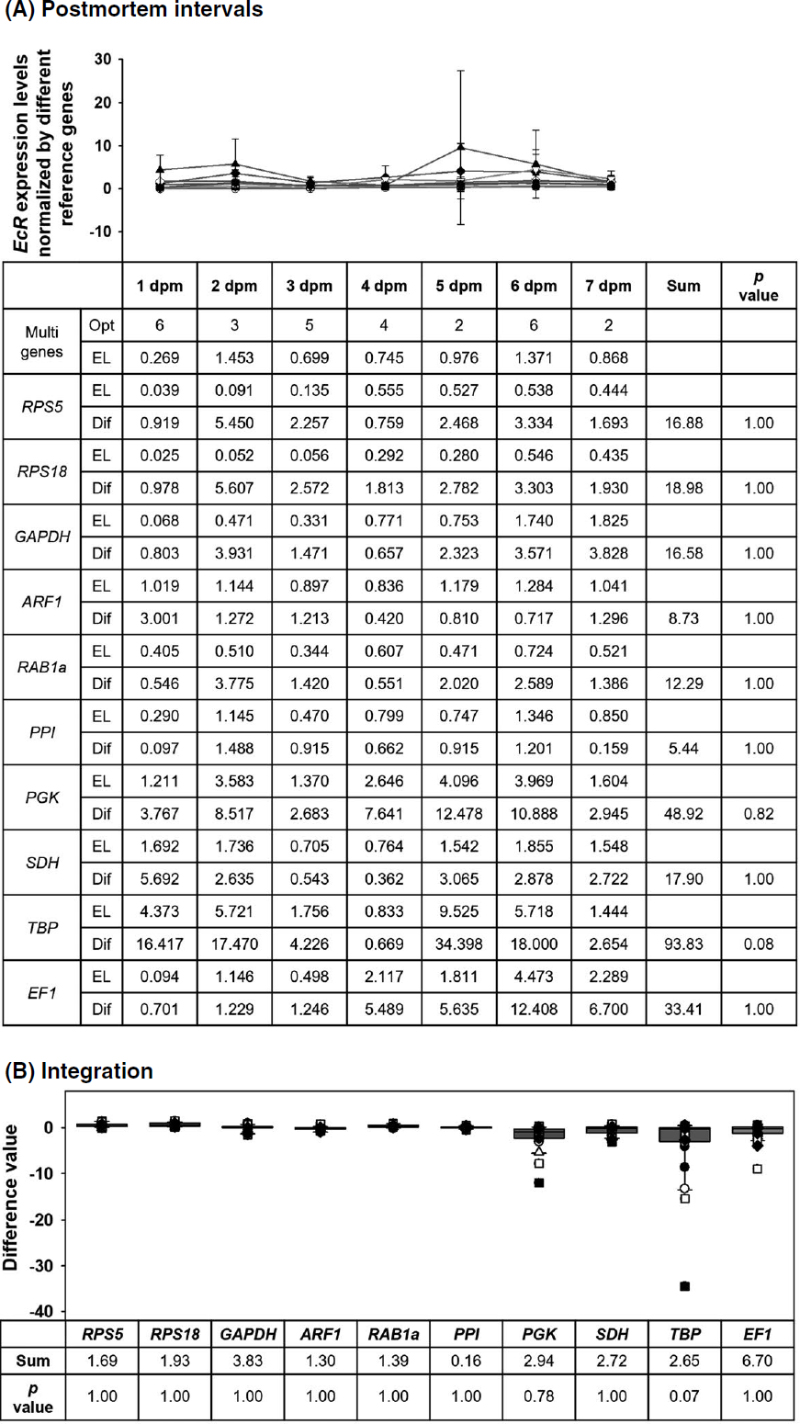
Comparison of EcR expression levels normalized by a single reference gene and an optimal combination of multiple reference genes in nurse bees across different postmortem intervals (A) and integrated conditions (B). The optimal sets of multiple reference genes for each postmortem interval (PMI) were selected based on pairwise variation analysis (Fig. 7) and comprehensive ranking (Fig. 6). At each PMI and under integrated conditions, the absolute differences in EcR expression levels were calculated between single and multiple gene normalization strategies. Statistical similarity between expression patterns was assessed using repeated measures ANOVA. Abbreviations: dpm, day(s) postmortem; Opt, optimal number of multiple reference genes; EL, expression level of the EcR gene normalized by candidate reference gene (s); Dif, absolute difference in EcR expression levels between single and multiple reference gene normalization; Sum, total sum of absolute differences in EcR expression levels.
고 찰
유기체가 사망한 후에도 일정 시간 동안 제한적인 전사 활동이 지속될 수 있음이 보고된 바 있다 (Shafeeq et al., 2020). 이에 따라 사후생리학 분야에서는 사후 유전자 발현 양상을 기반으로 사후 경과일 또는 사망 원인을 추론하고자 하는 시도들이 이루어지고 있다 (Kimura et al., 2011; Cianci et al., 2024). 이러한 관점은 양봉현장에서 빈번하게 보고되는 꿀벌의 집단 폐사 사건의 원인을 규명하는 데 활용될 수 있는 가능성을 제시한다. 다만, 사후 유전자 발현 분석에서 qRT-PCR을 통한 정확한 정량화를 위해서는 실험 조건에 적합하며 사후에도 안정적으로 발현되는 reference 유전자의 선별이 필수적이다. 본 연구에서는 꿀벌 사체의 다양한 사후 조건에서 10종의 후보 reference 유전자 (RPS5, RPS18, GAPDH, ARF1, RAB1a, PPI, PGK, SDH, TBP, EF1)의 발현 안정성을 평가하고자 하였으며, 이를 위해 Cq 분포 분석 및 NormFinder, BestKeeper, geNorm, RefFinder 네 가지 알고리즘을 활용하였다 (Figs. 2~6). 또한, geNorm의 pairwise variation 분석을 통해 제안된 다중 reference 유전자 조합과 단일 reference 유전자를 사용한 정량화 결과 간의 통계적 유사성을 비교함으로써 사후 조건에 적합한 최적의 reference 유전자를 도출하고자 하였다 (Figs. 7, 8).
각 분석 알고리즘은 상이한 통계적 접근법에 기반하여 유전자 발현 안정성을 평가하므로, 서로 다른 결과를 제시할 수 있다 (Ospina and Marmolejo-Ramos, 2019; Vandesompele et al., 2002; Andersen et al., 2004; Pfaffl et al., 2004). 본 연구에서도 Cq 분포 분석 및 NormFinder는 대부분의 후보 유전자들이 머리 조직에서 reference 유전자로 적합함을 제시한 반면 (Figs. 2, 3), BestKeeper 및 geNorm 분석에서는 사후 경과일에 따라 적합한 reference 유전자가 달라지는 결과를 나타냈다 (Figs. 4, 5). 이러한 차이를 보정하기 위해 RefFinder는 네 가지 분석법의 결과를 통합하여 종합적인 안정성 순위를 제공하며, 실제 현장에서는 이를 기반으로 reference 유전자를 최종 선정하는 경우가 많다 (Park et al., 2023; Kim and Kim, 2025).
본 연구에서도 RefFinder의 종합 결과를 중심으로 ARF1, RAB1a, PPI가 일관되게 상위 순위를 차지하였으며 (Fig. 6), 이들 유전자는 모든 분석 기준 (CV<1, SV<0.15, SD<1, M<1)을 만족하였다 (Figs. 2~5). 특히 RAB1a는 RefFinder의 종합 순위에서 1위를 차지하였으며 (Fig. 6H), 다른 세 분석법에서도 공통적으로 상위 2위 안에 포함되어 높은 발현 안정성을 입증하였다 (Figs. 2H, 3H, 4H, 5H). 이에 따라 RAB1a는 사후 조건에서 꿀벌 머리 조직의 유전자 발현 분석에 가장 적합한 reference 유전자로 판단된다.
geNorm의 pairwise variation 분석은 타겟 유전자의 발현 정량을 위해 필요한 reference 유전자의 최적 개수를 제안하며 (Ayers et al., 2007; Hosseini et al., 2010; Xiong et al., 2021), 본 연구에서도 사후 조건에 따라 2개에서 6개까지의 유전자 조합이 제시되었다 (Fig. 7). 그러나 다중 reference 유전자의 사용은 실험 비용 증가 및 조건 간 정량 결과의 비교 어려움 등의 실질적인 한계를 가지므로, 단일 reference 유전자의 활용 가능성을 함께 고려할 필요가 있다 (Vandesompele et al., 2002; Derveaux et al., 2010). 특히, 단일 reference 유전자를 사용한 정량화 결과가 다중 reference 기반 결과와 통계적으로 유의한 차이가 없다면, 실용성과 경제성을 고려해 단일 유전자를 선택하는 것이 바람직하다 (Park et al., 2023; Kim and Kim, 2025). 따라서 본 연구에서는 단일 reference 유전자와 다중 reference 유전자 기반 정량화 결과 간의 유사성을 평가하였다. 그 결과, ARF1, RAB1a, PPI의 absolute difference 총합이 가장 낮았으며, 해당 유전자들을 기반으로 정량된 EcR의 발현 양상은 다중 reference 유전자를 사용한 결과와 통계적으로 유의한 차이를 보이지 않았다 (p=1.00) (Fig. 8). 이는 세 유전자 모두 단일 reference 유전자로 활용 가능함을 시사하며, 그중에서도 RAB1a는 종합 분석에서 가장 안정적인 유전자로 평가되어 최종적으로 선정되었다 (Fig. 6H).
RAB1a는 소포체와 골지체 간 단백질 수송에 관여하는 GTPase 계열 단백질을 암호화하는 유전자로, 꿀벌의 다양한 생리적 조건에서도 안정적으로 발현되는 유전자로 보고된 바 있다 (Kim et al., 2022). 특히, RAB1a는 발달 단계 (알, 유충, 번데기, 내역봉, 외역봉)뿐만 아니라, 살비제 (fluvalinate, coumaphos) 및 살충제 (flupyradifurone, imidacloprid) 노출 조건에서도 reference 유전자로서의 적합성이 확인된 바 있기에 (Kim et al., 2021; Kim et al., 2022), 다양한 조건 하의 꿀벌에서 안정적으로 발현되는 유전자인 것으로 판단된다.
한편, 본 연구에서는 꿀벌 사체의 머리 조직과 복부 조직을 비교하였으며, 복부 조직은 부패에 취약한 장기들이 밀집되어 있어 유전자 발현 분석에 부적합한 것으로 나타났다. 실제로 복부 조직은 더 빠르게 곰팡이가 발생하였고, Cq 값의 표준편차 및 추세선 기울기 분석 결과에서도 발현 안정성이 현저히 낮게 나타났다 (Fig. 1). 이는 꿀벌 복부 내 장기, 특히 꿀주머니 (honey stomach)에 저장된 영양분이 부패균의 증식을 촉진하여 RNA 안정성에 영향을 준 것으로 사료된다 (Guo et al., 2016; Liu et al., 2023). 4가지 프로그램을 통한 복부 조직에서의 유전자들의 안정성 분석에서도 일부 시료에서 후보 유전자들의 발현이 불안정하였으며, pairwise variation 분석 결과 다중 reference 유전자의 수가 결정되지 않는 등 분석에 제약이 존재하였다 (data not shown). 따라서 꿀벌 사체에서 유전자 발현 분석 시에는 복부 조직보다 머리 조직을 사용하는 것이 바람직하다.
결론적으로, 본 연구에서는 꿀벌 사체에서 사후 1일부터 7일까지의 기간 동안 다양한 후보 reference 유전자들의 발현 안정성을 분석하고, 단일 및 다중 reference 유전자 기반 정량화 결과를 비교함으로써 타겟 유전자의 정량에 적합한 reference 유전자를 제안하였다. 그 결과, 머리 조직에서 RAB1a가 가장 안정적으로 발현하는 reference 유전자로 확인되었으며, 이는 사후 조건에서 꿀벌의 생리적 변화를 분자생물학적으로 규명하고자 할 때 유용한 유전자로 활용될 수 있을 것으로 기대된다.
적 요
서양꿀벌 (Apis mellifera)은 생태계의 안정성과 농업 생산성 유지에 중요한 역할을 하는 수분 매개 곤충으로, 최근 국내외에서 꿀벌 군집의 집단 폐사가 빈번히 보고되고 있다. 이러한 현상은 꿀벌 사체를 이용한 분자생물학적 분석을 통해 사망 원인을 규명할 수 있는 가능성을 제시하며, 이를 위해서는 사후 조건에서도 안정적으로 발현되는 기준 (reference) 유전자의 선별이 필수적이다. 본 연구에서는 사후 1일부터 7일까지 다양한 사후 경과일 (postmortem interval, PMI)을 갖는 꿀벌 사체로부터 10종의 후보 reference 유전자 (RPS5, RPS18, GAPDH, ARF1, RAB1a, PPI, PGK, SDH, TBP, EF1)의 발현 안정성을 평가하였다. 이를 위해 머리 조직의 Cq 값 분포 분석과 함께 NormFinder, BestKeeper, geNorm, RefFinder 네 가지 알고리즘을 활용하였다. 또한, 다중 reference 유전자를 기반으로 정량화한 타겟 유전자 EcR의 발현량과 단일 reference 유전자를 이용한 결과 간의 통계적 유사성을 비교함으로써 최적의 reference 유전자를 선별하였다. 분석 결과, RAB1a는 모든 평가 지표에서 우수한 발현 안정성을 보였으며, 다중 reference 유전자를 활용한 정량화 결과와의 유사성 또한 가장 높아, 꿀벌 사체에서 타겟 유전자의 발현량을 정량화하는 데 적합한 단일 reference 유전자로 판단되었다. 또한 복부 조직은 부패와 오염에 취약하여 유전자 발현 분석에 부적합한 것으로 나타났으며, 꿀벌의 머리 조직을 활용한 분석이 보다 신뢰성 있는 결과를 제공함을 확인하였다. 본 연구는 꿀벌 사체에서의 유전자 발현 분석 기반 사후 생리학 연구에 기초자료를 제공하며, 꿀벌 집단 폐사의 원인 규명 및 사후 경과일 추정 연구에 활용될 수 있을 것으로 기대된다.
Acknowledgments
본 연구는 농촌진흥청 연구과제 ‘인공지능 기반 꿀벌병해충 발생 예측 기술 개발 (RS-2025-02303308)’의 지원으로 수행되었습니다. 본 논문은 김희진의 석사 학위 논문에 기반하여 작성되었습니다.
References
-
Andersen, C. L., J. L. Jensen and T. F. Ørntoft. 2004. Normalization of real-time quantitative reverse transcription-PCR data: a model-based variance estimation approach to identify genes suited for normalization, applied to bladder and colon cancer data sets. Cancer Res. 64: 5245-5250.
[https://doi.org/10.1158/0008-5472.CAN-04-0496]

-
Ayers, D., D. N. Clements, F. Salway and P. J. Day. 2007. Expression stability of commonly used reference genes in canine articular connective tissues. BMC Vet. Res. 3: 1-10.
[https://doi.org/10.1186/1746-6148-3-7]
-
Bruckner, S., M. Wilson, D. Aurell, K. Rennich, D. Vanengelsdorp, N. Steinhauer and G. R. Williams. 2023. A national survey of managed honey bee colony losses in the USA: results from the Bee Informed Partnership for 2017-18, 2018-19, and 2019-20. J. Apic. Res. 62: 429-443.
[https://doi.org/10.1080/00218839.2022.2158586]
-
Butolo, N., P. Azevedo, L. Alencar, O. Malaspina and R. Nocelli. 2021. Impact of low temperatures on the immune system of honeybees. J. Therm. Biol. 101: 103082.
[https://doi.org/10.1016/j.jtherbio.2021.103082]
- Chai, H.-H., Y. J. Noh, H.-J. Roh and D. Lim. 2020. Importance of Selecting The characterized Housekeeping Genes as Reference Genes in Various Species. JKAIS 21: 417-428.
-
Cianci, V., C. Mondello, D. Sapienza, M. C. Guerrera, A. Cianci, A. Cracò, F. Omero, V. Gioffrè, P. Gualniera and A. Asmundo. 2024. Potential Role of mRNA in Estimating Postmortem Interval: A Systematic Review. Int. J. Mol. Sci. 25: 8185.
[https://doi.org/10.3390/ijms25158185]
-
Dainat, B., J. D. Evans, Y. P. Chen, L. Gauthier and P. Neumann. 2012. Predictive markers of honey bee colony collapse. PLoS One. 7: e32151.
[https://doi.org/10.1371/journal.pone.0032151]
-
Derveaux, S., J. Vandesompele and J. Hellemans. 2010. How to do successful gene expression analysis using real-time PCR. Methods 50: 227-230.
[https://doi.org/10.1016/j.ymeth.2009.11.001]
-
Franz, H., C. Ullmann, A. Becker, M. Ryan, S. Bahn, T. Arendt, M. Simon, S. Pääbo and P. Khaitovich. 2005. Systematic analysis of gene expression in human brains before and after death. Genome Biol. 6: 1-9.
[https://doi.org/10.1186/gb-2005-6-13-r112]
-
Freitas, F. C., T. S. Depintor, L. T. Agostini, D. Luna-Lucena, F. M. Nunes, M. M. Bitondi, Z. L. Simões and A. P. Lourenço. 2019. Evaluation of reference genes for gene expression analysis by real-time quantitative PCR (qPCR) in three stingless bee species (Hymenoptera: Apidae: Meliponini). Sci. Rep. 9: 17692.
[https://doi.org/10.1038/s41598-019-53544-0]
-
González-Herrera, L., A. Valenzuela, J. A. Marchal, J. A. Lorente and E. Villanueva. 2013. Studies on RNA integrity and gene expression in human myocardial tissue, pericardial fluid and blood, and its postmortem stability. Forensic Sci. Int. 232: 218-228.
[https://doi.org/10.1016/j.forsciint.2013.08.001]
-
Gray, A., N. Adjlane, A. Arab, A. Ballis, V. Brusbardis, A. Bugeja Douglas, L. Cadahía, J. D. Charrière, R. Chlebo and M. F. Coffey. 2023. Honey bee colony loss rates in 37 countries using the COLOSS survey for winter 2019-2020: the combined effects of operation size, migration and queen replacement. J. Apic. Res. 62: 204-210.
[https://doi.org/10.1080/00218839.2022.2113329]
-
Guo, J., X. Fu, H. Liao, Z. Hu, L. Long, W. Yan, Y. Ding, L. Zha, Y. Guo and J. Yan. 2016. Potential use of bacterial community succession for estimating post-mortem interval as revealed by high-throughput sequencing. Sci. Rep. 6: 24197.
[https://doi.org/10.1038/srep24197]
-
Hellemans, J., G. Mortier, A. De Paepe, F. Speleman and J. Vandesompele. 2007. qBase relative quantification framework and software for management and automated analysis of real-time quantitative PCR data. Genome Biol. 8: 1-14.
[https://doi.org/10.1186/gb-2007-8-2-r19]
-
Hosseini, A., H. Sauerwein and M. Mielenz. 2010. Putative reference genes for gene expression studies in propionate and β-hydroxybutyrate treated bovine adipose tissue explants. J. Anim. Physiol. Anim. Nutr. (Berl) 94: e178-e184.
[https://doi.org/10.1111/j.1439-0396.2010.01002.x]
-
Jeon, J. H., K. Moon, Y. Kim and Y. H. Kim. 2020. Reference gene selection for qRT-PCR analysis of season- and tissue-specific gene expression profiles in the honey bee Apis mellifera. Sci. Rep. 10: 13935.
[https://doi.org/10.1038/s41598-020-70965-4]
-
Johnson, B. R. 2010. Division of labor in honeybees: form, function, and proximate mechanisms. Behav. Ecol. Sociobiol. 64: 305-316.
[https://doi.org/10.1007/s00265-009-0874-7]
-
Johnson, R. M., H. S. Pollock and M. R. Berenbaum. 2009. Synergistic interactions between in-hive miticides in Apis mellifera. J. Econ. Entomol. 102: 474-479.
[https://doi.org/10.1603/029.102.0202]
-
Julian, G. S., R. W. d. Oliveira, S. Tufik and J. R. Chagas. 2016. Analysis of the stability of housekeeping gene expression in the left cardiac ventricle of rats submitted to chronic intermittent hypoxia. J. Bras. Pneumol. 42: 211-214.
[https://doi.org/10.1590/S1806-37562015000000133]
- Jung, C. 2008. Economic Value of Honeybee Pollination on Major Fruit and Vegetable Crops in Korea. J. Apic. 23: 147-152.
-
Kim, H.-K. 2022. The Effect of Honey Bee Mites on the Winter Colony Loss. J. Apic. 37: 291-299.
[https://doi.org/10.17519/apiculture.2022.09.37.3.291]
-
Kim, H. and Y. H. Kim. 2025. Evaluation of Reference Genes for Quantitative Real-Time PCR in Honey Bee, Apis mellifera, Under Various Miticide Exposure Conditions. Entomol. Res. 55: e70026.
[https://doi.org/10.1111/1748-5967.70026]
-
Kim, S., S. Cho and S. H. Lee. 2022. Selection of stable reference genes for real-time quantitative PCR in honey bee pesticide toxicity studies. J. Apic. Res. 61: 26-36.
[https://doi.org/10.1080/00218839.2021.1950972]
-
Kim, Y., H. Kim and Y. H. Kim. 2021. Evaluation of quantitative real-time PCR reference genes for the investigation of gene expression profiles in honeybee developmental stages. J. Apic. 36: 251-259.
[https://doi.org/10.17519/apiculture.2021.11.36.4.251]
-
Kim, Y., J. Cha, H. Kim, S. H. Lee and Y. H. Kim. 2023. Validation of reference genes for quantitative real-time polymerase chain reaction assay of honeybee under various pesticide treatment conditions. Entomol. Res. 53: 82-92.
[https://doi.org/10.1111/1748-5967.12634]
-
Kim, Y. and Y. H. Kim. 2023. Selection of Reference Gene for qRT-PCR in Honey Bee Exposed to Various Condition of Pesticides. J. Apic. 38: 41-51.
[https://doi.org/10.17519/apiculture.2023.04.38.1.41]
-
Kimura, A., Y. Ishida, T. Hayashi, M. Nosaka and T. Kondo. 2011. Estimating time of death based on the biological clock. Int. J. Legal Med. 125: 385-391.
[https://doi.org/10.1007/s00414-010-0527-4]
-
Koppelkamm, A., B. Vennemann, T. Fracasso, S. Lutz-Bonengel, U. Schmidt and M. Heinrich. 2010. Validation of adequate endogenous reference genes for the normalisation of qPCR gene expression data in human post mortem tissue. Int. J. Legal Med. 124: 371-380.
[https://doi.org/10.1007/s00414-010-0433-9]
-
Lee, S.-J., S.-H. Kim, J. Lee, J.-H. Kang, S.-M. Lee, H. J. Park, J. Nam and C. Jung. 2022. Impact of Ambient Temperature Variability on the Overwintering Failure of Honeybees in South Kore. J. Apic. 37: 331-347.
[https://doi.org/10.17519/apiculture.2022.09.37.3.331]
-
Liapi, E., M. Rothschild, P. Schneider and I. Gomes. 2015. Effect of RNA integrity on reference gene expression stability in human post-mortem wounded and normal skin. Forensic Sci. Int. Genet. Suppl. Ser. 5: e186-e188.
[https://doi.org/10.1016/j.fsigss.2015.09.075]
-
Liu, R., K. Zhang, H. Li, Q. Sun, X. Wei, H. Li, S. Zhang, S. Fan and Z. Wang. 2023. Dissecting the microbial community structure of internal organs during the early postmortem period in a murine corpse model. BMC Microbiol. 23: 38.
[https://doi.org/10.1186/s12866-023-02786-0]
- Martins, D., I. Gordon, M. Mayfield, Vasuki V. Belavadi and H. Nadel. 2008. Initial survey of good pollination practices. https://www.fao.org/fileadmin/templates/agphome/documents/Biodiversity-pollination/SURVEY_DEC_08_Small.pdf, .
-
McMillan, M. and L. Pereg. 2014. Evaluation of reference genes for gene expression analysis using quantitative RT-PCR in Azospirillum brasilense. PLoS One 9: e98162.
[https://doi.org/10.1371/journal.pone.0098162]
-
Ospina, R. and F. Marmolejo-Ramos. 2019. Performance of some estimators of relative variability. Front. Appl. Math. Stat. 5: 43.
[https://doi.org/10.3389/fams.2019.00043]
-
Park, Y. E., Y. Kim, G. Goh, S. H. Lee, K. S. Choi and Y. H. Kim. 2023. Reference gene selection for normalizing gene expression using quantitative real-time PCR in Haemaphysalis longicornis. Entomol. Res. 53: 29-41.
[https://doi.org/10.1111/1748-5967.12630]
-
Perry, C. J., E. Søvik, M. R. Myerscough and A. B. Barron. 2015. Rapid behavioral maturation accelerates failure of stressed honey bee colonies. Proc. Natl. Acad. Sci. 112: 3427-3432.
[https://doi.org/10.1073/pnas.1422089112]
-
Pfaffl, M. W., A. Tichopad, C. Prgomet and T. P. Neuvians. 2004. Determination of stable housekeeping genes, differentially regulated target genes and sample integrity: BestKeeper-Excel-based tool using pair-wise correlations. Biotechnol. Lett. 26: 509-515.
[https://doi.org/10.1023/B:BILE.0000019559.84305.47]
-
Pozhitkov, A. E., R. Neme, T. Domazet-Lošo, B. G. Leroux, S. Soni, D. Tautz and P. A. Noble. 2017. Tracing the dynamics of gene transcripts after organismal death. Open Biol. 7: 160267.
[https://doi.org/10.1098/rsob.160267]
-
Shafeeq, T., A. Malik, A. Zaheer and K.-Y. Lee. 2020. Differentiated transcriptional regulation before and after death in Indianmeal moth Plodia interpunctella. J. Asia. Pac. Entomol. 23: 1096-1100.
[https://doi.org/10.1016/j.aspen.2020.09.009]
-
Tolbert, M., S. J. Finley, S. D. Visonà, S. Soni, A. Osculati and G. T. Javan. 2018. The thanatotranscriptome: gene expression of male reproductive organs after death. Gene 675: 191-196.
[https://doi.org/10.1016/j.gene.2018.06.090]
-
Vandesompele, J., K. De Preter, F. Pattyn, B. Poppe, N. Van Roy, A. De Paepe and F. Speleman. 2002. Accurate normalization of real-time quantitative RT-PCR data by geometric averaging of multiple internal control genes. Genome Biol. 3: 1-12.
[https://doi.org/10.1186/gb-2002-3-7-research0034]
- VanEngelsdorp, D., D. C. Foster, M. Frazier, N. Ostiguy and J. Hayes. 2007. “Fall-dwindle Disease”: Investigations Into the Causes of Sudden and Alarming Colony Losses Experience by Beekeepers in the Fall of 2006.
-
Xie, F., J. Wang and B. Zhang. 2023. RefFinder: a web-based tool for comprehensively analyzing and identifying reference genes. Funct. Integr. Genomics 23: 125.
[https://doi.org/10.1007/s10142-023-01055-7]
-
Xiong, F., X. Cheng, C. Zhang, R. M. Klar and T. He. 2021. Optimizations for identifying reference genes in bone and cartilage bioengineering. BMC Biotechnol. 21: 1-15.
[https://doi.org/10.1186/s12896-021-00685-8]
-
Xue, Y., R. Zhao, S.-H. Du, D. Zhao, D.-R. Li, J.-T. Xu, X.-L. Xie and Q. Wang. 2016. Decreased mRNA levels of cardiac Cx43 and ZO1 in sudden cardiac death related to coronary atherosclerosis: a pilot study. Int. J. Legal Med. 130: 915-922.
[https://doi.org/10.1007/s00414-016-1353-0]
-
Yang, L.-Y., D.-R. Tang, S.-Q. Luo, W.-W. Li, Y.-H. Jiang, L.-B. Lin and Q.-L. Zhang. 2024. Time-dependent changes in genome-wide gene expression and post-transcriptional regulation across the post-death process in silkworm. DNA Res. 31: dsae031.
[https://doi.org/10.1093/dnares/dsae031]
-
You, E., J. Cha, H. Kim and Y. H. Kim. 2025. Comparison of the toxicity and potential ecological risks of various pesticides for nurses of honey bee (Apis mellifera. L). J. Environ. Chem. Ecotoxicol.
[https://doi.org/10.1016/j.enceco.2025.04.008]
-
Zaobidna, E. A., K. Żółtowska and E. Łopieńska-Biernat. 2017. Varroa destructor induces changes in the expression of immunity-related genes during the development of Apis mellifera worker and drone broods. Acta Parasitol. 62: 779-789.
[https://doi.org/10.1515/ap-2017-0094]