Development of in-field-diagnosis of Aspergillus flavus by Loop-Mediated Isothermal Amplification in Honeybee
Abstract
Stonebrood and Chalkbrood are major fungal diseases in honeybee (Apis mellifera), caused by Aspergillus flavus, or by Ascosphaera apis, respectively. Because of similar shapes and symptoms of infected larvae by them, it could be hard to distinguish between both without gene analysis. In this study, we developed a Loop-mediated isothermal amplification (LAMP) method for the specific detection of A. flavus in honeybee. Optimal conditions for A. flavus-specific LAMP were sequentially established using the specific primer sets, RT-A. flavus-F3/ B3/ FIP1 /BIP2. The existence of A. flavus among genomic DNA from honeybee was detected by A. flavus-specific LAMP within 27 minutes, and the detection limit was estimated 105 DNA molecules of target DNA. Specific amplification of A. flavus-specific LAMP can be recognized with colorimetric dyes by naked eyes. It makes easy screening and time-saving to identify A. flavus-infection in field tests. This assay would be useful not only for A. flavus detection in honeybee in laboratory, but also could be applied in apiary field.
Keywords:
Apis mellifera, Stonebrood, Aspergillus flavus, LAMP, DetectionINTRODUCTION
Stonebrood has been considered to be a pathogen of low virulence in honeybee colonies and there was very little information about the Stonebrood and honeybee hostparasite (Shoreit and Bagy, 1995). In stonebrood, dead bodies of larvae, mainly caused by fungus Aspergillus flavus, were change to hard, like stone, and colors of bodies were also change to white, black, even gray from milky. However, symptoms of chalkbrood, caused by Ascosphaera apis, are very similar to the cases of stonebrood, such as hard, black or white bodies. With naked eyes, it is not clear to identify both, stonebrood and chalkbrood, based on symptoms of disease, which pathogens these infections with naked eyes. In Korea, Chalkbrood and Stonebrood made incorrect detection reports by beekeepers. (Lee et al., 2004). In 2013 and 2014, according to the Korea Center for honeybee disease control, Stonebrood showed 17.45% and 37.05% infection rate in honeybees (Yoo et al., 2014, 2015). Thus, the development of sensitive and quantitative detection system is available in field and it should be meaningful in hive management.
Loop-mediated isothermal amplification (LAMP) is a novel nucleic acid amplification method which is characterized as high specificity, sensitivity, and rapidity under isothermal conditions, and it employs self-recurring strand displacement synthesis primed by a specially designed set of target-specific primers (Notomi et al., 2000). The LAMP method is designed based on main features. Firstly, all reactions are carried out under isothermal conditions. Compared to conventional PCR and Real-Time PCR assays, expensive equipment is not necessary to obtain a high level of precision, and we can save the time in preparation steps (Ushikubo, 2004). Secondly, the amplification efficiency is extremely high, each reaction can produce expectable amount of amplification products (Yamazaki et al., 2008). Thirdly, the reaction is high specificity (Yamazaki et al., 2009).
In this study, we supplemented the quantitative possibility using the fluorescent dye (SYBR Green I) and fluorescent detector system (ExicyclerTM‚ 96, Bioneer, Korea). Using this material, we could detect successfully A. flavus by real time LAMP assay in a manner of general PCR detection method in the laboratory. In this way, we confirmed that quantitative LAMP assay is fast to monitor A. flavus natural infection in Apis mellifera.
MATERIALS AND METHODS
Collection of honeybee sample and Genomic DNA extraction
Honeybee samples were collected in Korea in 2013. The samples of honeybees infected by A. flavus were detected by Korea Honey Bee Disease Institute using molecular detection method. The sample of 50mg honeybees was homogenized in 200μl of lysis buffer supplemented with 20μl of proteinase K according to the manufacturer’s instructions using a Genomic DNA extraction kit (Bioneer, Korea). The mixture was incubated for 1 hour at 60°C. Finally, the concentration of total DNA was determined using a Biophotometer (Eppendorf, Germany) before applying for the LAMP reaction.
Primer design for LAMP
LAMP primers were designed based on the deposited sequence of A. flavus in GenBank (Accession No. D63696) using the Primer Explorer version 4 soft-ware program (http://primerexplorer.jp/elamp4.0.0/index.html). Details of these primers are shown in Table 1. The primers were synthesized by Bionics, Korea.
Optimization of LAMP reaction
To determine the optimal condition for the A. flavus-LAMP amplification reaction, the LAMP reaction was performed using 107 DNA molecules of pBX-A. flavus clone (Lee et al., 2015). The normal LAMP reaction was performed in 50μl total volume containing 10 pmole each of F3 and B3, 40 pmole each of FIP and BIP, 2.5mM dNTPs, 5% DMSO, 8 units of Bst DNA polymerase large fragment (NEB, UK), 1X ThermoPol Reaction Buffer (20mM Tris-HCl, 10mM KCl, 10mM (NH4)2SO4, 2mM MgSO4, 0.1% Triton X-100), and 1.0μl of template DNA (107 DNA molecules of pBX-A. flavus clone. The mixture was incubated at 59°C for 60 minutes and the reaction was terminated by heating to 80°C for 10 minutes. To optimize the LAMP reaction, different reaction temperatures were carried out from 45°C to 65°C for 60 minutes in a thermocycler, dNTP concentrations ranging from 2.5mM to 10mM and the inner primer concentrations ranged from 20 pmole to 100 pmole and outer primer concentrations ranged from 5 pmole to 25 pmole were examined. After LAMP reaction, the amplicons were confirmed by agarose gel electrophoresis.
Detection time in a relationship with quantitative A. flavus real-time LAMP reaction
To determine the A. flavus-LAMP reaction time according to the DNA molecules for A. flavus specific sequence, the real time LAMP was carried out using 10- fold serial dilution of each pBX-A. flavus. This reaction composition was added with the SYBR Green I before performing the thermal cycle. One cycle is set to one minute, and reactions were incubated at 57°C for 70 minutes and 85°C for 10 minutes. After the LAMP reaction, the results were confirmed by electrophoresis analysis. The linear relationship between quantities of initial template and Ct value was performed as a standard curve for quantitative A. flavus LAMP.
Detection of LAMP products by fluorescent dyes
LAMP amplicons in the reaction tube were directly visualized through the addition of 1X SYBR Green I, Gene FinderTM‚ and penol RedTM‚ (Sigma, USA) to the tube and the observation of solution color under UV light or visible light with naked eyes (Yoo et al., 2012).
RESULT
Optimization of LAMP reaction
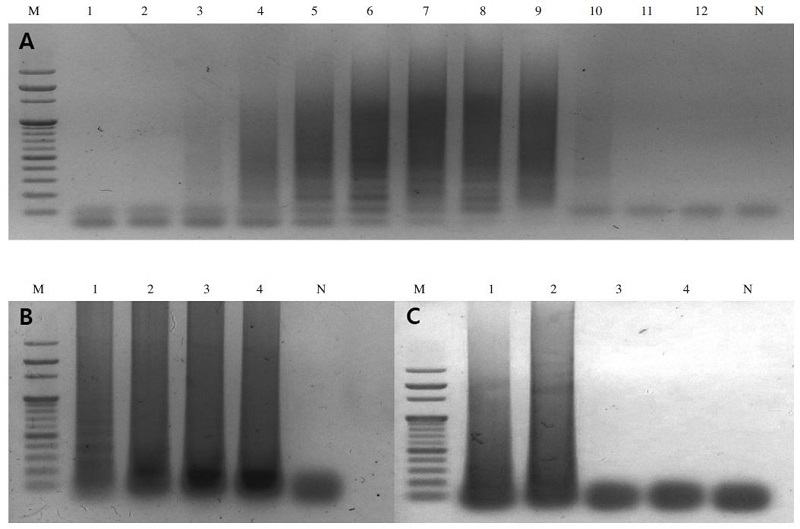
To determine the optimal temperature for the A. flavus-LAMP amplification reaction, the LAMP reaction was performed using pBX-A. flavus clone (107 DNA molecules) as a template and carried out from 45°C to 65°C for 60 minutes in a thermocycler. The amplicons of the LAMP reaction with pBX-A. flavus were formed at all temperatures, with the clearest product appearing at 57°C (Fig. 1A).

Optimization of A. flavus-LAMP reaction. Panel A is a gradient temperature for A. flavus-LAMP reaction. Lane M is 1kb DNA marker (Bio Basic, Canada). Lane 1 to 12 are LAMP carried out at 45.0°C, 45.5°C, 46.7°C, 48.2°C, 50.2°C, 53.4°C, 56.7°C, 59.6°C, 61.8°C, 63.4°C, 64.6°C and 65.0°C, respectively. Lane N is a negative control without template. Panel B is the effect of dNTPs concentrations on LAMP reaction. Lane 1 to 4 are 2.5mM, 5mM, 7.5mM and 10mM dNTPs concentration, respectively. Lane N is a negative control without template. Panel C is optimal concentration of primer sets in LAMP reaction. The optimal concentration of primer mixture was determined at 40pmole FIP/BIP primer and 10pmole F3/B3 primer. Lane M is 1kb DNA marker (Bio Basic, Canada). Lane 1 to 4 are 20 pmole FIP/BIP primer and 5pmole F3/B3 primer, 40 pmole FIP/BIP primer and 10 pmole F3/B3 primer, 80 pmole FIP/BIP primer and 20 pmole F3/B3 primer, 160 pmole FIP/BIP primer and 40pmole F3/B3 primer, respectively. Lane N is a negative control without template DNA.
To optimize dNTPs concentration of A. flavus-LAMP amplification, the LAMP reaction was carried out with dNTPs concentrations ranging from 2.5mM to 10mM. The LAMP products were successfully formed as a characteristic ladder of triple bands from 2.5mM to 5mM, however the reaction did not work effectively with the concentration of dNTPs below 5mM. Thus, 5mM of dNTPs seemed to be the optimal concentration (Fig. 1B).
Finally, the determination of optimal primer concentration was performed using several primer mixtures ranging from inner primer concentrations ranging from 20 pmole to 160 pmole and outer primer concentrations ranging from 5 pmole to 40 pmole were tested. The pBX-A. flavus clone of 107 DNA molecules was used as a template for the reaction. LAMP products were identical using all primer mixtures from inner primer concentrations of 20 pmole to 160 pmole and from outer primer concentrations of 5 pmole to 25 pmole (Fig. 1C). Therefore, the optimal primer mixture for the LAMP reaction was determined to be 40 pmole inner primers and 10 pmole outer primers.
Specificity of A. flavus-LAMP reaction
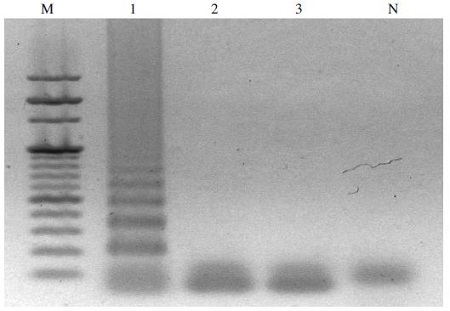
To assess the specificity of the LAMP assay on different pathogens, LAMP reactions with specific A. flavus-LAMP primer sets were performed using genomic DNA of several pathogens: A. flavus, A. apis, and Nosema Ceranae, as templates. All the LAMP products were analyzed by agarose gel electrophoresis. LAMP primer sets amplified specifically the LAMP products only in genomic DNA of A. flavus, whereas no amplification of LAMP products occurred using genomic DNA of A. apis and Nosema Ceranae (Fig. 2).

Specificity of A. flavus-LAMP assay. Each genomic DNA containing different pathogens, including A. flavus, A. apis and Nosema Ceranae. LAMP reaction was performed in a total 50μl volume containing 10 pmole each of F3 and B3, 40 pmole each of FIP and BIP, 5.0mM dNTPs, 8 units of Bst DNA polymerase large fragment, 1X ThermoPol Reaction. Lane M is 1Kb DNA ladder Marker (Bio Basic, Canada). Lane 1 is LAMP product using genomic DNA for A. flavus. Lane 2 is LAMP product using genomic DNA for A. apis. Lane 3 is LAMP product using genomic DNA for Nosema Ceranae. Lane N is a negative control (LAMP without genomic DNA).
Determination of sensitivity and reaction timefor A. flavus-LAMP reaction
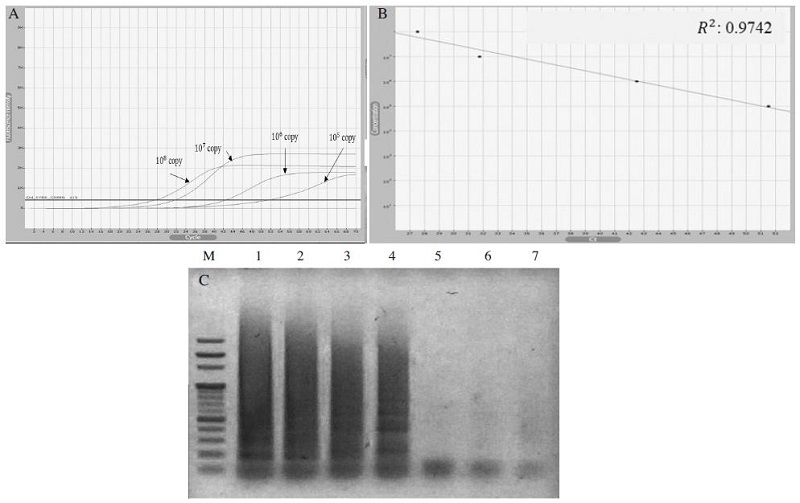
To determine the minimum reaction time of A. flavus-LAMP, it was carried out based on fluorescent measurement. Under the optimal condition, 108 to 102 DNA molecules of A. flavus were used as templates for the quantitative LAMP reaction. The results were analyzed based on the relationship between Ct value and detection time. Using this specific A. flavus-LAMP primer set, 108 DNA molecules were available to be detected within 27 minutes and the limit detection was evaluated as 105 DNA molecules for 51 minutes. In this reaction, the molecular detection limit was lower than general PCR, but the amplification time was faster. The comparison of this A. flavus-LAMP method with the previous report (Lee et al., 2015) showed that the molecular detection limit was very similar, but the detection time was reduced remarkably within 27minutes (Fig. 3).

A. flavus-specific LAMP was performed under range of 108 to 102 DNA molecules. LAMP reaction was performed in a total volume of 50μl containing 10 pmole each of F3 and B3, 40 pmole each of FIP and BIP, 5mM of dNTPs, 8 units of Bst DNA polymerase large fragment (NEB, UK), 1X ThermoPol Reaction Buffer (20mM Tris-HCl, 10mM KCl, 10mM (NH4)2SO4, 2mM MgSO4, 0.1% Triton X-100) and 1.0μl of template DNA. Panel A expresses the relationship between the detection time and DNA molecules. Within 27 minutes, 108 DNA molecule could be amplified. Panel B shows the standard curve of the quantitative A. flavus-LAMP. Panel C is an image of A. flavus-LAMP presented on 1.5% agarose gel. Lane M is 1 Kb ladder (Enzynomics, Korea). Lane 1 to 6 are A. flavus-LAMP results carried out from 108 to 103 DNA molecules, respectively. Lane 7 is a negative control without template. There was no amplification in case of the DNA molecules below 105.
Detection of LAMP products using fluorescent dye
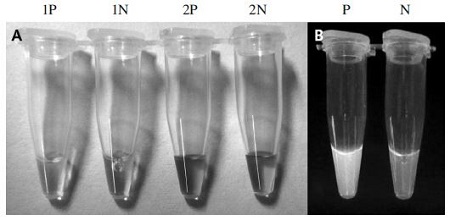
According to the color changing, the tube containing LAMP products amplified from A. flavus genomic DNA turned to green (in case of SYBR Green I), yellow (in case of Gene finderTM) and pink (in case of Phenol Red). Otherwise, the colors which were mentioned could not be found in the reaction tubes and indicated the negative results (Fig. 4). These results were exactly confirmed by loading the LAMP products on 1.5% agarose gel (Data not shown).

Colorimetric test of A. flavus-LAMP products. After the reaction, SYBR Green I, Gene finderTM and Phenol Red were mixed with the LAMP products and observed under an ultraviolet Transilluminator (SYBR Green I) and visible light (Gene finderTM‚ and Phenol Red). Panel A shows the result using Gene finderrTM and Phenol red. The positive results (1P & 2P) presented yellow (Gene finderTM) and pink colors (Phenol red). Conversely, negative results (1N & 2N) showed orange (Gene finderTM) and red colors (Phenol red). Panel B is in case of using SYBR Green I, the green color of fluoresence is existed in the positive tube (P) and disappeared in the negative tube (N).
DISCUSSION
The genus Aspergillus comprises of over 250 species, of which 40 are known to be opportunistic pathogens (Varga and Samson, 2008). The identification of Aspergillus species based on microscopic and macromorphology standard were used for a few years ago (Samson et al., 2014). However, the accuracy of these methods might be concerning because they showed the low detection possibility in case of slow sporulation or in the presence of closely related Aspergillus species. Moreover, these methods are time-consuming and required the strict manipulation (Hong et al., 2005). According to this requirement, LAMP method has been developed and should become the fast and sensitive detection method to differentiate Aspergillus species.
In this study, the real time LAMP diagnostic protocol was carried out for the detection of fungal diseases caused by A. flavus in honeybees. We designed two specific primer sets consisted of outer and inner primers and could amplify 18S gene sequences of A. flavus. This A. flavus-LAMP was exactly estimated the number of copy DNA which can be detected by 10-fold serially diluted genomic DNA. More interestingly, the detection time depended on the DNA molecule was identified as 27 minutes corresponding to 108 DNA molecules. Although the limit detection seemed to be lower than the conventional PCR (not below 105 DNA molecules) but the specificity test showed the expected results with no amplification toward A. apis and Nosema ceranae. Finally, colorimetric reaction gave the advantages for easy observation between the reaction tubes which contained DNA templates of A. flavus or not. By using universal dyes (SYBR Green I, Gene finderTM‚ and Phenol red), the LAMP-A. flavus amplified products should be visualized under UV light or by naked eyes in the clear color changing.
The LAMP method gained the advantages for faster, more specific and cost-saving than usual PCR. Thus, the development of new fluorescent detector system in a small scale might be essential and useful for honeybee quantitative fungal detection in the field.
Acknowledgments
This work was supported by Kyonggi University Research Grant 2013.
References
-
Hong, S.B., S.J. Go, H.D. Shin, J.C. Frisvad, and R.A. Samson, (2005), Polyphasic taxonomy of Aspergillus fumigatus and related species, Mycologia, 97(6), p1316-1329.
[https://doi.org/10.3852/mycologia.97.6.1316]

- Lee, H.M., S.H. Nam, J.S. Ha, Y.H. Jo, and B.S. Yoon, (2004), PCR Detection Method of Ascosphera apis, Aspergillus flavus for Rapid Identification of Fungal Disease in Honeybee, Korean Journal of Apiculture, 19, p139-148.
-
Lee, J.S., S.J. Yong, H.Y. Lim, and B.S. Yoon, (2015), A Simple and Sensitive Gene-Based Diagnosis of Aspergillus flavus by Loop-Mediated Isothermal Amplification in Honeybee, Journal of Apiculture, 30(1), p53-59.
[https://doi.org/10.17519/apiculture.2015.04.30.1.53]

-
Notomi, T., H. Okayama, H. Masubuchi, T. Yonekawa, K. Watanabe, N. Amino, and T. Hase, (2000), Loop-mediated isothermal amplification of DNA, Nucleic acids research, 28(12), pe63-e63.
[https://doi.org/10.1093/nar/28.12.e63]

-
Samson, R.A., C.M. Visagie, J. Houbraken, S.B. Hong, V. Hubka, C.H. Klaassen, ... & J. Varga, (2014), Phylogeny, identification and nomenclature of the genus Aspergillus, Studies in mycology, 78, p141-173.
[https://doi.org/10.1016/j.simyco.2014.07.004]

-
Shoreit, M.N., & M.M.K. Bagy, (1995), Mycoflora associated with stonebrood disease in honeybee colonies in Egypt, Microbiological research, 150(2), p207-211.
[https://doi.org/10.1016/S0944-5013(11)80058-3]

-
Ushikubo, H., (2004), Principle of LAMP method--a simple and rapid gene amplification method], Uirusu, 54(1), p107-112.
[https://doi.org/10.2222/jsv.54.107]

-
Varga, J., & R.A. Samson (Eds.), (2008), Aspergillus in the genomic era, Wageningen Academic Pub.
[https://doi.org/10.3920/978-90-8686-635-9]

- Yamazaki, W., K. Seto, M. Taguchi, M. Ishibashi, & K. Inoue, (2008), Sensitive and rapid detection of cholera toxin-producing Vibrio cholerae using a loop-mediated isothermal amplification, BMC microbiology, 8(1), p1.
-
Yamazaki, W., M. Taguchi, M. Ishibashi, M. Nukina, N. Misawa, & K. Inoue, (2009), Development of a loop-mediated isothermal amplification assay for sensitive and rapid detection of Campylobacter fetus, Veterinary microbiology, 136(3), p393-396.
[https://doi.org/10.1016/j.vetmic.2008.11.018]

- Yoo, M.S., H.J. Seo, H.N. Jung, W.R. Bea, H.S. Lee, S.W. Kang, Y.S. Cho, (2015), Survey on Honeybee Disease in Apis mellifera and Apis cerana in Korean apiaries, 2014. 44th APIMONDIA international Apicultural Congress, 2015, p408.
-
Yoo, M.S., J.H. Noh, B.S. Yoon, K.E. Reddy, C.H. Kweon, S.C. Jung, & S.W. Kang, (2012), Reverse transcription loop-mediated isothermal amplification for sensitive and rapid detection of Korean sacbrood virus, Journal of virological methods, 186(1), p147-151.
[https://doi.org/10.1016/j.jviromet.2012.08.009]

- Yoo, M.S., Y.H. Kim, N.H. Kim, H.N. Jung, B. Thi, K. Reddy, S.C. Jung, S.W. Kang, (2014), Molecular Detection of Honeybee Disease in Apis mellifera and Apis cerana in Korean apiaries, 2013, The 29th Conference of the Apicultural Society of Korea, 2013, p66.
