
아까시 개화기 아까시꿀에서 eDNA metabarcoding 분석을 통한 연도별 식물 조성 변화
Abstract
This study investigated interannual variation in plant composition of black locust (Robinia pseudoacacia) honey using eDNA metabarcoding based on the ITS2 marker. Honey samples collected during the flowering season in 2024 and 2025 from five regions in Korea were analyzed to compare plant taxa composition. Alpha diversity, assessed using observed amplicon sequence variants (ASVs) and Shannon entropy, showed higher values in 2025 compared to 2024 in most regions; however, these differences were not statistically significant (Wilcoxon rank-sum test, p>0.05). Taxonomic composition analysis revealed that R. pseudoacacia was the dominant taxon in all samples, but its relative abundance varied markedly among regions and between years. In several regions, the relative abundance of R. pseudoacacia decreased in 2025, accompanied by an increase in low-abundance plant taxa, indicating a more mixed floral composition. Beta diversity analysis based on Bray-Curtis dissimilarity demonstrated clear differences in plant community composition between years. Principal coordinate analysis (PCoA) showed distinct shifts in sample distribution, particularly in Cheorwon, Icheon, and Changnyeong. These differences were statistically significant (PERMANOVA, R2=0.9512, p=0.001), while no significant differences in dispersion were observed (PERMDISP, p>0.05), indicating that the observed variation reflects changes in community structure rather than dispersion effects. These results suggest that even monofloral honey can reflect interannual variation in floral resource use, likely influenced by environmental conditions affecting flowering phenology and foraging behavior. Overall, this study demonstrates that honey eDNA metabarcoding is a useful tool for assessing temporal variation in plant composition and provides insights into the ecological dynamics of honey production.
Keywords:
Robinia pseudoacacia, Honey eDNA, Metabarcoding, Floral composition, Interannual variation서 론
꿀은 꿀벌이 꽃에서 채집한 화밀과 화분을 이용하여 생산하는 천연 산물로, 다양한 식물 기원을 반영하는 복합적인 생물학적 매트릭스이다. 꿀의 식물 기원은 품질, 기능성 및 경제적 가치와 밀접하게 관련되어 있어 이를 정확히 규명하는 것은 매우 중요하다. 전통적으로 꿀의 식물 기원 분석은 화분 분석(melissopalynology)을 기반으로 수행되어 왔으며, 이는 꿀에 포함된 화분 형태를 현미경으로 관찰하여 식물 기원을 추정하는 방법이다(Louveaux et al., 1978). 그러나 이 방법은 분석자의 숙련도에 크게 의존하고, 형태적으로 유사한 종 간 구분이 어려우며, 화분이 적게 포함된 꿀에서는 정확도가 낮아질 수 있다는 한계가 있다.
최근에는 DNA metabarcoding 기술의 발전에 따라 꿀에 포함된 식물 유래 DNA를 분석하여 식물 기원을 보다 정밀하게 규명하려는 연구가 활발히 이루어지고 있다(Hawkins et al., 2015; Richardson et al., 2015; Prosser and Hebert, 2017). 특히 ITS2와 같은 DNA barcode 영역은 다양한 식물 분류군을 동시에 검출할 수 있어 기존 화분 분석의 한계를 보완할 수 있는 방법으로 주목받고 있다(Bell et al., 2017; de Vere et al., 2017). 이러한 분자생물학적 접근은 꿀의 진위 판별(authenticity), 원산지 추적, 그리고 꿀벌의 채밀 행동 분석 등 다양한 분야에 활용되고 있다(Bovo et al., 2018; Pathiraja et al., 2023; Ullah et al., 2024).
한편, 꿀벌의 채밀 활동은 특정 밀원 식물에만 제한되지 않으며, 주변 환경에 존재하는 다양한 식물 자원을 함께 반영한다. 실제로 꿀벌은 농경지와 자연 생태계에서 예상보다 높은 식물 다양성을 이용하며, 이와 같은 채밀 패턴은 계절, 기상 조건, 토지 이용 및 식생 구조에 따라 달라질 수 있다(Garbuzov and Ratnieks, 2014; Requier et al., 2015; Danner et al., 2017; Pornon et al., 2017; Smart et al., 2017). 최근 연구에서는 꿀벌의 채밀 패턴이 시간에 따라 변화하며, 이러한 변화가 지역 생태계의 식물 자원 변동과 밀접하게 연관되어 있음이 보고되고 있다(Jones et al., 2021; Quinlan et al., 2021). 따라서 꿀에 포함된 식물 DNA 조성은 단순한 주 밀원 식물의 존재 여부를 넘어, 특정 시점의 환경 조건과 꿀벌의 채밀 행동을 반영하는 생태학적 지표로 해석될 수 있다.
국내에서 아까시꿀은 대표적인 단일 밀원꿀로 널리 알려져 있으며, 비교적 높은 순도를 가지는 것으로 인식되고 있다. 그러나 최근 연구들은 단일 밀원꿀에서도 다양한 식물 DNA가 함께 검출될 수 있음을 보여주고 있으며, 이는 실제 꿀벌의 채밀 행동이 단일 식물에만 국한되지 않음을 시사한다. 특히 동일한 아까시꿀이라 하더라도, 개화 양상과 주변 식물 자원의 시간적 변동, 그리고 연도별 환경 조건 차이에 따라 꿀에 반영되는 식물 조성에는 변이가 발생할 수 있다(Requier et al., 2015; Danner et al., 2017; Jones et al., 2021; Quinlan et al., 2021; Leponiemi et al., 2023). 그럼에도 불구하고 국내 아까시꿀을 대상으로 honey eDNA metabarcoding을 이용하여 연도별 식물 조성 변화를 체계적으로 비교한 연구는 아직 제한적이다.
따라서 본 연구에서는 국내 5개 지역(이천, 창녕, 안동, 철원 및 화순)에서 2024년과 2025년에 채집된 아까시꿀을 대상으로 honey eDNA metabarcoding 분석을 수행하여, 아까시 개화기 꿀에 반영된 식물 조성의 연도별 차이를 비교하였다. 구체적으로 Observed ASVs와 Shannon entropy를 이용하여 alpha diversity를 평가하고, Bray-Curtis 기반 principal coordinate analysis (PCoA)와 PERMANOVA를 통해 beta diversity와 군집 조성 차이를 분석하였다. 이를 통해 단일 밀원으로 분류되는 아까시꿀에서도 연도에 따른 식물 조성의 변동이 나타나는지 확인하고, 이러한 변동이 아까시꿀의 순도 해석 및 꿀벌의 채밀 행동 이해에 어떠한 정보를 제공할 수 있는지를 평가하고자 하였다.
재료 및 방법
1. 시료 수집
아까시 개화기에 생산된 아까시꿀 시료를 국내 5개 지역 [이천(L), 창녕(N), 안동(A), 철원(CH)] 및 화순(HW)]에서 2024년과 2025년에 각각 수집하였다. 연도별로 각 지역에서 1점의 대표 시료를 확보하여 총 10점의 꿀 시료를 분석에 사용하였다. 본 연구는 지역별 시료를 기반으로 연도 간 식물 조성의 변화를 비교하기 위해 수행되었다. 수집된 시료는 분석 전까지 동일한 조건에서 보관하였으며, honey eDNA metabarcoding 분석을 통해 연도별 식물 조성 변화를 비교하였다.

Sampling locations of black locust honey used for honey eDNA metabarcoding analysis
2. DNA 추출 및 metabarcoding 분석
꿀 시료로부터 DNA를 추출한 후 식물 분류군 분석을 위해 ITS2 영역을 표적 증폭하였다. PCR 증폭 산물은 차세대염기서열 분석을 수행하였으며, 획득된 서열 데이터를 이용하여 honey eDNA 기반 식물 조성 분석을 실시하였다. 각 꿀 시료로부터 DNA를 추출하였다. DNA 추출은 꿀 10 g에 5배 볼륨의 GI 버퍼를 첨가하여 균질하게 혼합하고 13000 rpm에서 30분간 원심분리하였다. 이후 화분 침전물은 DNeasy plant extraction kit(QIAGEN, Germany)를 제조사 프로토콜에 따라 DNA를 추출하였다. 상층액 또한 affinity column을 사용하여 잔류 DNA를 회수한 후 화분 DNA와 함께 분석에 사용하였다.
식물 분류군 분석을 위해 ITS2 영역을 표적으로 PCR 증폭을 수행하였다. 사용한 primer는 ITS2_F (ATGCGATACTTGGTGTGAAT)와 ITS2_R(TCCTCCGCTTATTGATATGC)이며, 1차 PCR 반응은 초기 변성 95℃ 3분, 이후 95℃ 30초, 55℃ 30초, 72℃ 30초 조건으로 25회 반복한 후 72℃에서 5분간 최종 신장하였다. 1차 PCR 산물은 AMPure 비드(Agencourt Biosciences, Beverly, MA, USA)를 이용하여 정제하였으며, 정제된 시료 2 μL를 이용하여 Nextera XT index primers를 사용한 2차 PCR을 수행하였다. 2차 PCR 조건은 초기 변성 98℃ 1분, 이후 98℃ 15초, 55℃ 15초, 72℃ 30초 조건으로 10회 반복한 후 72℃에서 3분간 최종 신장하였다. 최종 PCR 산물은 다시 AMPure 비드를 이용하여 정제한 후 KAPA Library Quantification Kit로 정량하였으며, Tapestation D1000 ScreenTape (Agilent Technologies, Waldbronn, Germany)를 이용하여 library의 fragment size distribution을 확인하였다. 이후 Illumina MiSeq platform (Illumina, San Diego, CA, USA)을 이용하여 염기서열 분석을 수행하였다.
3. 생물정보학 분석
획득된 염기서열 데이터는 QIIME 2 (version 2024.2) 환경에서 처리하였다. 먼저 Trimmomatic (version 0.39)을 이용하여 adapter 서열 및 low-quality reads(Phred score<20)를 제거하고, 50 bp 이상의 reads만을 선별하였다. 이후 DADA2 (R package version 1.36.0)를 이용하여 denoising, paired-end read merging 및 chimera 제거를 수행하여 amplicon sequence variants(ASVs)를 생성하였다.
생성된 ASVs는 BLAST 기반으로 분류학적 동정을 수행하였으며, reference database로는 UNITE+INSD (version 10.0)를 사용하였다. Taxonomic assignment는 최소 80% 이상의 sequence identity 및 query coverage 조건에서 수행하였다.
4. 다양성 분석
다양성 분석은 alpha diversity와 beta diversity로 구분하여 수행하였다. Alpha diversity는 각 시료에서 검출된 식물 분류군의 다양성을 평가하기 위하여 Observed amplicon sequence variants (ASVs)와 Shannon entropy 지수를 이용하여 산출하였다. 각 지역 내에서 2024년과 2025년 시료 간 alpha diversity의 차이는 비모수 검정인 Wilcoxon rank-sum test를 이용하여 평가하였다.
Beta diversity는 시료 간 식물 군집 조성의 차이를 평가하기 위하여 Bray-Curtis dissimilarity를 이용하여 계산하였으며 군집 간 차이는 principal coordinate analysis (PCoA)를 통해 시각화하였다.
그룹 간 군집 구조 차이의 통계적 유의성은 permutational multivariate analysis of variance (PERMANOVA)를 이용하여 평가하였으며, 999 permutations을 적용하였다. 또한 군집 분산의 동질성을 평가하기 위하여 PERMDISP 분석을 수행하였다.
모든 통계 분석 및 시각화는 QIIME 2 (version 2024.2) 및 R software (version 4.3.1)를 이용하여 수행하였다.
결 과
1. 알파다양성
Observed ASVs와 Shannon entropy를 이용하여 아까시꿀 시료에서 검출된 식물 분류군의 alpha diversity를 평가하였다. Observed ASVs는 안동에서 2024년 125.33±18.58에서 2025년 566.67±154.12로 증가하였고, 화순에서는 128.00±7.00에서 587.33±175.57로 증가하였다. 철원은 95.67±12.42에서 127.33±33.86으로 증가하였으며, 이천 역시 183.33±89.58에서 319.00±113.45로 증가하였다. 반면 창녕은 177.00±49.51에서 69.33±10.26으로 감소하였다. 전반적으로 5개 지역 중 4개 지역에서 2025년의 Observed ASVs가 2024년보다 높은 값을 보였다.
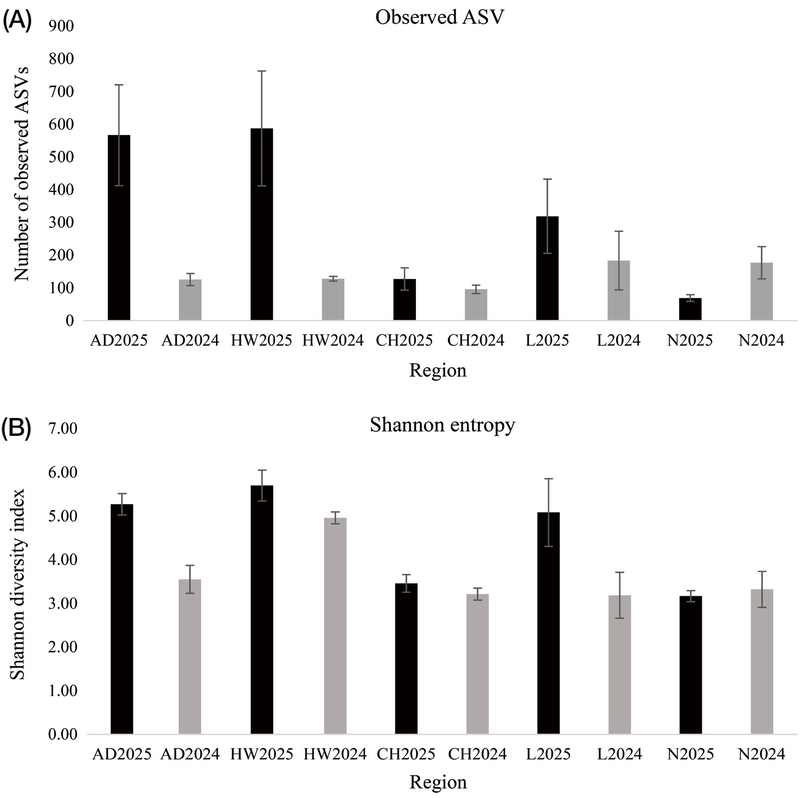
Alpha diversity of plant taxa detected in black locust honey samples collected during the flowering season in 2024 and 2025. Alpha diversity was evaluated using (A) Observed amplicon sequence variants (ASVs) and (B) Shannon entropy. Values are presented as mean±standard deviation (SD). Differences between 2024 and 2025 within each sampling region were evaluated using the Wilcoxon rank-sum test (p>0.05). Each point represents an individual sample, and abbreviations indicate sampling regions: A (Andong), CH (Cheorwon), N (Changnyeong), L (Icheon), and HW (Hwasun).
Shannon entropy 또한 유사한 양상을 보였다. 안동은 2024년 3.55에서 2025년 5.27로 증가하였고, 화순은 4.96에서 5.70으로 증가하였다. 철원은 3.21에서 3.46으로 소폭 증가하였으며, 이천은 3.19에서 5.08로 증가하였다. 반면 창녕은 3.32에서 3.17로 소폭 감소하였다. 그러나 Wilcoxon rank-sum test 결과, Observed ASVs 및 Shannon entropy 모두에서 연도 간 통계적으로 유의한 차이는 나타나지 않았다(p>0.05).
2. 분류군의 조성
Robinia pseudoacacia는 모든 시료에서 검출된 주요 우점 분류군이었으나, 그 상대적 풍부도는 지역과 연도에 따라 차이를 보였다. 특히 철원에서는 2024년 0.59931에서 2025년 0.08995로 크게 감소하였고, 창녕에서도 0.78072에서 0.01557로 현저히 감소하였다. 이천 역시 0.69882에서 0.19069로 감소하였다. 반면 안동에서는 Robinia pseudoacacia의 상대적 풍부도가 2024년 0.40735에서 2025년 0.54854로 증가하였다. 화순에서는 두 연도 모두 낮은 수준을 보였으며 2024년 0.01221에서 2025년 0.00238로 감소하였다. 이와 함께 Rosa sp., Styrax japonicus, Rubus crataegifolius, Vicia villosa, Chelidonium majus, Amorpha nana 등의 비우점 분류군이 지역별로 상이한 비율로 검출되었다.
또한 2025년 시료에서는 일부 지역에서 저빈도 식물 분류군의 검출 비율이 증가하여 전체 조성이 보다 혼합된 양상을 나타냈다. 이러한 결과는 동일 밀원꿀이라 하더라도 지역과 연도에 따라 꿀에 반영되는 식물 조성이 달라질 수 있음을 시사한다.
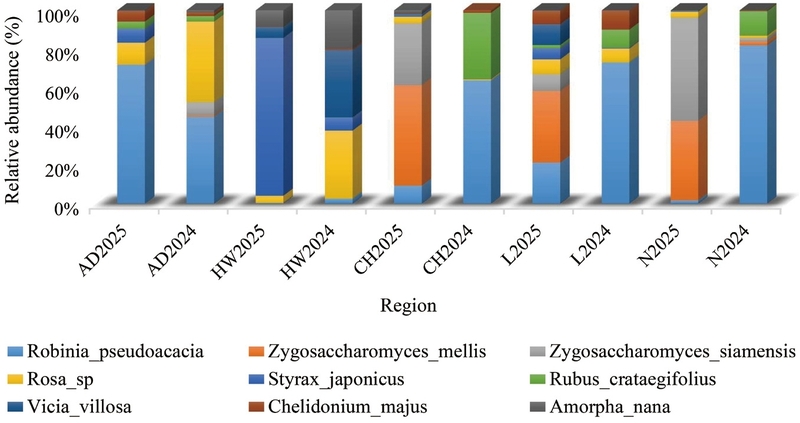
Relative abundance of dominant plant taxa detected in black locust honey samples from five regions in 2024 and 2025. Dominant taxa represent the most abundant plant taxa across all samples. Relative abundance values are presented as proportions of sequence reads assigned to each taxon. Robinia pseudoacacia was detected in all samples, but its relative abundance varied among regions and between years. Each point represents an individual sample, and abbreviations indicate sampling regions: A(Andong), CH (Cheorwon), N (Changnyeong), L(Icheon), and HW (Hwasun).
3. 베타다양성
Bray-Curtis 거리 기반 principal coordinate analysis (PCoA)를 수행한 결과, 아까시꿀 시료에서 검출된 식물 군집 조성은 지역 및 연도에 따라 뚜렷한 분포 차이를 나타냈다(Fig. 3). PCoA의 Axis 1과 Axis 2는 각각 전체 변이의 39.25%와 25.88%를 설명하였다.
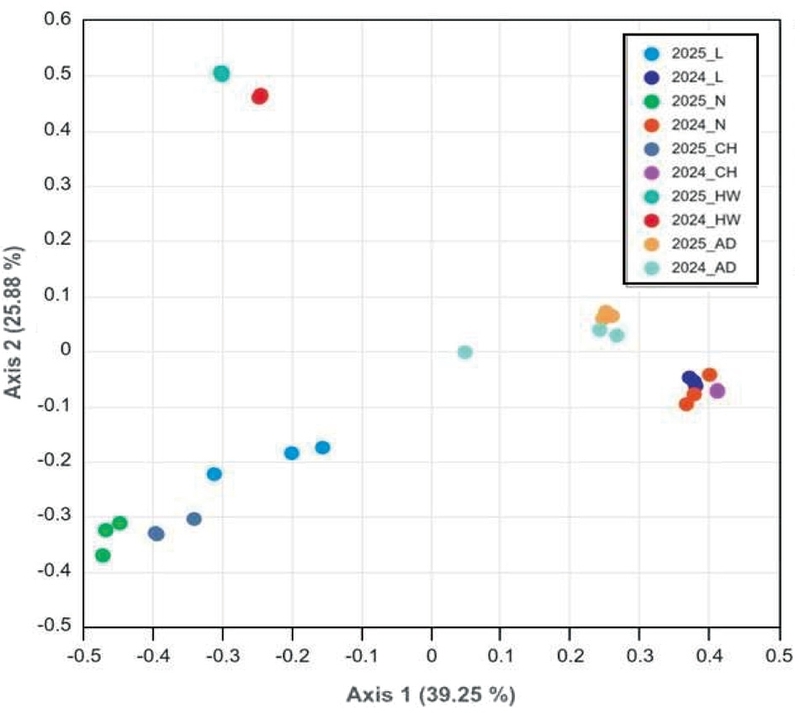
Principal coordinate analysis (PCoA) based on Bray-Curtis dissimilarity showing variation in plant community composition of black locust honey samples collected from five regions in 2024 and 2025. Each point represents an individual sample. Axis 1 and Axis 2 explained 39.25% and 25.88% of the total variation, respectively. Differences among groups were tested using PERMANOVA (R2=0.9512, p=0.001). Homogeneity of group dispersions was assessed using PERMDISP (p>0.05). Each point represents an individual sample, and abbreviations indicate sampling regions: A (Andong), CH (Cheorwon), N (Changnyeong), L (Icheon), and HW (Hwasun).
지역별로 보면, 안동(A) 시료는 2024년과 2025년이 비교적 근접한 위치에 분포하여 연도 간 군집 조성의 변화가 상대적으로 크지 않은 양상을 보였다. 반면, 철원(CH), 창녕(N), 이천(L) 시료는 2024년과 2025년이 Axis 1 방향을 따라 명확하게 분리되는 양상을 나타냈으며, 특히 2025년 시료는 2024년 시료보다 좌측 방향으로 이동하는 경향이 관찰되었다.
화순(HW) 시료의 경우에는 Axis 2 방향을 중심으로 연도 간 위치 차이가 나타나, 다른 지역과는 구별되는 변화 양상을 보였다. 이러한 결과는 동일한 아까시꿀이라 하더라도 지역에 따라 연도별 식물 군집 조성 변화의 방향과 정도가 다르게 나타날 수 있음을 시사한다.
PERMANOVA 분석 결과, 그룹 간 식물 군집 조성 차이는 통계적으로 유의한 것으로 확인되었다(R2 =0.9512, p=0.001). 이는 PCoA에서 관찰된 군집 분리 양상이 통계적으로도 뒷받침됨을 의미한다. 또한 PERMDISP 분석 결과, 그룹 간 분산 차이는 유의하지 않은 것으로 나타나, PERMANOVA 결과는 군집 간 분산 차이가 아닌 중심 차이를 반영하는 것으로 해석되었다(p>0.05).
고 찰
본 연구에서는 아까시 개화기에 채집된 아까시꿀을 대상으로 honey eDNA metabarcoding 분석을 수행하여 연도별 식물 조성 변화를 비교하였다. 그 결과, 동일한 밀원 아까시꿀이라 하더라도 연도에 따라 꿀에 반영되는 식물 조성에 차이가 나타날 수 있음을 확인하였다. 이러한 결과는 꿀이 특정 단일 밀원 식물만을 반영하는 고정된 산물이 아니라, 해당 시기의 채밀 환경과 꿀벌의 실제 이용 식물 자원이 복합적으로 반영된 결과물임을 나타내는 것으로 보인다.
먼저 alpha diversity 분석에서 Observed ASVs와 Shannon entropy는 대부분 지역에서 2025년에 증가하는 경향을 보였으나, Wilcoxon rank-sum test 결과 통계적으로 유의한 차이는 확인되지 않았다(p>0.05). 이는 metabarcoding 데이터의 높은 변동성과 제한된 시료 수에 따른 검정력의 한계로 해석될 수 있다. 그럼에도 불구하고 일부 지역에서 다양성 증가가 관찰된 점은 2025년 시료가 2024년에 비해 보다 다양한 식물 분류군을 반영하고 있음을 시사한다. 꿀벌은 특정 밀원 식물뿐 아니라 주변의 다양한 식물 자원을 함께 이용하는 것으로 알려져 있으며(Requier et al., 2015; Smart et al., 2017; Bovo et al., 2018; Daugaliyeva et al., 2024), 이러한 채밀 행동은 꽃 자원의 가용성 및 환경 조건 변화에 따라 달라질 수 있다.
분류군 조성 분석에서도 이러한 경향은 일관되게 나타났다. Robinia pseudoacacia는 모든 시료에서 주요 우점 분류군으로 확인되었으나, 철원, 창녕, 이천에서는 2025년에 상대적 풍부도가 뚜렷하게 감소하였고, 반면 안동에서는 증가하였다. 특히 일부 지역에서 저빈도 식물 분류군의 비율이 증가한 점은, 주 밀원 식물의 상대적 기여도가 감소할 경우 꿀벌이 대체 식물 자원을 함께 이용했을 가능성을 시사한다. 이러한 결과는 DNA metabarcoding이 저빈도 분류군까지 포착할 수 있어 단일 밀원꿀의 식물 조성을 보다 정밀하게 해석할 수 있음을 보여준다(Hawkins et al., 2015; Keller et al., 2015; de Vere et al., 2017; Prosser and Hebert, 2017; Ullah et al., 2024).
Beta diversity 분석에서도 연도 간 식물 군집 조성의 차이가 확인되었다. Bray-Curtis 거리 기반 PCoA에서 철원, 이천, 창녕 시료는 2024년과 2025년 사이에서 뚜렷한 위치 이동을 보였으며, 이는 군집 구조 수준에서의 변화를 반영한다. PERMANOVA 분석 결과 이러한 차이는 통계적으로 유의하였으며(R2=0.9512, p=0.001), 999 permutations을 기반으로 검정되었다. 또한 PERMDISP 분석 결과 그룹 간 분산 차이는 유의하지 않은 것으로 나타나(p>0.05), 관찰된 차이는 분산 차이가 아닌 군집 중심 간 차이를 반영하는 것으로 해석된다. 이는 연도 효과가 식물 조성 전반에 영향을 미쳤음을 강하게 뒷받침한다.
이러한 연도 간 차이는 개화 시기의 기상 조건 변화와 관련이 있을 가능성이 있으며, 꿀벌의 식물 자원 이용 패턴이 시간에 따라 변화할 수 있다는 기존 연구 결과와도 일치한다(Lowe et al., 2023; Yuan et al., 2025). 국내 산림 및 농업기상 자료에 따르면, 2025년은 겨울철 저온과 봄철 기온 변동이 커 아까시 개화 시기가 지역에 따라 지연되거나 불균일하게 나타난 것으로 보고되었으며(국립산림과학원, 2025; 기상청, 2025; 농촌진흥청, 2025) 이러한 기상 조건의 변동은 꿀벌의 채밀 활동 시기 및 이용 가능한 식물 자원의 구성에 영향을 미쳐, 결과적으로 꿀에 반영되는 식물 조성의 차이로 나타났을 가능성이 있다.
한편 일부 시료에서 Zygosaccharomyces속 효모의 상대적 풍부도가 증가한 점도 주목할 필요가 있다. 해당 효모는 꿀 환경에서 흔히 나타나는 당내성 미생물로, 수분 함량, 저장 조건 및 발효 가능성과 관련된 것으로 알려져 있다(Paluoja et al., 2025). 본 연구에서 아까시나무의 상대적 비중이 감소한 2025년 시료에서 이러한 효모가 상대적으로 증가한 양상은, 주 밀원 식물의 기여도가 약화될 경우 꿀의 조성이나 환경 조건이 변화할 가능성을 시사한다. 또한 이러한 변화는 꿀벌의 채밀 행동이나 생리적 상태 변화와도 간접적으로 연관될 수 있으나, 본 연구는 ITS2 기반 식물 조성 분석을 중심으로 수행되었기 때문에 미생물 군집에 대한 정량적 해석에는 한계가 있다. 따라서 이러한 결과는 꿀이 식물 기원뿐 아니라 미생물학적 특성 또한 반영하는 복합적인 생물학적 산물임을 보여주는 참고적 관찰로 볼 수 있으며, 향후에는 수분 함량, 저장성 및 미생물 군집 분석을 포함한 통합적 연구가 필요하다.
다만 본 연구는 시료 수가 제한적이며 동일 벌통에서 반복 채집된 자료가 아니라는 점에서 공간적 요인의 영향을 완전히 배제하기 어렵다. 향후 연구에서는 동일 벌통 기반의 반복 채집과 장기 모니터링을 통해 시간 효과와 공간 효과를 보다 명확히 구분할 필요가 있다.
본 연구 결과, 아까시꿀과 같은 단일 밀원꿀에서도 연도에 따라 식물 조성의 변동이 나타날 수 있음을 확인하였다. 특히 일부 지역에서 우점종인 Robinia pseudoacacia의 상대적 풍부도가 감소하고 저빈도 식물 분류군이 증가한 양상은, 꿀이 단일 식물에 의해 고정적으로 구성되는 산물이 아니라 해당 시기의 환경 조건과 꿀벌의 채밀 행동이 반영된 결과임을 시사한다. 따라서 honey eDNA metabarcoding은 단일 밀원꿀의 순도를 단순히 우점종의 존재 여부로 판단하는 것을 넘어, 꿀벌의 실제 식물 자원 이용 패턴과 환경 변동을 함께 해석할 수 있는 유용한 도구로 활용될 수 있다.
Acknowledgments
본 연구는 2026년도 농촌진흥청 국립농업과학원 전문연구원 과정 지원사업에 의해 이루어진 것이며 국립농업과학원 농업과학기반기술연구(과제번호: PJ01745703)에 의하여 수행되었습니다.
References
- 국립산림과학원. 2025. 2025년 아까시나무 개화 예측 지도 발표: 전국 평균 5월 중순 본격 개화 전망. 서울: 국립산림과학원.
- 기상청. 2025. 2025년 봄철(3월~5월) 기후 특성 분석 결과: 역대급 고온과 개화기 강수 영향 분석. 서울: 기상청.
- 농촌진흥청. 2025. 2025년도 민관 합동 아까시꿀 작황 현장 조사 결과 보고서. 전주: 농촌진흥청.
-
Bell, K. L., V. M. Loeffler and B. J. Brosi. 2017. An rbcL reference library to aid in the identification of plant species mixtures by DNA metabarcoding. Appl. Plant Sci. 5: 1600110.
[https://doi.org/10.3732/apps.1600110]

- Bovo, S., A. Ribani, V. J. Utzeri and L. Fontanesi. 2018. DNA metabarcoding for the identification of honey botanical origin: A review. Food Res. Int. 105: 679-686.
-
Danner, N., A. M. Molitor, S. Schiele, S. Härtel and I. Steffan-Dewenter. 2017. Season and landscape composition affect pollen foraging distances and habitat use of honey bees. Ecol. Appl. 27: 1920-1929.
[https://doi.org/10.1890/15-1840.1]
-
Daugaliyeva, S., K. Amirova, A. Yelubayeva, A. Kapar, A. Abiti, T. Partipilo, N. Toktarov and S. Peletto. 2024. Foraging of honeybees from different ecological areas determined through DNA metabarcoding. Insects 15: 674.
[https://doi.org/10.3390/insects15090674]
-
de Vere, N., L. E. Jones, T. Gilmore, J. Moscrop, A. Lowe, D. Smith, M. J. Hegarty, S. Creer and C. R. Ford. 2017. Using DNA metabarcoding to investigate honey bee foraging reveals limited flower use despite high floral availability. Sci. Rep. 7: 42838.
[https://doi.org/10.1038/srep42838]
-
Garbuzov, M. and F. L. W. Ratnieks. 2014. Quantifying variation among garden plants in attractiveness to bees and other flower-visiting insects. Funct. Ecol. 28: 364-374.
[https://doi.org/10.1111/1365-2435.12178]
-
Hawkins, J., N. de Vere, A. Griffith, C. R. Ford, J. Allainguillaume, M. J. Hegarty, L. Baillie and B. Adams-Groom. 2015. Using DNA metabarcoding to identify the floral composition of honey. PLoS One 10: e0120186.
[https://doi.org/10.1371/journal.pone.0134735]
-
Jones, L., G. L. Brennan, A. Lowe, S. Creer, C. R. Ford and N. de Vere. 2021. Shifts in honeybee foraging reveal historical changes in floral resources. Commun. Biol. 4: 37.
[https://doi.org/10.1038/s42003-020-01562-4]
- Keller, A., N. Danner, G. Grimmer, M. Ankenbrand, K. von der Ohe, W. von der Ohe, S. Rost, S. Härtel and I. Steffan-Dewente. 2015. Evaluating multiplexed next-generation sequencing as a method for identifying pollen sources in honey. Ecol. Evol. 5: 253-265.
-
Leponiemi, M., D. Freitak, M. Moreno-Torres, E.-M. Pferschy-Wenzig, A. Becker-Scarpitta, M. Tiusanen, E. J. Vesterinen and H. Wirta. 2023. Honeybees’ foraging choices for nectar and pollen revealed by DNA metabarcoding. Sci. Rep. 13: 14753.
[https://doi.org/10.1038/s41598-023-42102-4]
-
Louveaux, J., A. Maurizio and G. Vorwohl. 1978. Methods of melissopalynology. Bee World 59: 139-157.
[https://doi.org/10.1080/0005772X.1978.11097714]
-
Lowe, A., L. Jones, G. Brennan, S. Creer, L. Christie and N. de Vere. 2023. Temporal change in floral availability leads to periods of resource limitation and affects diet specificity in a generalist pollinator. Mol. Ecol. 32: 6363-6376.
[https://doi.org/10.1111/mec.16719]
-
Paluoja, P., M. Vaher, H. Teder, K. Krjutškov, A. Salumets and K. Raime. 2025. Honey bulk DNA metagenomic analysis to identify honey biological composition and monitor honey bee pathogens. NPJ Sci. Food 9: 91.
[https://doi.org/10.1038/s41538-025-00464-1]
-
Pathiraja, D., J. Cho, J. Kim and I.-G. Choi. 2023. Metabarcoding of eDNA for tracking the floral and geographical origins of bee honey. Food Res. Int. 164: 112413.
[https://doi.org/10.1016/j.foodres.2022.112413]
-
Pornon, A., N. Escaravage, M. Burrus, H. Holota, A. Khimoun, J. Mariette, C. Pellizzari, A. Iribar, R. Etienne, P. Taberlet, M. Vidal, P. Winterton and C. Andalo. 2017. Using metabarcoding to reveal and quantify plant-pollinator interactions. Sci. Rep. 7: 15010.
[https://doi.org/10.1038/srep27282]
-
Prosser, S. W. J. and P. D. N. Hebert. 2017. Rapid identification of the botanical sources of honey using DNA metabarcoding. Food Chem. 214: 183-191.
[https://doi.org/10.1016/j.foodchem.2016.07.077]
-
Quinlan, G., M. Milbrath, C. Otto, A. Smart, D. D. Iwanowicz, R. Isaacs and R. S. Cornman. 2021. Honey bee foraged pollen reveals temporal changes in pollen protein content and changes in forager choice for abundant versus high protein flowers. Agric. Ecosyst. Environ. 322: 107645.
[https://doi.org/10.1016/j.agee.2021.107645]
-
Requier, F., J. F. Odoux, T. Tamic, N. Moreau, M. Henry, A. Decourtye and V. Bretagnolle. 2015. Honey bee diet in intensive farmland habitats reveals an unexpectedly high flower richness and a major role of weeds. Ecol. Appl. 25: 881-890.
[https://doi.org/10.1890/14-1011.1]
-
Richardson, R. T., C. H. Lin, D. B. Sponsler, J. O. Quijia, K. Goodell and R. M. Johnson. 2015. Application of ITS2 metabarcoding to determine the provenance of pollen collected by honey bees. Appl. Plant Sci. 3: 1400066.
[https://doi.org/10.3732/apps.1400066]
- Smart, M. D., C. R. V. Otto, B. L. Carlson and C. L. Roth. 2017. The influence of spatiotemporally decoupled land use on honey bee colony health and productivity. Environ. Res. Lett. 12: 014012.
-
Ullah, S., F. Huyop, R. Abdul Wahab, I. G. A. Sujana, N. S. Antara and I. B. W. Gunam. 2024. Using pollen DNA metabarcoding to trace the geographical and botanical origin of honey from Karangasem, Indonesia. Heliyon 10: e33094.
[https://doi.org/10.1016/j.heliyon.2024.e33094]
-
Yuan, H., J. Han, M. Yang, S. Chen and X. Pang. 2025. DNA metabarcoding: Current applications and challenges. J. Agric. Food Chem. 73: 20616-20632.
[https://doi.org/10.1021/acs.jafc.5c06002]