
High-quality Genome Assemblies of Seven Korean Honeybee Breeding Lines
Abstract
Honeybees (Apis spp.) are indispensable pollinators, yet their genetic integrity is increasingly threatened by habitat fragmentation and genetic introgression. High-quality chromosomal blueprints for specific, managed breeding strains are urgently required to facilitate precision molecular breeding and robust germplasm conservation. In this study, we generated chromosome-level de novo genome assemblies for seven honeybee breeding lines registered in the Korean National Seed Bank: five Apis mellifera (Italian, Carpatica, and Carniolan origins) and two Apis cerana. Using a hybrid sequencing strategy combining high-depth PacBio HiFi long reads and Oxford Nanopore Pore-C proximity-ligation data, an optimized NextDenovo and NextPolish pipeline successfully anchored contigs into 16 chromosome-level scaffolds. The finalized assemblies ranged from 207.68 to 223.22 Mb in size with exceptional BUSCO completeness(98.1-98.2%), effectively eliminating the pseudo-haplotypic inflation common in alternative assemblers. Comparative functional genomics revealed a clear species-level dichotomy: A. cerana genomes were significantly enriched in structural and regulatory categories, including cellular anatomical structure and biological regulation, whereas A. mellifera lines exhibited pronounced expansions in catalytic, transporter, and ATP-dependent activities. At the intra-species level, the identification of a toxicological outlier (Am-V) was resolved as a composite signature of host defensive peptides and co-assembled endosymbiont sequences, rather than a broad genomic expansion. Concurrently, complete mitogenome mapping resolved maternal phylogeographic structures, anchoring the native A. cerana lines within the mainland East Asian continental clade and partitioning A. mellifera lines within the European C-lineage. These high-fidelity reference templates establish a critical digital infrastructure for high-throughput marker development and climate-adaptive apicultural genomics.
Keywords:
Apis mellifera, Apis cerana, Chromosome-level assembly, PacBio HiFi, Pore-C, Korean honeybee, Seed bank, Precision breedingINTRODUCTION
Honeybees are among the most economically and ecologically important insect pollinators worldwide, contributing an estimated $200 billion annually to global crop production through pollination services (Klein et al., 2007). The Western honeybee (Apis mellifera) and the Eastern honeybee (Apis cerana) are the two most widely managed species, with A. mellifera dominating commercial apiculture in Europe, the Americas, and parts of Asia, while A. cerana remains the primary managed species in many East and Southeast Asian countries (Crane, 1999). Both species face mounting pressures from habitat fragmentation, pesticide exposure, parasites (notably Varroa mites), pathogens (including viruses and Nosema spp.), and climate change (Meixner, 2010; Goulson et al., 2015). These stressors have driven significant colony losses and heightened concerns about the long-term sustainability of apiculture and pollination-dependent agriculture (Potts et al., 2010).
Genetic diversity is a cornerstone of species resilience and adaptive potential (Frankham et al., 2010). In honeybees, natural subspecies and locally adapted ecotypes harbor allelic variation that underpins traits such as disease resistance, foraging efficiency, overwintering success, and behavioral adaptations to regional climates (Ruttner, 2013; Wallberg et al., 2014). However, intensive breeding practices, global trade in queens and colonies, and inadvertent hybridization have led to genetic homogenization and the erosion of native gene pools in many regions (De la Rúa et al., 2009; Harpur et al., 2012). The conservation of genetically distinct breeding lines is therefore critical not only for preserving biodiversity but also for maintaining a reservoir of adaptive alleles that can be leveraged in breeding programs aimed at improving honeybee health and productivity (Meixner et al., 2010).
In South Korea, apiculture has a long history, with both introduced A. mellifera subspecies (primarily Italian and Carniolan bees) and native A. cerana populations playing important roles in agriculture and ecosystem services (Jung and Lee, 2018). Recognizing the need to safeguard these genetic resources, the Korean government has established a National Seed Bank program that includes the registration and maintenance of core honeybee strains under controlled, genetically isolated conditions (Frunze et al., 2022). These strains are maintained at specialized facilities such as the Wido Isolated Breeding Station in Buan-gun, Jeollabuk-do Province, which provides geographic isolation to minimize genetic contamination from feral or commercial colonies (Frunze et al., 2022). Despite the importance of these conserved strains, comprehensive genomic characterization has been lacking. While high-quality reference genomes have been established domestically for the native A. cerana-ranging from the early next-generation draft (AcSNUv2.0) to the recent near-complete chromosome-level layout (Acer K1.0)-there is currently no domestic reference assembly available for A. mellifera strains maintained in South Korea, enforcing a total reliance on generic foreign templates (Park et al., 2015; Lee et al., 2025). Chromosome-level genome assemblies of multiple distinct strains for both species are therefore essential for comparative genomics, accurate identification of line-specific structural rearrangements, and the systematic development of molecular markers tailored for precision breeding (Chapman et al., 2015; Wragg et al., 2016).
Recent advances in long-read sequencing technologies have revolutionized genome assembly. PacBio High Fidelity (HiFi) sequencing generates long reads (10-25 kb) with exceptionally high accuracy (>99.9%, Q20 or higher), enabling the resolution of repetitive regions and the production of highly contiguous assemblies with minimal errors (Wenger et al., 2019; Cheng et al., 2021). Complementary scaffolding approaches, such as Hi-C and related proximity-ligation methods, use chromatin conformation capture to infer long-range genomic contacts, facilitating the ordering and orientation of contigs into chromosome-scale scaffolds (Lieberman-Aiden et al., 2009). Oxford Nanopore Technologies (ONT) Pore-C is a recent innovation that extends traditional Hi-C by capturing multi-way chromatin contacts, providing richer information for scaffolding and enabling chromosome-level assembly even in complex or polyploid genomes (Goel et al., 2019; Garg et al., 2021).
In this study, we present chromosome-level genome assemblies for seven honeybee strains registered in the Korean National Seed Bank: five A. mellifera strains representing Italian, Carpatica/Carniolan, and Carniolan lineages, and two native A. cerana strains from Korea. We employed a hybrid sequencing strategy combining Pac Bio HiFi long reads for contig assembly and ONT Pore-C data for chromosome-level scaffolding. We assessed assembly quality using standard metrics (N50, BUSCO completeness) and Hi-C contact maps, and we performed phylogenetic analysis based on mitochondrial genomes to confirm the genetic identity and evolutionary relationships of these strains. Our results provide a high-quality genomic foundation for the conservation, management, and molecular breeding of Korean honeybee genetic resources.
MATERIALS AND METHODS
1. Sample collection and preservation
Seven honeybee strains were selected from the Korean National Seed Bank, comprising five A. mellifera strains and two A. cerana strains. The A. mellifera strains included three of Italian origin (Am-A, Am-C, Am-F), one Carpatica/Carniolan-type strain (Am-D), and one Carniolan strain (Am-V). The A. cerana strains (Ac-R, Ac-X) were both of Korean origin. For each strain, more than 50 individual worker bees were collected to ensure adequate representation of colony genetic diversity. Samples were collected from two primary locations in Jeollabuk-do Province, South Korea: the Wido Isolated Breeding Station in Buan-gun and the National Institute of Agricultural Sciences in Jeonju. The Wido station is situated on an island, providing geographic isolation that minimizes the risk of genetic contamination from external colonies. All samples used for genomic analyses were nurse bees aged approximately 3-7 days post-eclosion, collected directly from the brood nest area of each colony. Immediately upon collection, specimens designated for DNA extraction were individually flash-frozen using portable liquid nitrogen dry shippers and transported to the laboratory, where they were stored at -80℃ until DNA extraction.
2. High Molecular Weight(HMW) DNA extraction
HMW DNA was extracted from whole body of individual nurse bees using a modified CTAB (cetyltrimethylammonium bromide) protocol optimized for insect tissues. Briefly, whole body were homogenized in liquid nitrogen, incubated in CTAB extraction buffer (2% CTAB, 1.4 M NaCl, 100 mM Tris-HCl pH 8.0, 20 mM EDTA, and 1% beta-mercaptoethanol) at 37℃ for 1 hour, followed by chloroform:isoamyl alcohol (24 : 1) extraction and ethanol precipitation. DNA pellets were washed with 70% ethanol, air-dried, and resuspended in TE buffer (10 mM Tris-HCl pH 8.0, 1 mM EDTA). Extract quality was assessed by 1% agarose gel electrophoresis and quantified with the Quantus Fluorometer (Promega, USA).
3. PacBio HiFi sequencing
The long read libraries were prepared using the PacBio SMRTbell Prep Kit 3.0 and SMARTbell barcoded adapter plate 3.0 according to the manufacturer’s protocol (Pacific Biosciences). Briefly, 5 μg of HMW DNA per sample was sheared to a target size of 15-20 kb using a g-TUBE (Covaris), followed by DNA damage repair, end repair, and ligation of SMRTbell adapters. Size selection was performed using the PippinHT system (Sage Science) to enrich for fragments >10 kb. Library quality and concentration were assessed using the Femto Pulse systems (Agilent) and Quantus Fluorometer. To maximize sequencing efficiency and cost-effectiveness, libraries from 7-8 individual honeybee strains were pooled in equimolar ratios and loaded onto a single SMRT Cell. Long-read sequencing was performed on the PacBio Revio system using Sequencing Kit 3.0 and the 30-hour movie acquisition protocol. This pooling strategy was designed to achieve approximately 20× genome coverage per strain, assuming a genome size of approximately 230 Mbp for A. mellifera and 220 Mbp for A. cerana. Circular Consensus Sequencing (CCS) was performed using SMRT Link v13.3 software with default parameters to generate HiFi reads with a minimum predicted accuracy of Q20 (99% accuracy).
4. Oxford Nanopore Pore-C sequencing
Pore-C sequencing based on the Oxford Nanopore sequencing platform was employed to acquire chromosomal contact information for insect tissues. For each strain, three whole nurse bees were fixed with 1% formaldehyde for 10 minutes at room temperature to crosslink chromatin, followed by quenching with 125 mM glycine. Fixed cells were treated with permeabilisation solution (10 mM Tris-HCl, 10 mM NaCl, 0.2% IGEPAL CA-630). In situ digestion was performed using a cocktail of restriction enzymes (NlaIII) to fragment chromatin while preserving crosslinked contacts. Digested DNA ends were ligated using T4 DNA ligase (New England Biolabs). Following ligation, crosslinks were reversed by overnight incubation at 65℃ with proteinase K, and DNA was purified using phenol-chloroform extraction and ethanol precipitation. Purified Pore-C DNA was used to prepare Oxford Nanopore sequencing libraries using the Ligation Sequencing Kit (SQK-LSK114) according to the manufacturer’s protocol. Libraries were loaded onto Prometh ION flow cells and sequenced on a PromethION24 instrument. Sequencing was performed for 72 hours per flow cell to achieve approximately 20× genome coverage per strain. Base calling was performed using Dorado v7.9.8 in Super-accurate mode.
5. Genome assembly pipeline
Genome assembly was performed using a multi-stage pipeline integrating PacBio HiFi reads for contig assembly and ONT Pore-C data for chromosome-level scaffolding. First, HiFi reads were assembled into contigs using NextDenovo v2.5.2 with default parameters (Hu et al., 2024). NextDenovo employs a correct-then-assemble strategy for long-read sequencing data to generate highly contiguous genome assemblies. Contig-level assemblies were polished using the original HiFi reads with Next Polish v1.4.1 to correct any residual errors (Hu et al., 2020). Polished contigs were then scaffolded to chromosome level using Pore-C data. Multi-way chromatin contacts were identified using pore-c-snakemake pipeline, which filters spurious contacts, normalizes contact frequencies, and generates contact matrices. Chromosome-scale scaffolding was performed using 3D-DNA v190716, which utilizes chromatin contact frequency information to detect mis-joins and to order and orient contigs into chromosome-scale scaffolds (Dudchenko et al., 2017). Manual curation of scaffolds was performed using Juicebox Assembly Tools v2.17 to correct mis-joins and resolve ambiguities based on visual inspection of Pore-C contact maps (Dudchenko et al., 2018). The curated assembly was finalized using the 3D-DNA post-review pipeline.
6. Quality assessment
Assembly quality was assessed using multiple complementary metrics. Contiguity was evaluated using standard statistics including total assembly size, number of scaffolds, N50 (the length of the shortest scaffold in the set of scaffolds that together represent at least 50% of the assembly), N90, maximum scaffold length, and average scaffold length. These metrics were calculated using QUAST v5.2.0 (Mikheenko et al., 2018). Completeness was assessed using BUSCO (Benchmarking Universal Single-Copy Orthologs) v5.8.3 with the apoidea_odb12 database, which contains 6,507 conserved single-copy orthologs expected to be present in Hymenoptera genomes. BUSCO classifies genes as complete (single-copy or duplicated), fragmented, or missing, providing a quantitative measure of assembly completeness and potential contamination (indicated by elevated duplication rates) (Seppey et al., 2019). Pore-C contact maps were generated using 3D-DNA v190716 and visualized using Juice box v2.17. Contact maps provide a visual representation of chromatin interaction frequencies across the genome, with strong diagonal blocks indicating contiguous chromosome-scale scaffolds and off-diagonal signals revealing structural features such as centromeres, telomeres, and large-scale rearrangements.
7. Gene ontology analysis
Functional annotation of the predicted gene models for all seven chromosome-level assemblies was performed using the OmicsBox platform (v3.2.9, Biobam, Spain), integrating sequence homology searches and domain signature identifications (Götz et al., 2008). First, protein-coding gene models were predicted using AUGUSTUS (v3.5.0) implemented in the OmicsBox under ab initio prediction mode, utilizing prediction models pre-trained specifically on Apis-specific gene structures. While direct transcriptomic evidence was not integrated during the prediction step, these ab initio models were subsequently validated and filtered through extensive sequence homology searches and domain consensus analyses. The resulting coding sequences (CDSs) were subsequently queried against the NCBI non-redundant (nr) protein database using BLASTx with an e-value significance threshold of 1×10⁻⁵ and a maximum of 20 database hits retained per sequence (Altschul et al., 1997; Sayers et al., 2025). Concurrently, functional domains, family signatures, and active sites were identified in silico by running InterProScan (v5.72-103.0) against multiple signature databases, including NCBIfam, SFLD, PANTHER, HAMAP, ProSite Profiles, CDD, PRINTS, Pfam, PIRSF, SUPERFAMILY, Gene3D, AntiFam, FunFam, and PIRSR (Jones et al., 2014). Gene Ontology (GO) terms representing three primary domains-Biological Process (BP), Molecular Function (MF), and Cellular Component (CC)-were assigned by merging the BLASTp mapping results and InterProScan domain annotations within the OmicsBox suite (Consortium, 2004). Enzyme Commission (EC) numbers were also mapped to sequences containing valid metabolic enzyme signatures. To perform high-resolution functional profiling, direct GO term counts (capturing levels 3 to 7+) were extracted from the annotation outputs for each strain (e.g., go_count_bp.txt, go_count_mf.txt, and go_count_cc.txt) to examine granular functional differences. For comparative genomic analyses, GO level 2 distribution counts were normalized as percentages of the total GO-annotated genes within each strain to account for variations in gene-space prediction sizes. To determine if the overall functional landscape varied significantly among the seven honeybee breeding lines, a Chi-square (χ2) test of independence was applied to the GO term contingency table. Subsequently, a two-tailed Welch’s t-test (independent t-test with unequal variances) was performed to identify specific GO categories exhibiting statistically significant differences (p<0.05) between A. cerana (n=2) and A. mellifera (n=5). Finally, a Z-score outlier analysis was conducted across the seven strains to identify unique, lineage-specific functional expansions (Z>2.0). All statistical calculations, Welch’s t-tests, and high-resolution multi-panel bar charts and heatmaps were executed in Python (v3.10) using scipy.stats, matplotlib, and seaborn libraries.
8. Phylogenetic analysis
To confirm the genetic identity and evolutionary relationships of the seven sequenced strains, we performed phylogenetic analysis based on complete mitochondrial genomes. The consensus contigs were assembled by NextDenovo (v2.5.2) from the selected HiFi reads corresponding to the bee reference mitochondrial genome, followed by concatenation using in-house perl script. The draft mitocondrial genome was completed to the circular form and polished using HiFi long reads by NextPolish (v1.4.1). The assembled mitochondrial genome was set to start from the same location with NC_014295.1 (A. cerana) or NC_051932.1 (A. mellifera). Mitochondrial genome sequences from the seven Korean strains were aligned with publicly available mitogenomes representing major Apis species and A. mellifera subspecies, including A. m. ligustica, A. m. carnica, A. m. mellifera, A. m. anatoliaca, and A. cerana japonica. To provide an evolutionary context, we included several Apis species as reference taxa (A. florea, A. andreniformis, A. dorsata, A. laboriosa). Multiple sequence alignment was performed using MAFFT v7.526 with the FFT-NS-2 algorithm. Phylogenetic trees were inferred using maximum likelihood (ML) in IQ-TREE v2.4.0 with 1,000 ultrafast bootstrap replicates to assess node support (Nguyen et al., 2015). The best-fit substitution model was selected based on the Bayesian Information Criterion (BIC). Trees were rooted using Bombus ignitus (GenBank accession: DQ870926) as the outgroup and visualized using FigTree v1.4.5 and MEGA11 (Katoh and Standley, 2013).
RESULTS
1. Geographic isolation and genetic background of conserved Apis breeding lines
Seven honeybee strains were successfully collected from two primary locations in Jeollabuk-do Province, South Korea: the Wido Isolated Breeding Station in Buan-gun and the National Institute of Agricultural Sciences in Jeonju. The five A. mellifera strains represented three major European subspecies: Italian bees (A. m. ligustica: Am-A, Am-C, Am-F), Carpatica/Carniolan-type bees (Am-D), and Carniolan bees (A. m. carnica: Am-V). The two A. cerana strains (Ac-R, Ac-X) were native Korean honeybees. All strains are registered in the Korean National Seed Bank and maintained under controlled breeding conditions to preserve genetic purity and prevent introgression from external populations. More than 50 individuals per strain were collected to ensure adequate sampling of within-colony genetic diversity.
2. High-depth long-read sequencing metrics and comparative performance of de novo genomic assemblers
PacBio HiFi sequencing on the Revio platform generated high-quality long-read data for all seven strains (Supplementary Table 1). The total number of HiFi reads per strain ranged from 777,008 (Am-C) to 1,116,667 (Am-V), corresponding to total yields of 10.35-12.45 Gbp. Read length N50 values ranged from 10,247 bp (Ac-R) to 17,038 bp (Am-C), with a median of approximately 13-14 kb for most strains. Median read quality scores were exceptionally high, ranging from Q36 to Q39, with 100% of reads exceeding Q20 (99% accuracy), 69-80% exceeding Q30 (99.9% accuracy), and 28-46% exceeding Q40 (99.99% accuracy). These quality metrics confirm the suitability of the HiFi data for high-fidelity genome assembly. The sequencing depth for each strain was estimated at approximately 45-55× coverage based on total yield and expected genome sizes (approximately 230 Mbp for A. mellifera and 220 Mbp for A. cerana). This exceeds the target coverage of 20× and provides substantial redundancy for accurate contig assembly and variant calling.
To evaluate assembly quality across the seven bee strains, we performed de novo assembly using two different long-read assemblers: NextDenovo and Hifiasm (Table 1). The resulting contig-level statistics showed distinct differences in total assembly size, contig numbers, and N50 lengths between the two methods. For the A. mellifera strains, NextDenovo generated assemblies with total sizes ranging from 226.96 Mb (Am-F) to 233.15 Mb (Am-D), comprised of 65 to 91 contigs. The contig N50 values for these assemblies ranged from 9.03 Mb (Am-D) to 11.63 Mb (Am-A). In comparison, Hifiasm produced larger assembly sizes for the same strains, ranging from 264.31 Mb (Am-F) to 278.97 Mb (Am-A), with higher contig counts ranging from 287 to 486, although it yielded contig N50 values between 12.31 Mb (Am-C) and 14.23 Mb (Am-A). In the A. cerana strains, the variance between the two assemblers was more pronounced. NextDenovo assembled the Ac-R and Ac-X genomes into 130 contigs (Size: 216.05 Mb, N50: 6.00 Mb) and 62 contigs (Size: 218.37 Mb, N50: 10.63 Mb), respectively. Conversely, Hifiasm assemblies for Ac-R and Ac-X resulted in substantially larger total sizes of 513.74 Mb and 508.36 Mb, with contig numbers increasing to 4,207 and 1,875, and contig N50 values of 1.21 Mb and 1.78 Mb, respectively. Based on the total assembly sizes and contig continuity metrics, the NextDenovo assemblies were selected as the representative genomes for all seven strains and utilized for subsequent downstream analyses.

Comparative summary of genome assembly metrics between NextDenovo and Hifiasm pipelines
3. Pore-C facilitated chromosomal scaffolding and species-specific scaffold length polymorphisms
The final chromosome-level assemblies captured a total length ranging from 207.68 Mb (Ac-R) to 223.22 Mb (Am-C) (Table 3). For all seven strains, the genomic sequences were successfully anchored into 16 major pseudomolecules, which precisely corresponds to the haploid chromosome number (n=16) of the genus Apis (Fig. 1, Supplementary Table 2). The genome-wide Pore-C interaction heatmaps demonstrated highly organized diagonal contact intensities with 16 distinct interaction blocks, validating the structural accuracy and continuity of the chromosomal scaffolding. The length distribution of the 16 chromosome-level scaffolds exhibited high consistency within each species, while displaying distinct species-specific profiles between A. mellifera and A. cerana. The five A. mellifera strains (Am-A, Am-C, Am-D, Am-F, and Am-V) showed nearly identical chromosomal length profiles across all lineages. In these strains, Scaffold_1 represented the largest chromosome, with lengths consistently clustered between 27.75 Mb and 27.79 Mb, whereas the smallest chromosome, Scaffold_16, ranged from 7.58 Mb to 7.63 Mb. The intermediate pseudo-molecules maintained highly uniform sizes among the five lineages, indicating strong structural conservation within the evaluated A. mellifera genomes. In contrast, the two A. cerana strains (Ac-R and Ac-X) presented intra-species variation in specific scaffold sizes compared to A. mellifera. In the Ac-R genome, Scaffold_1 measured 21.05 Mb, which was notably shorter than the 26.97 Mb observed in Ac-X. Conversely, Scaffold_2 and Scaffold_3 in Ac-R were 20.59 Mb and 18.01 Mb, respectively, both of which were larger than the corresponding scaffolds in Ac-X, which measured 17.17 Mb and 15.84 Mb. For the remaining pseudo-molecules from Scaffold_4 through Scaffold_16, both strains maintained comparable length distributions, with Scaffold_16 terminating at approximately 7.05 Mb for Ac-R and 7.26 Mb for Ac-X. These chromosomal statistics and the clear separation of the 16 contact matrices confirm that the assemblies achieved high-fidelity, chromosome-scale resolution suitable for subsequent downstream investigations.
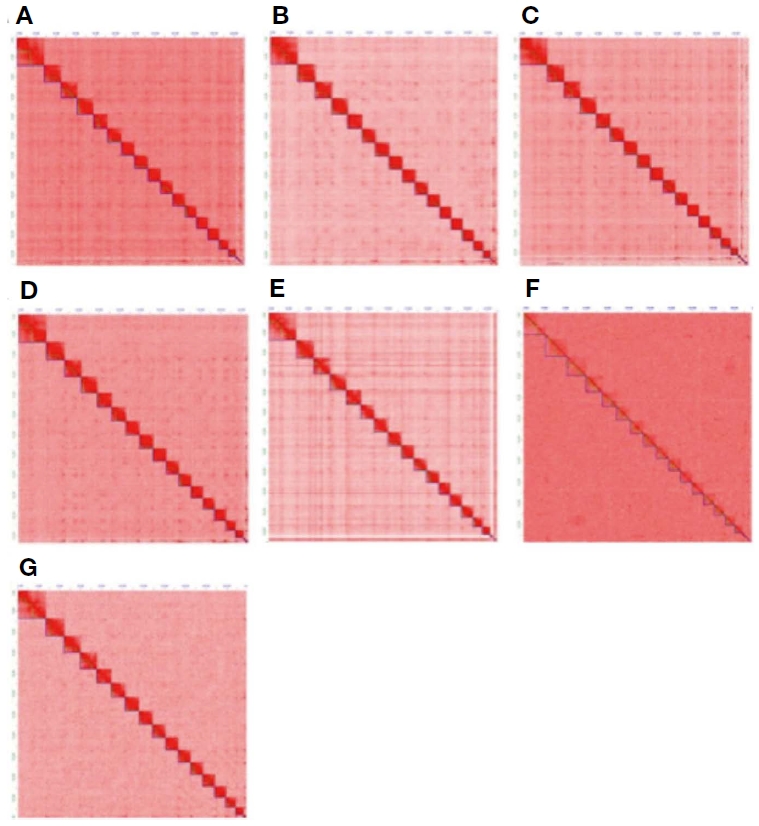
Genome-wide Pore-C interaction heatmaps of seven reconstructed honeybee (Apis) strains. The individual contact matrices illustrate the chromatin interaction densities across the chromosome-level genome assemblies for five A. mellifera lineages-Am-A, Am-C, Am-D, Am-F, and Am-V-and two A. cerana lineages-Ac-R and Ac-X. The color intensity or pixel density reflects the frequency of localized physical genomic interactions, with the brightest diagonal signals representing contiguous genomic blocks. For all seven strains, the contact matrices display 16 sharply resolved, discrete interaction blocks along the diagonal axes. This configuration aligns precisely with the haploid chromosome number (n=16) characteristic of the genus Apis, validating the structural completeness, high continuity, and robust anchoring of the de novo scaffolded pseudo-molecules without significant inter-chromosomal misassembles.
4. Assessment of biological completeness and gene-space quality via ortholog verification
To evaluate the biological completeness and gene-space quality of the final scaffolded assemblies, a BUSCO analysis was performed using a core set of 6,507 orthologs (Table 2). The assessment demonstrated exceptionally high and uniform completeness across all seven evaluated bee genomes, with no significant structural or gene-content variation observed between the species or strains. For the A. mellifera strains, the total percentage of complete BUSCOs was remarkably consistent, ranging from 98.1% in Am-A, Am-C, Am-D, and Am-F to 98.2% in Am-V. Within these complete orthologs, single-copy genes accounted for 98.0% to 98.1% of the total dataset, while duplicated BUSCOs remained extremely low at a mere 0.1% (4 to 6 genes) for all five strains. The fraction of fragmented and missing BUSCOs was also tightly constrained, spanning only 0.5% (30 to 31 genes) and 1.4% to 1.5% (89 to 95 genes), respectively. A similarly high level of genomic completeness was observed in the A. cerana strains, with both Ac-R and Ac-X achieving a total complete BUSCO rate of 98.1%. Single-copy BUSCOs reached 98.0% for Ac-R and 97.9% for Ac-X, accompanied by a low duplication rate of 0.1% (7 and 8 genes, respectively). The fragmented genes constituted 0.5% to 0.6%, and the missing orthologs accounted for a minor fraction of 1.4% in both genomes.
BUSCO assessment results of genome assemblies for Apis mellifera and Apis cerana strains using the apoidea_odb12 lineage dataset
5. Structural gene prediction fidelity and functional Gene Ontology (GO) profiling
Following the chromosome-level scaffolding, structural gene prediction and functional annotation were performed to evaluate the coding potential of the seven assembled genomes (Table 3). The total number of predicted protein-coding genes ranged from 6,860 (Ac-X) to 6,915 (Ac-R) in A. cerana, and from 7,261 (Am-F) to 8,751 (Am-D) in A. mellifera. To evaluate the accuracy of the de novo gene prediction models, the predicted gene sets were cross-referenced against multiple public functional databases, exhibiting exceptionally high homology rates. Across all seven strains, approximately 97% to 98% of the total predicted genes were successfully validated through alignment against the NCBI non-redundant (nr) database. Specifically, the nr mapping rates spanned from 97.20% (Ac-X) to 97.24% (Ac-R) for A. cerana, and from 96.94% (Am-A) to 97.58% (Am-V) for A. mellifera. Furthermore, protein domain analysis using InterProScan (IPS) successfully identified known functional domains in 65.71% to 66.22% of the A. cerana genes and 66.56% to 67.64% of the A. mellifera genes. The integrated functional annotation pipeline culminated in successful Gene Ontology (GO) term assignment. Through the merging of IPS and blast-derived annotations, approximately 90% of the entire predicted gene complements were successfully assigned definitive GO terms. The merged GO annotation rates were highly uniform across all lineages, ranging from 89.75% to 90.45% in A. cerana and from 89.40% to 90.13% in A. mellifera. This high proportion of functionally characterized genes, combined with the comprehensive database alignment rates, demonstrates that the de novo gene prediction pipeline achieved substantial structural integrity without major sequence fragmentation or gene loss, confirming the high quality of the final genome annotations.
Summary of genome functional annotation metrics for Apis mellifera and Apis cerana strains
To further characterize the functional distribution of the annotated genes, the assigned GO terms were classified into Level 2 categories under three main ontologies: Biological Process (BP), Molecular Function (MF), and Cellular Component (CC) (Fig. 2). The overall distribution of GO terms exhibited a highly synchronized and consistent pattern across all seven evaluated strains. Within the Biological Process category, cellular process emerged as the most predominant term, encompassing approximately 76% of the GO-annotated genes in all lineages. This was followed by biological regulation and regulation of biological process, which consistently accounted for roughly 27-29% and 26-28% of the functional repertoire, respectively. Other well-represented BP subcategories included localization (~18%) and response to stimulus (~15%), demonstrating a highly uniform allocation of biological roles across both A. mellifera and A. cerana genomes. In the Molecular Function domain, binding and catalytic activity constituted the most dominant functional assignments. The binding category represented the largest fraction, with a stable proportion of approximately 83% across all seven strains. Catalytic activity was the second most abundant function, ranging between 39% and 47% of the annotated coding space. The remaining MF subcategories, such as transporter activity, transcription regulator activity, and ATP-dependent activity, presented identical hierarchical rankings and minor percentage variations among the lineages. For the Cellular Component ontology, the annotated genes were heavily concentrated in two primary structural categories: cellular anatomical structure, which represented over 80% of the annotated pool, and protein-containing complex, which comprised approximately 21-23% of the genes across all strains. The negligible divergence in GO term densities and distribution patterns across the entire dataset underlines that despite the genomic variance and lineage-specific divergence observed in structural statistics, the fundamental core proteome and functional machinery remain strictly conserved between A. mellifera and A. cerana.
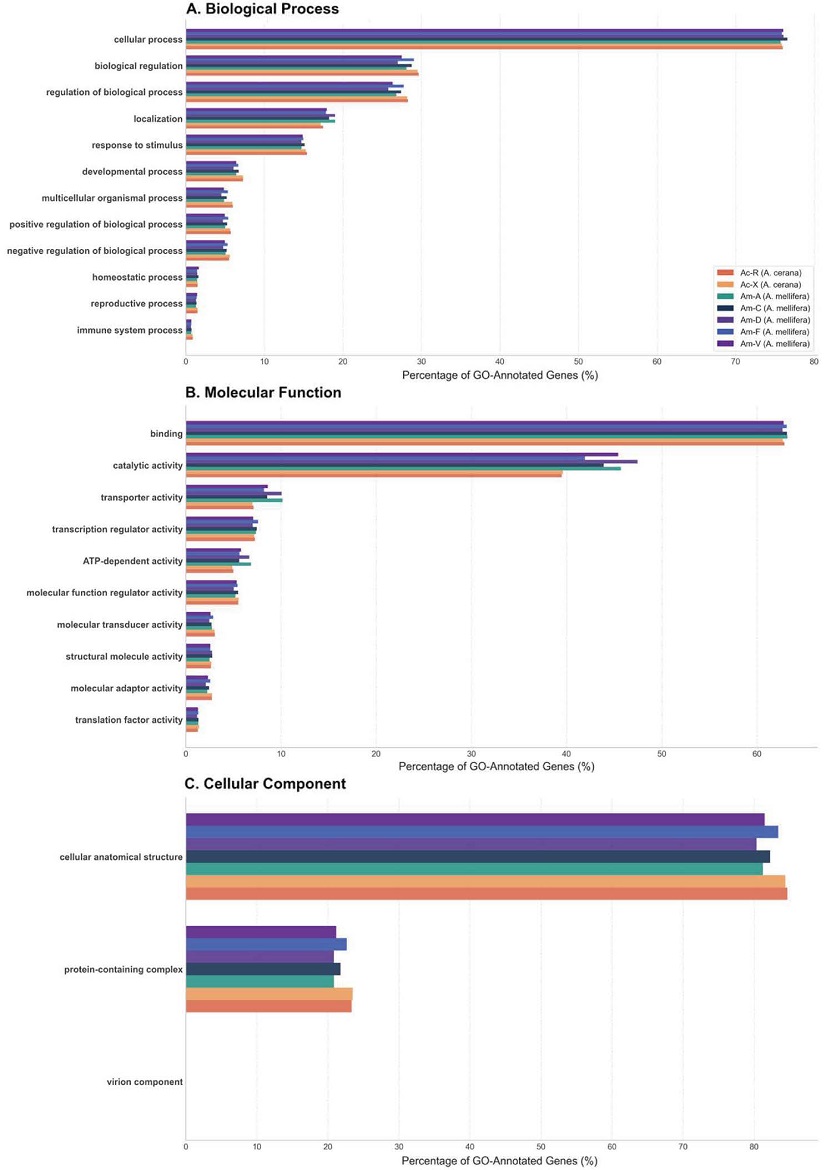
Gene Ontology (GO) Level 2 functional classification of annotated protein-coding genes across seven Apis strains. The bar charts illustrate the distribution and percentage of functional categories annotated within the genomes of five A. mellifera strains (Am-A, Am-C, Am-D, Am-F, and Am-V) and two A. cerana strains (Ac-R and Ac-X). The classification is divided into three primary ontologies: (A) Biological Process, (B) Molecular Function, and (C) Cellular Component. The horizontal axis indicates the percentage of total GO-annotated genes within each individual lineage. Color-coded bars represent specific honeybee lineages, as defined in the species legend box. Comparative distribution displays a highly conserved and uniform functional landscape across all evaluated genomes, highlighting the stable retention of core physiological and metabolic machinery within the genus Apis.
6. Comparative functional enrichment and strain-specific toxicological and adaptive outliers
To capture functional variations within the conserved genomic architecture, a comparative enrichment analysis of GO Level 2 terms was conducted using Fisher’s exact test, followed by Benjamini-Hochberg False Discovery Rate (FDR) correction (adjusted p<0.05), based on the pooled counts of annotated genes across all genomes (Fig. 3A, Supplementary Table 3). A. cerana genomes exhibited significant enrichment in pathways associated with cellular anatomical structure (+2.88%, adjusted p<0.001) and protein-containing complexes (+2.02%, adjusted p<0.001). This structural profile was further associated with enrichment in biological regulation (+1.57%, adjusted p=0.005), developmental processes (+0.84%, adjusted p=0.007), and regulation of biological processes (+1.45%, adjusted p=0.009). Conversely, A. mellifera genomes were significantly enriched in categories driving metabolic efficiency and transport. The most pronounced divergence was observed in catalytic activity, which showed a significant difference of 5.42% relative to A. cerana (adjusted p<0.001). Additionally, transporter activity was significantly enriched in A. mellifera (2.10%, adjusted p<0.001), along with ATP-dependent activity (1.18%, adjusted p<0.001) and localization (1.10%, adjusted p=0.024).
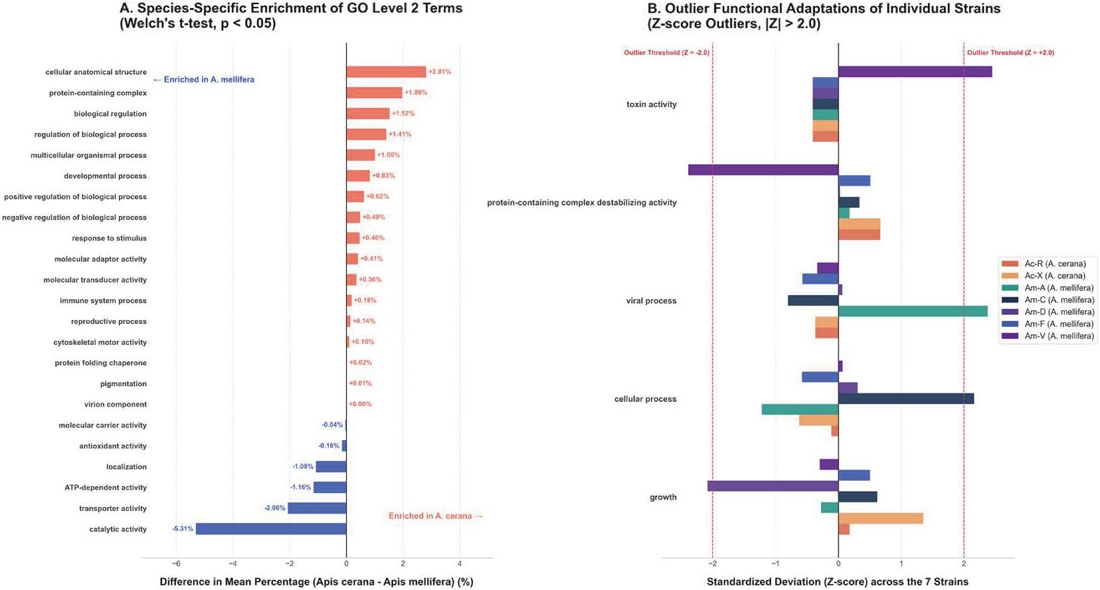
Comparative enrichment and strain-specific outlier analyses of GO Level 2 terms among Apis lineages. (A) Species-specific functional enrichment under Fisher’s exact test (FDR-adjusted p<0.05). The horizontal axis displays the difference in the relative percentage of annotated genes between A. cerana and A. mellifera (MeanAc - MeanAm). Red bars extending to the right represent functional categories significantly enriched in A. cerana, while blue bars extending to the left indicate categories significantly overrepresented in A. mellifera. Statistical significance levels (p-values) and mean difference values are explicitly labeled on individual bars. (B) Outlier functional adaptations of individual strains based on Z-score profiling across the seven genomes. The horizontal axis represents the standardized deviation (Z-score) of GO term proportions for each strain against the group mean. Vertical red dashed lines denote the statistical outlier thresholds (|Z|=2.0). Color-coded bars mirror the specific honeybee lineages indicated in the color key. Prominent lineage-specific signatures are highlighted, including the acute elevation of toxin activity in the Am-V strain (Z=2.45), revealing highly localized and specialized evolutionary selection pressures acting upon individual genomic landscapes.
Beyond the species-level evolutionary divergence, a standardized Z-score analysis (|Z|>2.0) was deployed to screen for strain-specific functional outliers across the seven evaluated lineages (Fig. 3B). This filtration identified localized genomic configurations unique to individual bee strains that deviated significantly from the crosslineage baseline. A distinct functional outlier signature was captured in the A. mellifera Carniolan-derived strain, Am-V, which displayed a pronounced statistical overrepresentation specifically within the toxin activity category (Z=2.45). Furthermore, the Z-score profiling revealed positive deviations shared between the two Carniolan lineages, Am-D and Am-V, in specific somatic and metabolic categories. In the Z-score distribution of these two strains, this profile was characterized by the statistically significant overrepresentation of crucial metabolic and xenobiotic detoxification gene families, including cytochrome P450 monooxygenases. The quantitative convergence of these amplified detoxification pathways and metabolic homeostasis categories was uniquely localized to the Am-D and Am-V datasets compared to the other three western honeybee lineages.
7. Mitochondrial genome characterization and phylogenetic placement
To determine the maternal lineages and evolutionary origins of the seven honeybee strains, we successfully reconstructed their complete, gapless circular mitochondrial genomes utilizing the high-fidelity long reads from the PacBio Revio platform. The assembled mitogenomes exhibited highly conserved structural architectures and species-specific length distributions (Supplementary Table 4). The two A. cerana strains (Ac-R and Ac-X) possessed concise genomes ranging from 16,224 bp to 16,247 bp. In comparison, the five A. mellifera strains (Am-A, Am-C, Am-D, Am-F, and Am-V) displayed slightly larger but exceptionally uniform sizes, spanning from 16,515 bp to 16,576 bp. All seven mitogenomes exhibited an extreme AT-bias, with the total AT content ranging between 84.29% and 85.09%.
To evaluate the phylogenetic positions of these lineages, a comprehensive 65-taxon Maximum Likelihood (ML) phylogenetic tree was constructed based on the complete mitogenome sequences (Fig. 4, Supplementary Table 5). The phylogenetic topology revealed a clear genetic dichotomy that separated the eastern and western honeybee lineages into distinct, well-supported geographic clades. The two Korean A. cerana genebank strains (Ac-R and Ac-X) clustered together with absolute bootstrap support within the mainland East Asian continental clade (y=1.0 to 9.0 region), positioning adjacent to reference accessions from China and India. Notably, this mainland continental clade was phylogenetically distinct from the Japanese A. cerana lineage (AP017985), as well as from other wild genetic resources native to Southeast and Southwest Asia. Conversely, the five A. mellifera strains maintained by the national genebank (Am-A, Am-C, Am-D, Am-F, and Am-V) were unequivocally assigned to the European C-lineage (y=23.0 to 38.0 region), which encompasses major Mediterranean and Eastern European subspecies such as A. m. carnica and A. m. ligustica. Although all five strains anchored firmly within the C-lineage, they exhibited subtle branch-length variations and distinct sub-clade bifurcations, revealing a meaningful degree of intra-lineage genetic diversity. Particularly, the Am-C strain clustered closely with Eastern Mediterranean gene pools, including the A. m. anatoliaca subspecies, in addition to the typical Western European references.
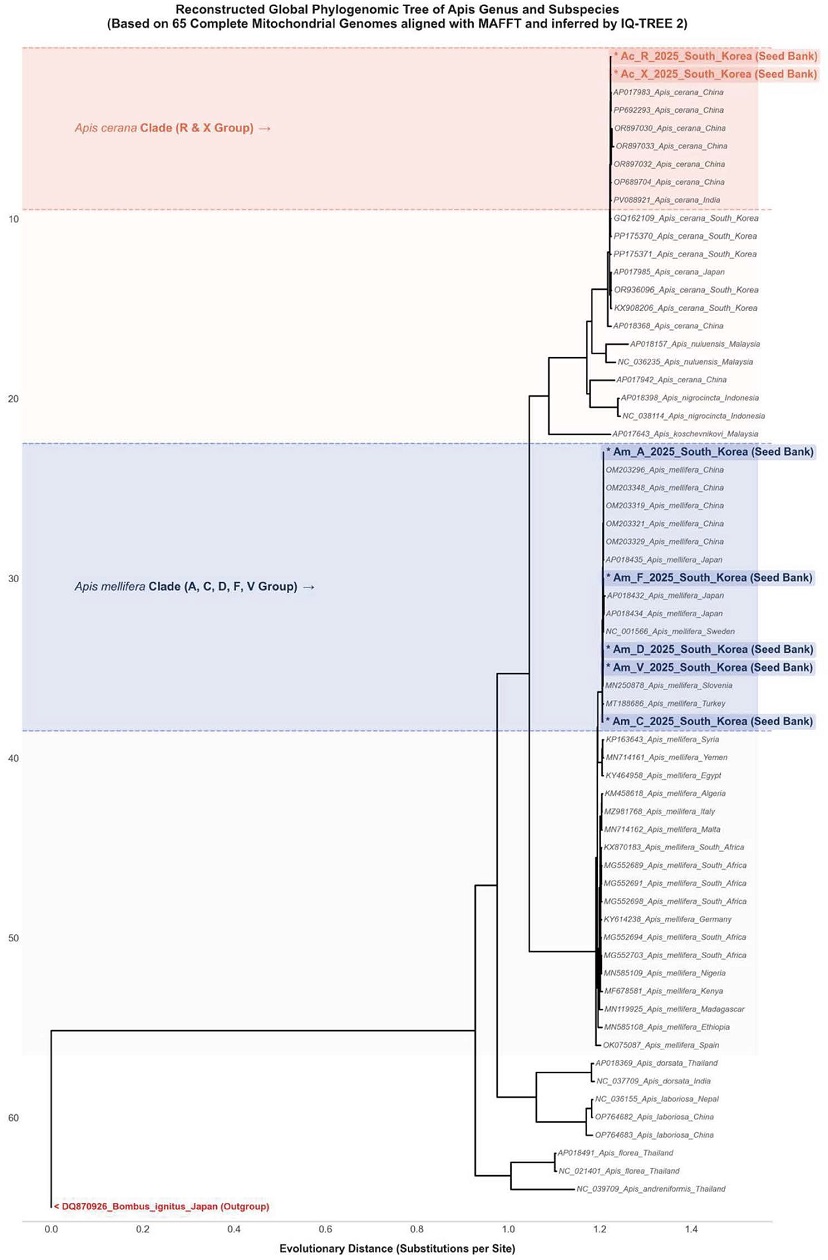
Reconstructed global phylogenomic tree of the genus Apis and its subspecies based on complete mitogenomes. The Maximum Likelihood (ML) phylogenetic topology was inferred using IQ-TREE 2 based on the alignment of 65 complete mitochondrial genomes via MAFFT. Bombus ignitus (GenBank accession: DQ870926) was utilized as the evolutionary outgroup to root the tree. The horizontal scale bar at the bottom indicates the evolutionary distance, measured in substitutions per site. The red shaded box highlights the A. cerana continental clade (y=1.0 to 9.0 region), positioning the two Korean seed bank strains (Ac-R and Ac-X, marked with asterisks) strictly within the mainland East Asian lineage alongside Chinese and Indian accessions. The blue shaded box outlines the A. mellifera evolutionary lineage (y=23.0 to 38.0 region), mapping the five Korean seed bank strains (Am-A, Am-C, Am-D, Am-F, and Am-V, marked with asterisks) exclusively into the European C-lineage group.
To overcome the maternal-inheritance limitation of mitochondrial phylogeny and confirm nuclear breeding-line integrity, we also performed a whole-genome nuclear distance comparison using Mash (k=21, s=10,000) (Supplementary Fig. 1). The nuclear distance matrix revealed a clear genetic divergence between A. cerana and A. mellifera strains (average distance of 0.058, equivalent to 94.2% Average Nucleotide Identity [ANI]). Within species, the nuclear pairwise distances were tightly constrained (~0.005 distance, 99.5% ANI), with the two Korean A. cerana seed bank strains (Ac-R and Ac-X) clustering closely together. This dual phylogenomic validation confirms the genetic purity, breed integrity, and maternal-paternal lineage stability of all seven national seed bank repositories.
DISCUSSION
In this study, we established a definitive, chromosome-scale genomic framework for seven economically and ecologically vital honeybee strains maintained by the national seed bank of South Korea. Utilizing the high-fidelity long reads of the PacBio Revio platform coupled with Pore-C chromosomal conformation capture, we overcame the long-standing computational bottlenecks associated with assembling highly heterozygous, AT-rich (>84%), and repeat-dense aculeate genomes (Elsik et al., 2014; Wallberg et al., 2019). While alternative assembly strategies like Hifiasm suffered from severe pseudo-haplotypic inflation and sequence fragmentation-particularly in the A. cerana lineages-our optimized Next Denovo pipeline successfully resolved the genomic architectures into the exact haploid chromosome count (n=16) with exceptional continuity (contig N50 up to 11.63 Mb). Furthermore, this high structural accuracy directly translated into superior downstream gene predictions, yielding complete functional annotations for approximately 90% of the entire coding space without structural fragmentation or gene-space loss. This technical leap, combined with the successful gapless reconstruction of complete circular mitogenomes, marks the first time that the core genetic repositories of both A. mellifera and A. cerana in Korea have been mapped with such exhaustive completeness.
The innovation of these datasets extends far beyond technical precision, serving as a foundational digital infrastructure for precision breeding and adaptive evolutionary genomics. Historically, honeybee genomic initiatives have been constrained by fragmented reference templates, which inherently introduce systemic biases during structural variant calling and functional pathway profiling (Wallberg et al., 2014; Howe et al., 2021). By delivering highly curated, line-specific chromosome-level assemblies, this study provides an un-biased genomic ledger to trace fine-scale functional adaptations and evolutionary divergence between eastern and western honeybee species. As apiculture faces accelerating threats from climate change, habitat loss, and emerging pathogens, these high-fidelity genomes offer the precise molecular resolution needed to dissect complex physiological networks, such as temperature-induced metabolic shifts and sensory-mediated pest resistance (Potts et al., 2010; Goulson et al., 2015). Consequently, these genomic data establish an indispensable reference framework that underpins future molecular breeding platforms, facilitating the strategic conservation and sustainable utilization of regional honeybee genetic resources.
1. Chromosome-scale length variations and implications for population divergence
A compelling structural finding in our genomic survey was the intra-species scaffold length variance observed between the two A. cerana lineages, Ac-R and Ac-X. Specifically, scaffold_1 in Ac-R was found to be approximately 5.92 Mb shorter than its homologue in Ac-X, whereas scaffold_2 and scaffold_3 in Ac-R exhibited reciprocal size increases of 3.42 Mb and 2.16 Mb, respectively. It is critical to underscore that while formal structural variant (SV) discovery pipelines-such as long-read split-mapping or optical mapping-were not deployed in the current study, these macro-level length disparities captured via Pore-C scaffolding provide indirect yet tangible genomic signatures of large-scale chromosomal rearrangements. In hymenopteran genomics, such pronounced chromosomal length discrepancies among closely related allopatric or sympatric populations typically point to massive structural modifications, most notably chromosomal inversions, translocations, or the localized lineage-specific accumulation of transposable elements (TEs) (Kapusta et al., 2017; Mérot et al., 2020). Large chromosomal inversions, for instance, frequently act as evolutionary “supergenes” by physically suppressing meiotic recombination between divergent lineages (Wellenreuther and Bernatchez, 2018). This recombination barrier locks adaptive allele complexes together, allowing populations to maintain distinct ecological phenotypes-such as specialized overwintering strategies, foraging behaviors, or predatory defense mechanisms-despite potential gene flow (Wallberg et al., 2017).
Given that Ac-R and Ac-X represent distinct indigenous conservation lines within the Korean peninsula, the identified polymorphic regions on scaffolds 1, 2, and 3 stand out as primary candidates for maintaining unique agronomic traits. To transition from these macro-structural observations to definitive mechanistic insights, a comprehensive, high-resolution SV profiling initiative utilizing long-read graph-pangenome mapping remains an essential next step (Koren et al., 2018; Garg et al., 2021). Characterizing the exact breakpoints and sequence content of these polymorphic blocks will be paramount to unlocking the genetic basis of fine-scale adaptive divergence in Korean A. cerana, directly empowering marker-assisted precision breeding and regional ecotype preservation (Meuwissen et al., 2001; Brascamp et al., 2018).
2. Species- and strain-specific functional divergence and phenotypic correlates
The comparative statistical framework identified targeted functional shifts that suggest potential genomic underpinnings for long-observed phenotypic, behavioral, and agronomic disparities between eastern and western honeybees, although direct links between broad GO Level 2 terms and complex phenotypes require cautious interpretation. The enrichment of biological regulation and regulation of biological process in A. cerana may reflect its complex regulatory adaptations. Historically, A. cerana has demonstrated remarkable ecological resilience against devastating endemic parasites and pathogens, such as Varroa mites and the Sacbrood virus, largely driven by highly specialized hygienic behaviors including intensive grooming and targeted removal of infected brood (Boecking and Genersch, 2008; Oxley et al., 2010). While broad GO categories such as response to stimulus or immune system process do not show significant species-wide expansion in overall gene counts under strict FDR correction, the specific gene families nested within these categories-including chemosensory receptors and specific immune signaling cascades detailed in subsequent sections-provide the precise molecular repertoire supporting these rapid, systemic responses. Furthermore, the robust representation of cellular and regulatory pathways provides a plausible genetic background that may facilitate the acute behavioral vigilance of A. cerana, potentially modulating rapid colony-level alarm signaling and collective defensive tactics-such as heat-balling behaviors-when encountering aggressive native predators like Vespa mandarinia (Tan et al., 2012).
Conversely, the genomic architecture of A. mellifera appears evolutionarily tailored toward maximized metabolic output and resource acquisition. The pronounced enrichment in catalytic activity (adjusted p<0.001, -5.42%) and transporter activity (adjusted p<0.001, -2.10%) provides a compelling genetic framework that may underlie the high foraging efficiency and commercial productivity that define the western honeybee (Wallberg et al., 2014; Uzunov et al., 2017). These metabolic expansions suggest a potentially intensified enzymatic machinery dedicated to rapid carbohydrate processing, ATP-driven flight-energy generation, and systemic nutrient transport (Foret et al., 2012; Kapheim et al., 2015). This amplified metabolic throughput directly translates into the extended foraging ranges, prolonged flight capacities, and superior honey-storing behaviors observed in agricultural settings, reflecting the plausible historical selection pressures that favored high-yield traits in A. mellifera (Harpur et al., 2012).
At the intra-species level, the standardized Z-score filtering successfully exposed localized, hyper-specialized adaptations within individual commercial lines, most notably in the Carniolan-derived genotypes. The sharp statistical deviation in the toxin activity category observed exclusively in the Am-V strain (Z=2.45) marks it as an evolutionary outlier. Detailed sequence analysis of the genes driving this category in Am-V revealed a combination of host defensive peptides and gut symbiont sequences. Specifically, we identified omega-conotoxin-like protein 1 (also known as inhibitor cysteine knot peptide), a eukaryotic disulfide-rich peptide known to be involved in arthropod defense and venom. However, the outlier status was also driven by the presence of two co-assembled hypothetical proteins from the honeybee gut symbiont Snodgrassella alvi (Supplementary Table 6). This indicates that the apparent statistical enrichment of toxin activity in Am-V is a composite signature, reflecting both host defense genes and co-assembled symbiotic microbiome elements rather than a massive host-specific duplication of venom components. Furthermore, the distinct functional configurations shared by the Carniolan sister strains, Am-D and Am-V, provide a molecular link to their renowned overwintering capacity and cold hardiness (Büchler et al., 2014). Cross-strain copy number comparisons of the Cytochrome P450 (CYP) gene family (Supplementary Table 7) revealed highly conserved profiles across all seven strains, with 18 genes in A. cerana and 19 to 21 genes in A. mellifera (Am-A: 19, Am-C: 21, Am-D: 20, Am-F: 21, Am-V: 21), indicating that no gene family expansion occurred in the Carniolan strains. Thus, their cold-adaptation capabilities are likely regulated through transcriptional modulation of these conserved detoxifying pathways and metabolic homeostatic systems, rather than genomic copy number expansion. This conserved enzymatic buffer, combined with lineage-specific expression dynamics, equips these specific lineages to effectively mitigate low-temperature stress and cellular toxicity (Guarna et al., 2017), contributing to their survival rates during harsh wintering periods.
3. Phylogeographic origins and genetic identity of national repositories
The gapless reconstruction of complete circular mitogenomes and the subsequent 65-taxon phylogenomic mapping provide unequivocal maternal evolutionary contexts for the honeybee genetic resources conserved in South Korea. For the indigenous eastern honeybee strains, Ac-R and Ac-X, their robust positioning within the mainland East Asian continental clade (y=1.0 to 9.0) settles a critical question regarding their phylogeographic ancestry (Radloff et al., 2010). By exhibiting a clear genetic divergence from the Japanese A. cerana lineage (AP 017985) and wild island ecotypes of Southeast Asia, our findings demonstrate that the Korean native bee repository shares a direct evolutionary trajectory with the mainland Eurasian continental stock (Takahashi et al., 2016; Nunn et al., 2022). This biogeographic assignment is highly congruent with multi-locus nuclear screening demonstrating that South Korean A. cerana stocks form a highly integrated, uniform temperate cluster alongside Russian Far East populations, sharply distinguished from tropical Southeast Asian ecotypes (Ilyasov et al., 2022; Kaskinova et al., 2022). Critically, this regional gene pool bears the molecular signatures of severe evolutionary bottlenecks and intense purifying selection driven by historical Sacbrood virus epidemics that previously eliminated up to 95% of the domestic colonies, validating our conserved seed bank strains as indispensable, highly screened genetic reservoirs for regional ecotype preservation. This continental genomic signature implies a shared ancestral adaptation to severe temperate seasonal fluctuations, serving as a highly valuable genetic baseline for the preservation of pure domestic ecotypes and the development of robust, climate-resilient local breeding lines (Chen et al., 2016).
Parallel to this, the phylogenomic clustering of the five western honeybee strains (Am-A, Am-C, Am-D, Am-F, and Am-V) exclusively within the European C-lineage (y=23.0 to 38.0) confirms the structural retention of their Mediterranean and Eastern European maternal ancestry (De la Rúa et al., 2009; Boardman et al., 2019). More importantly, the identification of micro-clade bifurcations and subtle branch-length variations among these five lines reveals that they do not constitute a homogenous, bottlenecked population. The close phylogenetic affinity of the Am-C strain toward Eastern Mediterranean gene pools, such as A. m. anatoliaca, alongside typical A. m. carnica or A. m. ligustica frameworks, serves as a molecular footprint of historical genetic admixture. Rather than representing isolated, singular western imports, these national conservation lines function as dynamic genetic reservoirs (Harpur et al., 2012, 2015). Over decades of localized maintenance, artificial selection, and selective breeding within the Korean peninsula, these strains have integrated diverse elite European genetic components. This hybrid-driven genomic plasticity likely accelerated their regional acclimatization, resulting in a unique, domestic-adapted gene pool tailored to the specific environmental and apicultural demands of South Korea.
CONCLUSION
Taken together, this study represents a major milestone in apicultural genomics by delivering the first comprehensive, chromosome-level reference atlas for both A. mellifera and A. cerana conservation lines in Korea. By overcoming historical assembly limitations through an optimized long-read and Pore-C integration pipeline, we successfully mapped their structural, functional, and mitogenomic landscapes with unprecedented fidelity. The distinct species-specific GO enrichments and the macro-structural variances identified across these lineages underscore the profound genetic potential available for strategic stock improvement. Looking forward, these high-resolution templates will serve as the indispensable digital infrastructure for next-generation precision breeding. They will enable the high-throughput development of molecular markers, the precise tracing of adaptive sensory-receptor repertoires (Kohno and Kubo, 2019), and the comprehensive mapping of metabolic stress pathways under shifting global climate regimes, ultimately ensuring the long-term sustainability and security of regional honeybee ecosystems (Allendorf et al., 2010; Spötter et al., 2012).
Acknowledgments
We sincerely express our gratitude to Soyeon Kang, Sanghee Um, and Hwayong An from the National Instrumentation Center for Environmental Management (NICEM) at Seoul National University for their dedicated technical support in high-molecular-weight DNA extraction, sequencing library preparation, and ONT Pore-C proximity-ligation sequencing assays. We also thank the staff of the Wido Isolated Breeding Station (Buan-gun, Jeollabuk-do) and the National Institute of Agricultural Sciences (Jeonju, Jeollabuk-do) for assistance with sample collection and maintenance of honeybee breeding lines. This research was funded by “The Cooperative Research Program for Agriculture Science & Technology Development” (Project No. RS-2025-02214782) from the Rural Development Administration, Republic of Korea. We declare no competing interests.
References
-
Allendorf, F. W., P. A. Hohenlohe and G. Luikart. 2010. Genomics and the future of conservation genetics. Nat. Rev. Genet. 11(10): 697-709.
[https://doi.org/10.1038/nrg2844]

-
Altschul, S. F., T. L. Madden, A. A. Schäffer, J. Zhang, Z. Zhang, W. Miller and D. J. Lipman. 1997. Gapped BLAST and PSI-BLAST: a new generation of protein database search programs. Nucleic Acids Res. 25(17): 3389-3402.
[https://doi.org/10.1093/nar/25.17.3389]
-
Boardman, L., A. Eimanifar, R. T. Kimball, E. L. Braun, S. Fuchs, B. Grünewald and J. D. Ellis. 2019. The mitochondrial genome of the Carniolan honey bee, Apis mellifera carnica (Insecta: Hymenoptera: Apidae). Mitochondrial DNA Part B 4(2): 3288-3290.
[https://doi.org/10.1080/23802359.2019.1671250]
-
Boecking, O. and E. Genersch. 2008. Varroosis - the ongoing crisis in bee keeping. J. Consum. Prot. Food Saf. 3(2): 221-228.
[https://doi.org/10.1007/s00003-008-0331-y]
- Brascamp, P. and P. Bijma. 2018. Methods to estimate genetic parameters and breeding values for honey bees. Genet. Sel. Evol. 50(1): 45.
-
Büchler, R., C. Costa, F. Hatjina, S. Andonov, M. D. Meixner, Y. L. Conte, A. Uzunov, S. Berg, M. Bienkowska and M. Bouga. 2014. The influence of genetic origin and its interaction with environmental effects on the survival of Apis mellifera L. colonies in Europe. J. Apic. Res. 53(2): 205-214.
[https://doi.org/10.3896/IBRA.1.53.2.03]
-
Chapman, N. C., B. A. Harpur, J. Lim, T. E. Rinderer, M. H. Allsopp, A. Zayed and B. P. Oldroyd. 2015. A SNP test to identify Africanized honeybees via proportion of ‘African’ ancestry. Mol. Ecol. Resour. 15(6): 1346-1355.
[https://doi.org/10.1111/1755-0998.12411]
-
Chen, C., Z. Liu, Q. Pan, X. Chen, H. Wang, H. Guo, S. Liu, H. Lu, S. Tian and R. Li. 2016. Genomic analyses reveal demographic history and temperate adaptation of the newly discovered honey bee subspecies Apis mellifera sinisxinyuan n. ssp. Mol. Biol. Evol. 33(5): 1337-1348.
[https://doi.org/10.1093/molbev/msw017]
-
Cheng, H., G. T. Concepcion, X. Feng, H. Zhang and H. Li. 2021. Haplotype-resolved de novo assembly using phased assembly graphs with hifiasm. Nat. Methods 18(2): 170-175.
[https://doi.org/10.1038/s41592-020-01056-5]
-
Consortium, G. O. 2004. The Gene Ontology (GO) database and informatics resource. Nucleic Acids Res. 32(suppl_1): D258-D261.
[https://doi.org/10.1093/nar/gkh036]
-
Crane, E. 1999. The world history of beekeeping and honey hunting. Routledge, New York. 704 pp.
[https://doi.org/10.4324/9780203819937]
-
De la Rúa, P., R. Jaffé, R. Dall’Olio, I. Muñoz and J. Serrano. 2009. Biodiversity, conservation and current threats to European honeybees. Apidologie 40(3): 263-284.
[https://doi.org/10.1051/apido/2009027]
-
Dudchenko, O., S. S. Batra, A. D. Omer, S. K. Nyquist, M. Hoeger, N. C. Durand, M. S. Shamim, I. Machol, E. S. Lander and A. P. Aiden. 2017. De novo assembly of the Aedes aegypti genome using Hi-C yields chromosome-length scaffolds. Science 356(6333): 92-95.
[https://doi.org/10.1126/science.aal3327]
-
Dudchenko, O., M. S. Shamim, S. S. Batra, N. C. Durand, N. T. Musial, R. Mostofa, M. Pham, B. Glenn St Hilaire, W. Yao and E. Stamenova. 2018. The Juicebox Assembly Tools module facilitates de novo assembly of mammalian genomes with chromosome-length scaffolds for under $1000. BioRxiv 254797.
[https://doi.org/10.1101/254797]
-
Elsik, C. G., K. C. Worley, A. K. Bennett, M. Beye, F. Camara, C. P. Childers, D. C. de Graaf, G. Debyser, J. Deng, B. Devreese, E. Elhaik, J. D. Evans, L. J. Foster, D. Graur, R. Guigo, K. J. Hoff, M. E. Holder, M. E. Hudson, G. J. Hunt, H. Jiang, V. Joshi, R. S. Khetani, P. Kosarev, C. L. Kovar, J. Ma, R. Maleszka, R. F. A. Moritz, M. C. Munoz-Torres, T. D. Murphy, D. M. Muzny, I. F. Newsham, J. T. Reese, H. M. Robertson, G. E. Robinson, O. Rueppell, V. Solovyev, M. Stanke, E. Stolle, J. M. Tsuruda, M. Van Vaerenbergh, R. M. Waterhouse, D. B. Weaver, C. W. Whitfield, Y. Wu, E. M. Zdobnov, L. Zhang, D. Zhu and R. A. Gibbs. 2014. Finding the missing honey bee genes: lessons learned from a genome upgrade. BMC Genom. 15: 86.
[https://doi.org/10.1186/1471-2164-15-86]
-
Foret, S., R. Kucharski, M. Pellegrini, S. Feng, S. E. Jacobsen, G. E. Robinson and R. Maleszka. 2012. DNA methylation dynamics, metabolic fluxes, gene splicing, and alternative phenotypes in honey bees. Proc. Natl. Acad. Sci. 109(13): 4968-4973.
[https://doi.org/10.1073/pnas.1202392109]
-
Frankham, R., J. D. Ballou and D. A. Briscoe. 2010. Introduction to conservation genetics. Cambridge University Press, Cambridge. 642 pp.
[https://doi.org/10.1017/CBO9780511809002]
-
Frunze, O., P. N. Akongte, D. Kim, E.-J. Kang, K. Kim, B.-S. Park and Y.-S. Choi. 2022. Remote honey bee breeding center in the Wido Island, the Republic of Korea. J. Apic. 37(2): 175-183.
[https://doi.org/10.17519/apiculture.2022.06.37.2.175]
-
Garg, S., A. Fungtammasan, A. Carroll, M. Chou, A. Schmitt, X. Zhou, S. Mac, P. Peluso, E. Hatas and J. Ghurye. 2021. Chromosome-scale, haplotype-resolved assembly of human genomes. Nat. Biotechnol. 39(3): 309-312.
[https://doi.org/10.1038/s41587-020-0711-0]
-
Goel, M., H. Sun, W.-B. Jiao and K. Schneeberger. 2019. SyRI: finding genomic rearrangements and local sequence differences from whole-genome assemblies. Genome Biol. 20(1): 277.
[https://doi.org/10.1186/s13059-019-1911-0]
-
Götz, S., J. M. García-Gómez, J. Terol, T. D. Williams, S. H. Nagaraj, M. J. Nueda, M. Robles, M. Talón, J. Dopazo and A. Conesa. 2008. High-throughput functional annotation and data mining with the Blast2GO suite. Nucleic Acids Res. 36(10): 3420-3435.
[https://doi.org/10.1093/nar/gkn176]
-
Goulson, D., E. Nicholls, C. Botías and E. L. Rotheray. 2015. Bee declines driven by combined stress from parasites, pesticides, and lack of flowers. Science 347(6229): 1255957.
[https://doi.org/10.1126/science.1255957]
-
Guarna, M. M., S. E. Hoover, E. Huxter, H. Higo, K.-M. Moon, D. Domanski, M. E. Bixby, A. P. Melathopoulos, A. Ibrahim and M. Peirson. 2017. Peptide biomarkers used for the selective breeding of a complex polygenic trait in honey bees. Sci. Rep. 7(1): 8381.
[https://doi.org/10.1038/s41598-017-08464-2]
-
Harpur, B., N. Chapman, L. Krimus, P. Maciukiewicz, V. Sandhu, Sood, J. Lim, T. Rinderer, M. Allsopp and B. Oldroyd. 2015. Assessing patterns of admixture and ancestry in Canadian honey bees. Insectes Soc. 62(4): 479-489.
[https://doi.org/10.1007/s00040-015-0427-1]
-
Harpur, B. A., S. Minaei, C. F. Kent and A. Zayed. 2012. Management increases genetic diversity of honey bees via admixture. Mol. Ecol. 21(18): 4414-4421.
[https://doi.org/10.1111/j.1365-294X.2012.05614.x]
-
Howe, K., W. Chow, J. Collins, S. Pelan, D.-L. Pointon, Y. Sims, J. Torrance, A. Tracey and J. Wood. 2021. Significantly improving the quality of genome assemblies through curation. GigaScience 10(1): giaa153.
[https://doi.org/10.1093/gigascience/giaa153]
-
Hu, J., J. Fan, Z. Sun and S. Liu. 2020. NextPolish: a fast and efficient genome polishing tool for long-read assembly. Bioinformatics 36(7): 2253-2255.
[https://doi.org/10.1093/bioinformatics/btz891]
-
Hu, J., Z. Wang, Z. Sun, B. Hu, A. O. Ayoola, F. Liang, J. Li, J. R. Sandoval, D. N. Cooper and K. Ye. 2024. NextDenovo: an efficient error correction and accurate assembly tool for noisy long reads. Genome Biol. 25(1): 107.
[https://doi.org/10.1186/s13059-024-03252-4]
-
Ilyasov, R. A., S. Rašić, J. Takahashi, V. N. Danilenko, M. Y. Proshchalykin, A. S. Lelej, V. N. Sattarov, P. H. Thai, R. Raffiudin and H. W. Kwon. 2022. Genetic relationships and signatures of adaptation to the climatic conditions in populations of Apis cerana based on the polymorphism of the gene vitellogenin. Insects 13(11): 1053.
[https://doi.org/10.3390/insects13111053]
-
Jones, P., D. Binns, H.-Y. Chang, M. Fraser, W. Li, C. McAnulla, H. McWilliam, J. Maslen, A. Mitchell and G. Nuka. 2014. InterProScan 5: genome-scale protein function classification. Bioinformatics 30(9): 1236-1240.
[https://doi.org/10.1093/bioinformatics/btu031]
-
Jung, C. and S. G. Lee. 2018. Beekeeping in Korea: Past, present, and future challenges. J. Apic. 33(2): 127-135.
[https://doi.org/10.1007/978-981-10-8222-1_8]
-
Kapheim, K. M., H. Pan, C. Li, S. L. Salzberg, D. Puiu, T. Magoc, H. M. Robertson, M. E. Hudson, A. Venkat and B. J. Fischman. 2015. Genomic signatures of evolutionary transitions from solitary to group living. Science 348(6239): 1139-1143.
[https://doi.org/10.1126/science.aaa4788]
-
Kapusta, A., A. Suh and C. Feschotte. 2017. Dynamics of genome size evolution in birds and mammals. Proc. Natl. Acad. Sci. 114(8): E1460-E1469.
[https://doi.org/10.1073/pnas.1616702114]
-
Kaskinova, M., L. Gaifullina, R. Ilyasov, A. Lelej, H. W. Kwon, P. H. Thai and E. Saltykova. 2022. Genetic structure of Apis cerana populations from South korea, Vietnam and the Russian Far East based on microsatellite and mitochondrial DNA polymorphism. Insects 13(12): 1174.
[https://doi.org/10.3390/insects13121174]
-
Katoh, K. and D. M. Standley. 2013. MAFFT Multiple Sequence Alignment Software Version 7: Improvements in Performance and Usability. Mol. Biol. Evol. 30(4): 772-780.
[https://doi.org/10.1093/molbev/mst010]
-
Klein, A.-M., B. E. Vaissière, J. H. Cane, I. Steffan-Dewenter, S. A. Cunningham, C. Kremen and T. Tscharntke. 2007. Importance of pollinators in changing landscapes for world crops. Proc. Royal Soc.y B: Biol. Sci. 274(1608): 303-313.
[https://doi.org/10.1098/rspb.2006.3721]
-
Kohno, H. and T. Kubo. 2019. Genetics in the honey bee: achievements and prospects toward the functional analysis of molecular and neural mechanisms underlying social behaviors. Insects 10(10): 348.
[https://doi.org/10.3390/insects10100348]
-
Koren, S., A. Rhie, B. P. Walenz, A. T. Dilthey, D. M. Bickhart, S. B. Kingan, S. Hiendleder, J. L. Williams, T. P. Smith and A. M. Phillippy. 2018. De novo assembly of haplotype-resolved genomes with trio binning. Nat. Biotechnol. 36(12): 1174-1182.
[https://doi.org/10.1038/nbt.4277]
-
Lee, J.-H., B.-J. Kim, G. Han, O. Frunze, G. Nah and H. W. Kwon. 2025. Chromosome level de Novo hybrid assembly of Asian honeybee, Apis cerana Koreana. Sci. Rep. 15(1): 26912.
[https://doi.org/10.1038/s41598-025-12338-3]
-
Lieberman-Aiden, E., N. L. Van Berkum, L. Williams, M. Imakaev, T. Ragoczy, A. Telling, I. Amit, B. R. Lajoie, P. J. Sabo and M. O. Dorschner. 2009. Comprehensive mapping of long-range interactions reveals folding principles of the human genome. Science 326(5950): 289-293.
[https://doi.org/10.1126/science.1181369]
-
Meixner, M. D. 2010. A historical review of managed honey bee populations in Europe and the United States and the factors that may affect them. J. Inverteb. Pathol. 103: S80-S95.
[https://doi.org/10.1016/j.jip.2009.06.011]
-
Meixner, M. D., C. Costa, P. Kryger, F. Hatjina, M. Bouga, E. Ivanova and R. Büchler. 2010. Conserving diversity and vitality for honey bee breeding. J. Apic. Res. 49(1): 85-92.
[https://doi.org/10.3896/IBRA.1.49.1.12]
-
Mérot, C., R. A. Oomen, A. Tigano and M. Wellenreuther. 2020. A roadmap for understanding the evolutionary significance of structural genomic variation. Trends Ecol. Evol. 35(7): 561-572.
[https://doi.org/10.1016/j.tree.2020.03.002]
-
Meuwissen, T. H., B. J. Hayes and M. Goddard. 2001. Prediction of total genetic value using genome-wide dense marker maps. Genetics 157(4): 1819-1829.
[https://doi.org/10.1093/genetics/157.4.1819]
-
Mikheenko, A., A. Prjibelski, V. Saveliev, D. Antipov and A. Gurevich. 2018. Versatile genome assembly evaluation with QUAST-LG. Bioinformatics 34(13): i142-i150.
[https://doi.org/10.1093/bioinformatics/bty266]
-
Nguyen, L.-T., H. A. Schmidt, A. von Haeseler and B. Q. Minh. 2015. IQ-TREE: A fast and effective stochastic algorithm for estimating maximum-likelihood phylogenies. Mol. Biol. Evol. 32(1): 268-274.
[https://doi.org/10.1093/molbev/msu300]
-
Nunn, A., I. Rodríguez-Arévalo, Z. Tandukar, K. Frels, A. Contreras-Garrido, P. Carbonell-Bejerano, P. Zhang, D. Ramos Cruz, K. Jandrasits and C. Lanz. 2022. Chromosome-level Thlaspi arvense genome provides new tools for translational research and for a newly domesticated cash cover crop of the cooler climates. Plant Biotechnol. J. 20(5): 944-963.
[https://doi.org/10.1111/pbi.13775]
-
Oxley, P. R., M. Spivak and B. P. Oldroyd. 2010. Six quantitative trait loci influence task thresholds for hygienic behaviour in honeybees (Apis mellifera). Mol. Ecol. 19(7): 1452-1461.
[https://doi.org/10.1111/j.1365-294X.2010.04569.x]
-
Park, D., J. W. Jung, B.-S. Choi, M. Jayakodi, J. Lee, J. Lim, Y. Yu, Y.-S. Choi, M.-L. Lee and Y. Park. 2015. Uncovering the novel characteristics of Asian honey bee, Apis cerana, by whole genome sequencing. BMC Genomics 16(1): 1.
[https://doi.org/10.1186/1471-2164-16-1]
-
Potts, S. G., J. C. Biesmeijer, C. Kremen, P. Neumann, O. Schweiger and W. E. Kunin. 2010. Global pollinator declines: trends, impacts and drivers. Trends Ecol. Evol. 25(6): 345-353.
[https://doi.org/10.1016/j.tree.2010.01.007]
-
Radloff, S. E., C. Hepburn, H. Randall Hepburn, S. Fuchs, S. Hadisoesilo, K. Tan, M. S. Engel and V. Kuznetsov. 2010. Population structure and classification of Apis cerana. Apidologie 41(6): 589-601.
[https://doi.org/10.1051/apido/2010008]
- Ruttner, F. 2013. Biogeography and taxonomy of honeybees. Springer Science & Business Media.
-
Sayers, E. W., J. Beck, E. E. Bolton, J. R. Brister, J. Chan, R. Connor, M. Feldgarden, A. M. Fine, K. Funk and J. Hoffman. 2025. Database resources of the National Center for Biotechnology Information in 2025. Nucleic Acids Res. 53(D1): D20-D29.
[https://doi.org/10.1093/nar/gkae979]
-
Seppey, M., M. Manni and E. V. Zdobnov. 2019. BUSCO: Assessing genome assembly and annotation completeness. Methods Mol. Biol. 1962: 227-245.
[https://doi.org/10.1007/978-1-4939-9173-0_14]
-
Spötter, A., P. Gupta, G. Nürnberg, N. Reinsch and K. Bienefeld. 2012. Development of a 44K SNP assay focussing on the analysis of a varroa-specific defence behaviour in honey bees (Apis mellifera carnica). Mol. Ecol. Resour. 12(2): 323-332.
[https://doi.org/10.1111/j.1755-0998.2011.03106.x]
-
Takahashi, J.-i., T. Wakamiya, T. Kiyoshi, H. Uchiyama, S. Yajima, K. Kimura and T. Nomura. 2016. The complete mitochondrial genome of the Japanese honeybee, Apis cerana japonica (Insecta: Hymenoptera: Apidae). Mitochondrial DNA Part B 1(1): 156-157.
[https://doi.org/10.1080/23802359.2016.1144108]
-
Tan, K., Z. Wang, H. Li, S. Yang, Z. Hu, G. Kastberger and B. P. Oldroyd. 2012. An ‘I see you’prey-predator signal between the Asian honeybee, Apis cerana, and the hornet, Vespa velutina. Anim. Behav. 83(4): 879-882.
[https://doi.org/10.1016/j.anbehav.2011.12.031]
-
Uzunov, A., E. Brascamp and R. Büchler. 2017. The basic concept of honey bee breeding programs. Bee World 94(3): 84-87.
[https://doi.org/10.1080/0005772X.2017.1345427]
-
Wallberg, A., I. Bunikis, O. V. Pettersson, M.-B. Mosbech, A. K. Childers, J. D. Evans, A. S. Mikheyev, H. M. Robertson, G. E. Robinson and M. T. Webster. 2019. A hybrid de novo genome assembly of the honeybee, Apis mellifera, with chromosome-length scaffolds. BMC Genomics 20(1): 275.
[https://doi.org/10.1186/s12864-019-5642-0]
-
Wallberg, A., F. Han, G. Wellhagen, B. Dahle, M. Kawata, N. Haddad, Z. L. P. Simões, M. H. Allsopp, I. Kandemir and P. De la Rúa. 2014. A worldwide survey of genome sequence variation provides insight into the evolutionary history of the honeybee Apis mellifera. Nat. Genet. 46(10): 1081-1088.
[https://doi.org/10.1038/ng.3077]
-
Wallberg, A., C. Schoening, M. T. Webster and M. Hasselmann. 2017. Two extended haplotype blocks are associated with adaptation to high altitude habitats in East African honey bees. PLoS Genet. 13(5): e1006792.
[https://doi.org/10.1371/journal.pgen.1006792]
-
Wellenreuther, M. and L. Bernatchez. 2018. Eco-evolutionary genomics of chromosomal inversions. Trends Ecol. Evol. 33(6): 427-440.
[https://doi.org/10.1016/j.tree.2018.04.002]
-
Wenger, A. M., P. Peluso, W. J. Rowell, P.-C. Chang, R. J. Hall, G. T. Concepcion, J. Ebler, A. Fungtammasan, A. Kolesnikov and N. D. Olson. 2019. Accurate circular consensus long-read sequencing improves variant detection and assembly of a human genome. Nat. Biotechnol. 37(10): 1155-1162.
[https://doi.org/10.1038/s41587-019-0217-9]
-
Wragg, D., M. Marti-Marimon, B. Basso, J.-P. Bidanel, E. Labarthe, O. Bouchez, Y. Le Conte and A. Vignal. 2016. Whole-genome resequencing of honeybee drones to detect genomic selection in a population managed for royal jelly. Sci. Rep. 6(1): 27168.
[https://doi.org/10.1038/srep27168]
Appendix
SUPPLEMENTARY MATERIALS
Summary of PacBio HiFi sequencing raw data metrics for Apis mellifera and Apis cerana strains
Chromosome-level scaffold lengths generated via Pore-C (Hi-C) proximity ligation mapping
Species-level comparative enrichment analysis of Gene Ontology (GO) Level 2 categories between Apis cerana (n=2) and Apis mellifera (n=5) based on Fisher’s exact test on pooled absolute gene counts.
Summary of assembled mitochondrial genome characteristics and nucleotide compositions for seven Korean honeybee strains
Complete list of the 65 mitochondrial genomes used in the phylogenomic reanalysis, including taxonomic classifications, GenBank accession numbers, countries of origin, and source categories
Detailed annotation profile of predicted gene models assigned to the Gene Ontology (GO) term ‘toxin activity’ (GO:0090303) across the seven honeybee genomes
Comparison of Cytochrome P450 (CYP) monooxygenase gene copy numbers across the seven chromosome-level honeybee genome assemblies
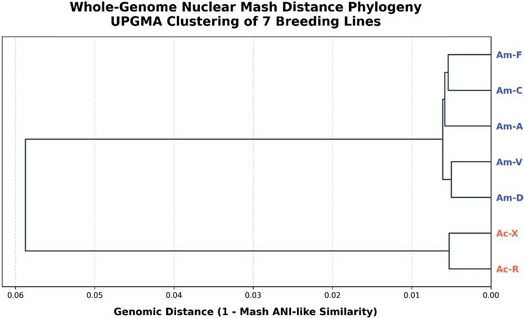
Whole-genome nuclear Mash distance phylogeny tree of the seven honeybee breeding lines. The UPGMA tree was constructed using Mash distances (k=21, sketch size=10,000) based on the chromosome-scale assembly fasta files. Scale bar indicates the genomic distance (1-Mash similarity). A. cerana (coral) and A. mellifera (blue) strains form distinct monophyletic groups with minimal intra-species genetic distance, confirming high nuclear genome integrity.