
A Conserved Proteomic Module for Diet Evaluation in Honey Bees
Abstract
Honey bees must regulate colony development despite variation in nutritional resources; however, the molecular mechanisms that stabilize development under fluctuating nutritional conditions remain unclear. In addition, tools to assess the physiological effects of artificial diets are lacking. This study investigated how compositionally distinct, but ad libitum diets, affect the day 5 head proteome of Apis mellifera. Newly emerged workers were fed high-protein (beebread), high-carbohydrate (30% sucrose solution), or mixed diets in cages, and high-resolution LC-MS/MS proteomics was applied to identify proteins and pathways consistently regulated across treatments. Differential expression analysis revealed a predominance of downregulated proteins, mainly associated with metabolic processes, followed by genetic information processing, cellular processes, and organismal systems. A coordinated module of 23 upregulated proteins, including major royal jelly proteins (MRJPs), carbohydrate metabolic enzymes, and immune-related proteins, was identified alongside downregulation of 31 pupal and storage proteins. Notably, MRJPs (1, 2, 4, 5, 7, and 9) exhibited similar fold-change distributions across diets, indicating a conserved response. Together, these patterns identify a conserved proteomic module associated with early-life maturation and nutritional adaptation, and suggest its potential utility as a molecular framework for evaluating artificial diets under variable nutritional conditions.
Keywords:
Diet effect, Honey bees, Cage experiment, ProteomicsINTRODUCTION
Recent studies have highlighted the importance of nutritional and environmental stress in shaping molecular responses and animal health, particularly through oxidative and proteomic mechanisms (Beaulieu, 2024; Walsh and Simone-Finstrom, 2024; Arad et al., 2025; González-Tokman et al., 2025). Diet is a primary regulator of physiology, yet some molecular responses to dietary variation emerge similarly across nutrient types and species, including yeast (Saccharomyces cerevisiae), fruit flies (Drosophila melanogaster), nematodes (Caenorhabditis elegans), and mammals such as mice and humans (Mirzaei et al., 2014; Luo et al., 2017). Rather than reflecting isolated nutrient-specific pathways, these responses often emerge from conserved metabolic systems and typically involve energy metabolism, antioxidant defense, and nutrient-sensing pathways, including glycolysis, the tricarboxylic acid (TCA) cycle, and mTOR and AMPK signaling (Luo et al., 2017; Tan and Miyamoto, 2016). In natural environments, dietary variability is further influenced by spatial and temporal variation in resource availability, resulting in fluctuations in nutrient quality and quantity. Under these conditions, conserved molecular responses may help maintain physiological functions across variable nutritional conditions.
Such an evolutionarily conserved metabolic baseline of diet responses facilitates the study of physiology, yet there remains a critical gap between fundamental knowledge and applied nutritional support for managed pollinators. We still know relatively little about how diet modulates pollinator health physiology, and we lack clear metabolic parameters to guide the design of nutritionally validated diets that could support them during unpredictable nutritional shortfalls under climate change. This gap is especially critical for honey bees, which provide major economic and ecological benefits through crop pollination, food production, and medicinal products, yet are experiencing global declines. These declines, unfolding in the context of climate change, pose a serious threat to both ecosystems and human well-being (Quaresma et al., 2025). Also, colony health is constrained by seasonal pollen scarcity, floral shifts, and anthropogenic habitat loss, yet colonies must maintain stable physiology and cognitive capacity to ensure survival (Crailsheim, 1998; Branchicella et al., 2019). These physiologies cannot reverse normal seasonal patterns, but they can buffer against physiological failure in individual bees by supporting metabolic homeostasis and stress resilience (Crailsheim, 1998). Malnutrition and starvation of many individual workers cascade to reduced brood production, impaired immunity, and increased pathogen infection, which collectively undermine disease resistance and overall colony performance, which is reflected in economic value (Ament et al., 2008; Wheeler and Robinson, 2014; Branchicella et al., 2019), but a few studies have linked dietary treatments to metabolic parameters. Ricigliano et al. (2021) found that plant-based and cyanobacteria protein diets produce comparable proteome expression patterns and equivalent levels of a storage protein that regulates metabolic homeostasis (vitellogenin) and stress-response proteins (superoxide dismutase, glutathione S-transferase, catalase, heat shock protein 90), indicating that adequate protein supply stabilizes metabolic function regardless of protein source. Furthermore, major royal jelly proteins (MRJPs), which are synthesized in the hypopharyngeal glands, respond to the lipid and sterol content of the honey bee diet and are themselves responsible for the nutritional composition of secreted royal jelly (the larval diet), demonstrating that the head proteome is a critical target for studying dietary effects that support colony-level metabolic stability (Cakrabarti and Sagili, 2020; Zaluski et al., 2020). Together, these findings highlight that while specific diet-proteome links have been identified, the proteome-level organization of shared nutritional responses in honey bees remains incompletely characterized.
Proteomes are well-suited to dissect diet responses because they report the integrated metabolic state and functional phenotype of cells, capturing protein synthesis, degradation, and post-translational modification (Yang et al., 2015; Lee et al., 2023). Proteomics can simultaneously detect coordinated up and down-regulation across functional domains, enabling the identification of proteome changes and their links to physiological outcomes (lifespan, brood production, immune function), which remain poorly defined, so in honey bees, practical colony evaluation still relies on coarse visual inspection rather than standardized biomarkers.
Here, we address these gaps by characterizing how compositionally distinct but nutritionally adequate diets shape the Apis mellifera ligustica proteome. Using high-resolution proteomics, newly emerged workers were exposed to sugar, beebread, or mixed diets under ad libitum conditions for 5 days, enabling identification of proteomic patterns shared across dietary treatments. We identify a conserved module shared across dietary treatments, encompassing lysosomal, proteasomal, and ABC transporter functions, together with amino acid and polyamine metabolism. This module represents a common early-life molecular response to nutritional variation. Proteins consistently maintained across adequate diets define a candidate reference module, whose disruption may indicate nutritional imbalance. These findings suggest its potential utility as a molecular framework for evaluating artificial diets and for assessing honey bee nutritional condition under variable nutrition environments.
MATERIALS AND METHODS
1. Honey bee maintenance and sampling
Worker honey bees (Apis mellifera ligustica) were obtained from three colonies housed at the Incheon National University apiary (37°22ʹ25ʺN, 126°37ʹ40ʺE), Republic of Korea, in 2024. Colonies were managed according to standard beekeeping practices (Guzman-Novoa et al., 2025). Age-matched worker cohorts were established by isolating capped brood combs from colonies and allowing adults to emerge in an incubator under controlled laboratory conditions (34.5±2℃; 60±5% RH). Individuals eclosing within a 12 h window were classified as day 0. Immediately after emergence, bees were collected, placed in labeled 15 mL tubes, and flash-frozen at -80℃ (Fig. 1A-D). For feeding experiments, groups of newly emerged workers (25 individuals per cage) were transferred into wooden cages fitted with acrylic panels and maintained for 5 days in the same incubator under identical conditions. Worker bees were provided continuous access to water and assigned to one of three dietary regimes differing in carbohydrate and protein composition. Diets were provided ad libitum, allowing bees to self-regulate food intake. Food consumption was not standardized across groups.
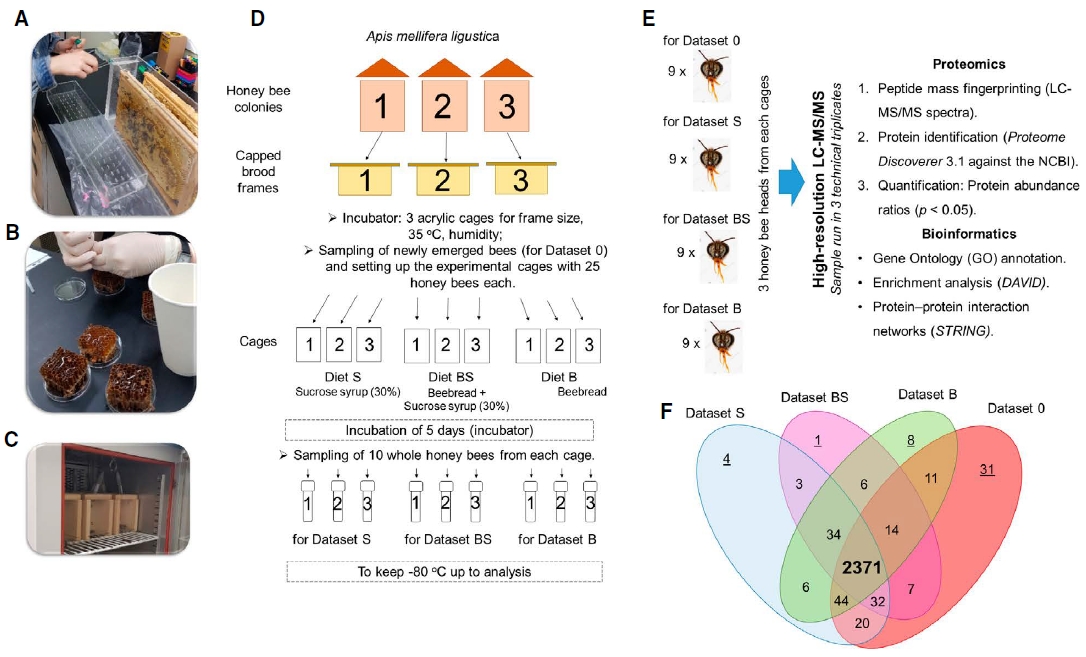
Experimental design and proteomic workflow for assessing conserved molecular responses in Apis mellifera ligustica: (A) Collection of newly emerged honey bees from colonies and transfer to cages for feeding experiments. (B) Preparation of experimental diets. (C) Incubation of bees under controlled environmental conditions (34.5°C, 60% relative humidity). (D) Schematic overview of colony origin, brood handling, cohort synchronization (day 0), cage setup, dietary treatments (sucrose, beebread, and mixed diet), and sampling workflow over the 5-day experimental period. (E) Proteomic and bioinformatic analysis pipeline. (F) Overlap of identified proteins across dietary conditions shown as a Venn diagram, highlighting shared (bold) and diet-associated protein subsets.
The carbohydrate-only treatment (Diet S) consisted of a 30% (w/v) sucrose solution delivered directly into empty comb cells (~10 mL per frame) using a syringe. The protein-rich treatment (Diet B) utilized comb frames containing natural beebread in approximately one quarter of the cells. A mixed diet (Diet BS) combined both components, with 30% sucrose solution added to empty cells (~10 mL) alongside beebread occupying one quarter of the comb.
Sucrose solution was replenished as necessary throughout the experiment. Water was supplied via inverted 15 mL tubes containing tap water, with three perforations in the cap to allow access. Honey bee condition within cages was assessed daily. After 5 days under the same environmental conditions, a subset of individuals (10 bees per cage replicate) was collected, transferred to labeled tubes, and stored at -80℃ until further analysis. For each diet group, bees were obtained from three independent cages. From each cage, three heads were randomly selected and pooled, resulting in one composite sample of nine heads (3 heads×3 cages) per diet for proteomic analysis. Proteomic measurements were therefore performed on one pooled sample per diet group.
2. Proteomic sample preparation and LC-MS/MS
Proteomic analysis was performed on pooled samples prepared as described above. Freeze-dried honey bee heads were collected (Fig. 1E) and extracted in ice-cold RIPA buffer. The lysates were clarified and transferred into 50 mM ammonium bicarbonate using 10 kDa cutoff filters, after which protein concentration was determined by BCA assay. Proteins were reduced with dithiothreitol, alkylated with iodoacetamide, and digested overnight at 37℃ with trypsin (1 : 20, w/w). The resulting peptides were purified using C18 material, dried, and reconstituted in 0.1% formic acid. Peptides were separated on a Vanquish Neo UHPLC system equipped with a PepMap Neo C18 column and analyzed on a Q Exactive HF-X mass spectrometer. A 120 min nanoLC gradient of 2-40% acetonitrile containing 0.1% formic acid was used, and spectra were acquired in positive ion mode with data-dependent acquisition.
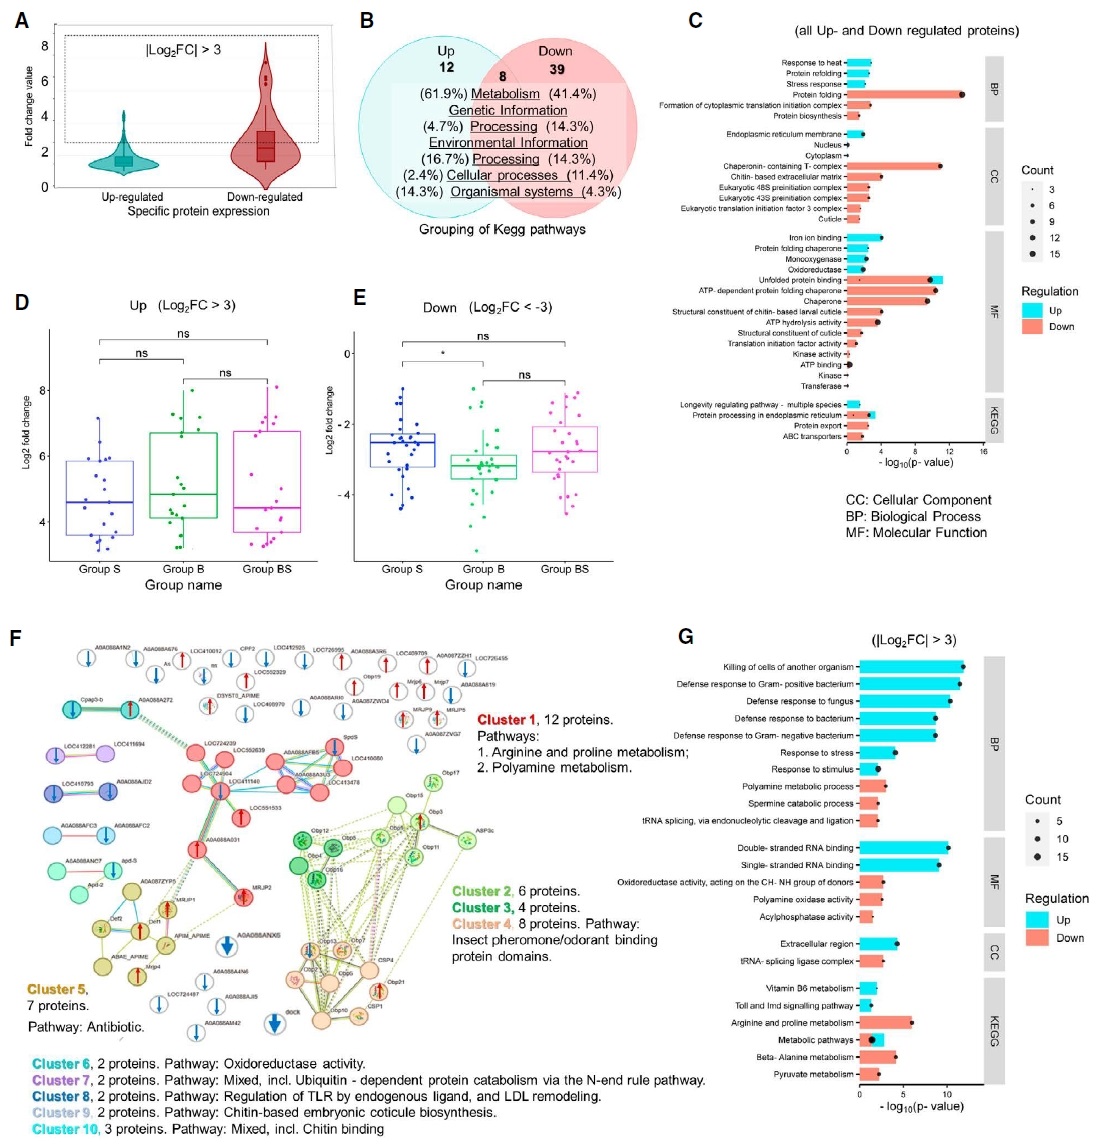
Non-specific regulation of metabolic effects on honey bees, shared across dietary conditions: (A) Violin plot of the fold changes (FC) for up- and down-regulated total proteins in non-specific to diet dataset NS compared to their controls. Highly regulated proteins (|log2FC|>3, indicating genes with fold changes greater than 3-fold in either direction) are highlighted separately with a rectangular boundary on the plot; (B) Venn diagram comparing KEGG pathways derived from the total up- and down-regulated protein in dataset NS; (C) Gene Ontology (GO) analysis was performed on the total up- and down-regulated proteins in dataset NS using the David and STRING 12.0 tools, identifying significantly enriched GO terms for Biological Process (BP), Cellular Component (CC), Molecular Function (MF), and KEGG pathways. The horizontal axis indicates the functional association̓s significance (-log10 p-value), which depends on the number of proteins in the class; (D), (E) Comparative analysis of fold-change datasets NS for highly up-regulated (D) and down-regulated (E) proteins in honey bees from different diet groups (Diet S, Diet B, and Diet BS). Statistical analysis was performed using the non-parametric Wilcoxon test (p<0.05). F. Metabolic map showing interactions of 47 highly regulated proteins (|log2 FC|<3) from dataset NS. K-means clustering, based on these proteins and their nearest protein network, was performed using the STRING 12.0 tool with settings of 20 and 10 proteins in the first and second shells, respectively; (G) Gene Ontology (GO) analysis was performed on the forty-eight highly up- and down-regulated proteins in dataset NS, identifying significantly enriched GO terms.
Raw files were processed in Proteome Discoverer (v3.1) and searched against the Apis mellifera UniProt database (NCBI Taxonomy ID 7460). Trypsin specificity was applied, with carbamidomethylation of cysteine set as a fixed modification and methionine oxidation as a variable modification. Peptide and protein identifications were filtered at a 1% false discovery rate, and normalized protein abundances were exported for downstream statistical and bioinformatic analyses. Additional methodological details (reagents and solvents, instrumentation and equipment, data processing software) are provided in Supplemental Material 1.
3. Bioinformatics: functional annotation, enrichment, and evolutionary analysis
All LC-MS/MS data processing steps adhered to the fundamental principles of proteomics bioinformatics (Domon and Aebersold, 2006) and standard preprocessing workflows (Tsai et al., 2016), with differential expression analysis optimized using evidence-based parameter selection strategies (Peng et al., 2024). All proteomic outputs are available in Supplemental Material 2. Given the limited functional annotation of Apis mellifera, protein function was inferred using a hierarchical strategy based on Gene Ontology assignments retrieved from UniProtKB, followed by overrepresentation analysis of Biological Process categories using a right-tailed hypergeometric framework with false discovery rate control. Proteins lacking GO/KEGG/DAVID information were further analyzed in STRING 12.0 (Szklarczyk et al., 2023) and with sequence-based tools (InterProScan) to infer putative functions from conserved domains and insect orthologs. Differential proteins were consolidated into functional groups to represent diet-related metabolic shifts. Overlapping, annotated proteins shared across dietary conditions were selected and used for all downstream analyses. Immune-associated interactions were assessed in STRING v12.0 (Apis mellifera, taxon 7460) at high confidence (0.900). Network connectivity and Gene Ontology enrichment were jointly applied to define functional relationships, while the GO hierarchy enabled separation of biological roles, molecular functions, and cellular localization.
4. Software and statistics
Data visualization was performed using SRplot (https://www.bioinformatics.com.cn/srplot; accessed March 2025) to generate violin plots. Statistical comparisons between groups were conducted using a two-sided Wilcoxon rank-sum test. For proteomic analyses, P-values were adjusted for multiple testing using the Benjamini-Hochberg false discovery rate (FDR) method, and proteins with FDR<0.05 and |Log2FC|>1 were considered differentially expressed. Additional statistical analyses were carried out using XLSTAT (Addinsoft, Paris, France; version 2025.1.3).
RESULTS
Here, we examined the proteomic responses of early-age Apis mellifera workers to high-carbohydrate (30% sugar solution, Group S), high-protein (beebread, Group B), and mixed diets (30% sugar solution plus beebread, Group BS) in a cage experiment, in which bees were provided with one of three defined diets ad libitum. After 5 days, they were collected and used for head proteome analysis. The resulting datasets for Groups S, B, and BS contained 2,454, 2,424, and 2,420 proteins, respectively, and were normalized to the dataset from newly emerged bees at day 0 (Group control). A total of 2,371 proteins were shared across groups (Fig. 1F). We excluded from further analysis any proteins detected in only one group or with a log2 fold change (Log2FC) between -1 and 1.
1. Metabolic reprogramming in diet response
The non-specific set comprised 69 upregulated and 316 downregulated proteins (Fig. 2A). These proteins were assigned to KEGG pathways: 12 pathways contained only upregulated proteins, 39 contained only downregulated proteins, and 8 were shared between both sets (59 in total) (Fig. 2B). The pathways were then grouped into five functional categories, and the relative contribution of each category was calculated independently for the upregulated and downregulated datasets as a percentage of 100%. The Metabolism category accounted for 61.9% of the upregulated dataset and 41.4% of the downregulated dataset, while Environmental Information Processing contributed 16.7% and 14.3%, respectively, indicating that metabolic functions and signaling processes generally altered during development. In contrast, pathways related to Genetic Information Processing (14.3%) and Cellular Processes (11.4%) were more represented among upregulated proteins, whereas Organismal Systems (14.3%) were more represented among downregulated proteins, suggesting that activation of basic cellular machinery is accompanied by a relative suppression of higher-level physiological systems (Fig. 1B). Next, we performed GO enrichment analysis on the up- and downregulated datasets and identified Biological Process (BP, 6 terms), Cellular Component (CC, 9), Molecular Function (MF, 15), and the most represented KEGG pathways (4 pathways) (Fig. 2C). Taken together, the activation of protein synthesis, chaperone, and proteostasis pathways, coupled with suppression of organismal systems, indicates that proteomic differences are observed at day 5.
2. Strongly regulated conserved proteins
Next, we focused on highly regulated proteins with |Log2FC|>3 to characterize the strong non-specific signature. The total abundance of these 20 upregulated proteins (29% of detected upregulated proteins) did not differ significantly among Groups S, B, and BS (Fig. 2D). In contrast, the 27 downregulated proteins (8.5%) showed a significant difference between Groups S and B (p<0.05), whereas neither Group differed significantly from Group BS (Fig. 2E). Together, these results demonstrate that the upregulated proteins form a more conserved response module, whereas the downregulated proteins exhibit greater variation across conditions.
These 47 proteins (20 upregulated and 27 downregulated) were analyzed for interactions using STRING 12.0, together with 20 first shell and 10 second shell proteins added to expand the interaction network. In total, 18 of the 47 proteins formed 10 clusters (Fig. 2F). The largest, Cluster 1, was functionally associated with arginine and proline metabolism and polyamine metabolism. This cluster was connected to Cluster 5 (antibiotic response) and Cluster 6 (oxidoreductase activity). Another large cluster, Cluster 4, was associated with insect pheromone/odorant binding protein domains and was connected to Cluster 2, which had similar functions.
To functionally annotate the 47 proteins, we performed KEGG and GO enrichment analyses, identifying key enzymatic activities, binding modes, and metabolic pathways. This revealed spatial compartmentalization, separating extracellular defense proteins from nuclear RNA-processing factors (Fig. 2B, F, and G). Together, the data suggest that conserved, diet-proteome-wide adjustment operates through three integrated mechanisms: polyamine and amino acid metabolism, redox homeostasis, and innate immune priming.
To examine the conserved response across diets at individual-protein resolution, we analyzed the Log2FC of 23 upregulated (Fig. 3A) and 31 downregulated (Fig. 3B) proteins across Groups S, B, and BS, including proteins with and without KEGG or STRING pathway assignments. The larger set includes proteins without KEGG or STRING annotations, which were excluded from pathway enrichment analyses but retained for protein-level comparisons. Proteins were selected based on two criteria: (i) fold-change≥2 (|Log2FC|>1) in all three groups, and (ii) fold-change≥8 (|Log2FC|>3) in at least one group. The upregulated proteins remained consistently above the +3 threshold (red dashed line in Fig. 3A, B) across the three diets with minimal variation in rank order, whereas the downregulated proteins remained below the -3 threshold and showed greater variation in individual rankings. This pattern indicates that the upregulated protein set is more consistently conserved across dietary conditions.
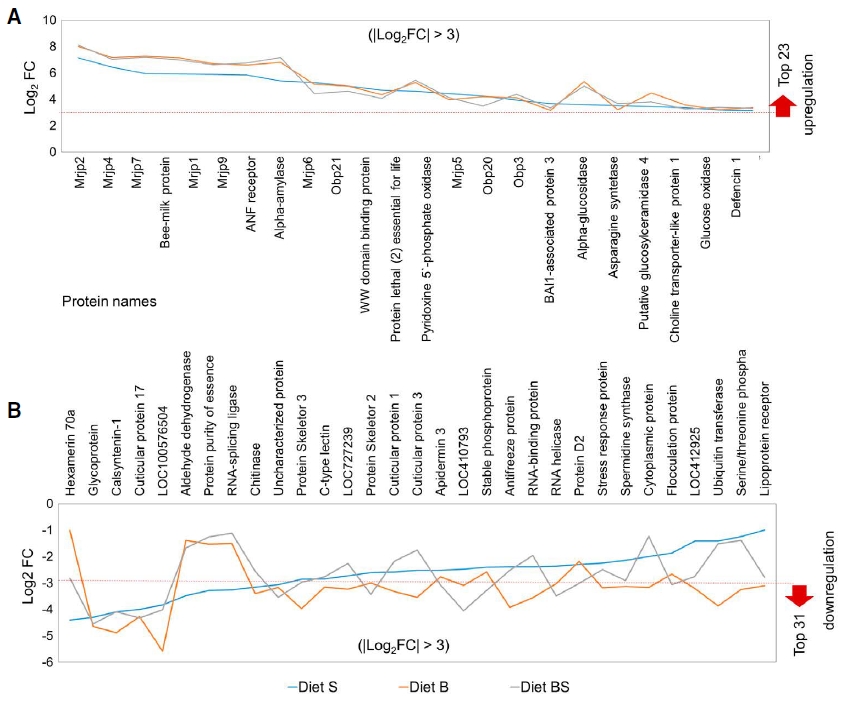
Conserved across diets proteomic response: (A) Log2 fold changes for 23 upregulated proteins selected from the conserved module (|Log2FC|>1), with strong upregulation defined as |Log2FC|>3 in at least one diet (Diet S, Diet B, or Diet BS). (B) Log2 fold changes for 31 downregulated proteins selected from the same module (|Log2FC|>1), with strong downregulation defined as |Log2FC|>3 in at least one diet across the three diets.
Red dashed lines indicate ±3-fold change thresholds. Each line represents the trajectory of an individual protein across the three diet treatments. Parallel trajectories across all three diets demonstrate that individual proteins in the non-specific response module are consistently regulated in a conserved manner across diets. Of the 23 upregulated and 31 downregulated proteins, 20 and 27, respectively, have annotated KEGG pathways and were included in downstream pathway enrichment analyses.
3. Integrated diet-response module
When honey bees develop during the first 5 days, they activate an integrated proteome response comprising four functionally interconnected domains (Fig. 4).
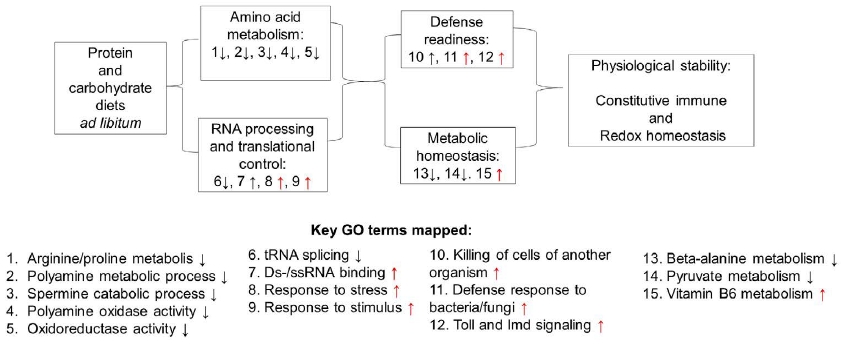
Mechanistic network of the conserved diet-response module under ad libitum diets in honey bees. Arrows indicate regulatory direction based on GO enrichment of proteins with |Log2FC|>3.
The first domain, amino acid and protein metabolism, involves the arginine/proline and polyamine pathways, which channel dietary nitrogen and generate H2O2 via polyamine oxidases, thereby coupling amino acid flux to redox homeostasis and using reactive oxygen species as signals to activate protective antioxidant responses.
The second domain, RNA processing and translational control, includes downregulation of tRNA splicing machinery, which, together with upregulation of RNA-binding proteins, tunes translation rates to match amino acid availability and prevents the accumulation of misfolded proteins when substrates are limited.
The third domain, Defense readiness, comprises Toll/Imd signaling and responses to bacteria and fungi that are constitutively upregulated, maintaining baseline antimicrobial capacity. The fourth domain, metabolic homeostasis, involves vitamin B6-dependent cofactors and central carbon metabolism (pyruvate, beta-alanine), which regulate enzymatic activity across amino acid and carbohydrate pathways to fine-tune energy and nitrogen balance. Together, these four conserved proteomic domains operate as a coordinated system that is consistent with mechanisms supporting physiological stability.
DISCUSSION
Using high-resolution proteomics in newly emerged A. m. ligustica and workers fed ad libitum for 5 days on high protein (Group B), high carbohydrate (Group S), or mixed (Group BS) diets, this study reveals coordinated proteome changes that are largely conserved across diets. In this design, diets were provided ad libitum, allowing bees to regulate intake according to their physiological needs. While this approach reflects natural feeding behavior, it does not control for differences in energy consumption between groups; therefore, the observed proteomic responses should be interpreted as shared physiological adjustments under different nutritional contexts rather than as effects attributable to specific diet composition. This experimental design focuses on early post-emergence workers, which typically remain within the colony and do not forage, allowing direct assessment of diet effects on physiology under controlled intake conditions. In addition, proteomic analysis was performed on one pooled sample per diet group and does not include independent biological replicates, which limits statistical inference at the proteome level.
Proteome profiling identified a conserved module comprising 385 proteins (|Log2FC|>1) shared across diets. This module spans lysosomal and proteasomal pathways, ABC transporters, and arginine/proline and polyamine metabolism. Within this set, 47 strongly regulated proteins (|Log2FC|>3) remain stable, and their disruption is likely to signal nutritional inadequacy. Here, we examine the functional architecture of this conserved proteomic module and provide a reference framework for identifying metabolic disruptions associated with nutritional stress and for the future evaluation of artificial diets under variable nutritional conditions.
1. Convergent metabolic integration across divergent diets
During the 5-day feeding period, honey bees maintained metabolic stability through four interconnected proteomic domains. Different diets are known to elicit distinct initial metabolic responses: high-carbohydrate diets preferentially activate glucose metabolism and glycolytic pathways optimized for rapid energy production (Kunieda et al., 2006; Tang et al., 2025), whereas protein-rich diets upregulate amino acid catabolism and protein synthesis (Ricigliano et al., 2021). Our findings suggest that these initially divergent pathways converge on shared downstream processes, possibly drawing on body reserves and certain carbohydrates in beebread. For example, honey bees from Groups S, B, and BS ultimately channel metabolic intermediates through polyamine and arginine/proline metabolism-pathways that integrate amino acid turnover with redox homeostasis and immune signaling (Majumbar et al., 2016; Wu et al., 2020). Similarly, despite different initial fuel sources, both diet groups upregulate the same core set of tRNA-processing and RNA-binding proteins, suggesting that translational quality control represents a convergent solution to the problem of matching protein synthesis capacity to substrate availability (Floor and Doudan, 2016). This pattern-divergent entry points but convergent core mechanisms-explains why we observed a shared proteome despite dietary heterogeneity at the pathway level, consistent with previous observations of convergent nutritional intake targets in honey bees (Altaye et al., 2010).
2. MRJPs in upregulation
The 23 strongly upregulated proteins (Log2FC>3) reveal a coordinated metabolic preparation program during the early adult transition (Fig. 2A). Seven MRJP isoforms (MRJP1, 2, 4, 5, 6, 7, and 9) are upregulated in the head by day 5 post-emergence, shared across dietary conditions. The head comprises hypopharyngeal glands (HG), mandibular glands, brain, antennae, eyes, and mouthparts. Importantly, MRJPs are expressed across multiple tissues in the honey bee and are not restricted to HG; therefore, the observed signal likely reflects combined contributions from several head tissues. The detected MRJPs 1, 2, 4, 5, and 7 are likely to be strongly contributed by HG activity, as this tissue is the canonical site of MRJP synthesis and secretion for royal jelly production (Drapaeau et al., 2006). HG acini undergo rapid growth from emergence (undeveloped) to nurse phase (day 6-12, maximum size), requiring substantial protein synthesis during this development. The upregulation of MRJP1, 2, 4, 5, and 7 aligns with preparation for nursing behavior. These MRJPs constitute 82-90% of the royal jelly protein content fed to larvae (Drapaeau et al., 2006; Kamakura, 2011; Dobritzsch et al., 2019).
MRJP6 upregulation at day 5 contradicts age-dependent expression models. MRJP6 exhibits an inverted age-dependent pattern compared to other MRJPs: low in nurse bees, high in foragers (Dobritzsch et al., 2019). Its presence at high levels (Log2FC>3) in 5-day head tissue-before nursing behavior begins-was unexpected. One possible explanation is that MRJP6 is transiently expressed during early adult development before behavioral specialization; however, this interpretation remains speculative and requires validation.
MRJP7 and MRJP9, unlike MRJPs 1, 2, 4, and 5, do not contribute to royal jelly composition. MRJP7 nevertheless exhibits an age-dependent expression pattern similar to the royal jelly MRJPs, increasing from emergence through the nurse phase before declining in foragers (Dobritzsch et al., 2019), whereas MRJP9 shows more constitutive expression. This suggests MRJP7 participates in the core nursing preparation program alongside MRJP1, 2, 4, and 5, though its specific functional contribution remains uncharacterized. In contrast, MRJP9 shows very low expression in both HG and brain compared to other MRJPs (Dobritzsch et al., 2019). MRJP9 has been reported in multiple tissues, including venom glands, and is phylogenetically ancient, predating nutrient-rich repeat regions characteristic of the MRJP family (Blank et al., 2012). Its upregulation in day-5 head tissue has not been previously reported and should be interpreted with caution, as the tissue origin cannot be resolved in the present whole-head dataset and requires experimental validation (Dobritzsch et al., 2019).
The absence of MRJP3 and MRJP8 indicates selective isoform deployment. The up-regulation of MRJP1, 2, 4, 5, 6, 7, and 9 suggests these seven isoforms may represent a minimal functional set required for early adult head development. This pattern suggests MRJP synthesis at day 5 is not constrained by dietary protein availability but proceeds using stored reserves from the pupal stage. Further studies using tissue-specific analysis and targeted validation (qPCR or immunodetection) will be required to confirm the spatial origin and functional roles of individual MRJP isoforms.
3. Additional upregulated proteins
Among the non-MRJP upregulated proteome, carbohydrate-processing enzymes involved in sugar metabolism and honey production: alpha-amylase, alpha-glucosidase, glucose oxidase, and putative glucosylceramidase. Alpha-amylase and alpha-glucosidase hydrolyze complex carbohydrates (starch, maltose) into simple sugars, essential for carbohydrate digestion and processing. Glucose oxidase catalyzes the conversion of glucose to gluconic acid and hydrogen peroxide (H2O2), the primary antimicrobial system in honey and royal jelly (Ohashi et al., 1999). The upregulation of glucose oxidase alongside MRJPs at day 5 indicates newly emerged workers prepare antimicrobial defense systems before nursing begins, potentially supporting the protective function of royal jelly against pathogens when feeding commences.
Our proteomic data revealed pyridoxine 5ʹ-phosphate oxidase upregulation across all diet groups by day 5. This enzyme converts pyridoxine 5ʹ-phosphate to pyridoxal 5ʹ-phosphate (PLP), the active form of vitamin B6 required for amino acid transamination and decarboxylation reactions (Parra et al., 2018). The upregulation of this enzyme during rapid MRJP synthesis (days 0-5) suggests that vitamin B6 availability may support the extensive amino acid metabolism required for protein biosynthesis in developing HG. PLP-dependent enzymes catalyze the synthesis of non-essential amino acids (Parra, et al., 2018), potentially enabling workers to reconfigure stored amino acids from vitellogenin and hexamerins (Martins et al., 2008; Corby-Harris and Snyder, 2018) into the specific amino acid profiles required for MRJP production, even when dietary protein intake varies.
Defensin1, a cationic antimicrobial peptide active against Gram-positive bacteria, showed conservation across diets upregulation at day 5, reinforcing innate immune competency (Pluta and Sokol, 2020). Newly emerged workers face immediate pathogen exposure when transitioning from sterile pupal cells to the hive environment containing feces, pollen, and diseased brood. Our proteomic data revealed early defensin1 and glucose oxidase upregulation across all diet groups by day 5, providing constitutive immune defense during the vulnerable post-emergence window before immune responses are fully balanced. The simultaneous upregulation of defensin1 (direct antimicrobial) and glucose oxidase (H2O2 production) establishes dual-mode antimicrobial capacity in both individual immunity and secreted products (royal jelly) (López-Uribe et al., 2017).
Our proteomic data revealed Obp3 and Obp20 upregulation in honey bees at day 5 across diet groups. Odorant-binding proteins (OBPs) transport hydrophobic volatile compounds through antennal lymph to chemoreceptors, enabling odor detection (Foret and Maleszka, 2006). While Obp3 has been associated with queen castes and shows higher abundance in queens̓ antennae (Iovinella et al., 2018), specific pheromone targets remain uncharacterized for both Obp3 and Obp20. Their conserved upregulation across diets suggests chemosensory system maturation proceeds in parallel with HG development during the first 5 days post-emergence, preparing workers for colony tasks that require olfactory acuity-including detecting brood pheromones, assessing larval needs, and recognizing food and later floral volatiles. The conserved upregulation across nutritional conditions indicates chemosensory capacity is prioritized regardless of dietary composition, consistent with the importance of sensory function for worker task performance (Mohammedi et al., 1996; Traynor et al., 2014).
Coordinated upregulation of MRJPs, carbohydrate enzymes, antimicrobial proteins, and OBPs across all three diets indicates that day 5 represents a synchronized developmental checkpoint. Newly emerged workers execute a pre-programmed maturation sequence using stored reserves, ensuring functional readiness for nursing and foraging conditions. This pattern may reflect a form of developmental buffering that enables robustness under variable nutritional conditions, although this hypothesis requires further investigation.
4. Downregulated proteins reveal suppression of larval/pupal programs.
Downregulated proteins further support a developmental transition from larval/pupal physiology to early adult function. Thirty-one proteins were downregulated (Log2FC< -3) at day 5, with cuticular proteins, hexamerin 70a, and chitinase most strongly represented. Hexamerin 70a, a major larval storage protein, is massively synthesized in the fat body and stored in hemolymph, where it can later be mobilized as an amino acid reserve during development (Martins et al., 2010). Its suppression, together with the downregulation of cuticle- and chitin-associated proteins, is consistent with the termination of pupal structural and storage programs that are no longer required in adult workers.
Compared to upregulated proteins, the downregulated set showed greater variability across diets, suggesting that these proteins primarily reflect intrinsic developmental progression rather than a conserved nutritional response. Accordingly, this component of the proteomic profile is interpreted as a general ontogenetic shift rather than a conserved across diets regulatory module. This coordinated suppression of storage protein synthesis, together with upregulation of task-related proteins (MRJPs, metabolic enzymes), is consistent with a proteome-level ontogeny (Chan et al., 2011), that proceeds largely independently of diet for key functional transitions, while other components show diet-dependent variability.
5. Limitations and future directions
This study is limited to a single time point (day 5), which prevents distinguishing transient developmental expression from sustained functional deployment. Longitudinal sampling and age-matched comparisons of head proteomes from nurse and forager bees will be required to determine whether the observed proteomic signature persists across behavioral stages. In addition, diets were provided ad libitum, and food intake was not standardized across groups, preventing full separation of dietary composition effects from differences in energy consumption. While controlled cage conditions enable isolation of dietary effects, they do not capture the complexity of colony-level and environmental interactions present under field conditions.
Furthermore, proteomic analysis was performed on one pooled sample per diet group, so it did not include independent biological replicates at the proteomic level. While this pooling strategy reduces individual variability and captures a representative proteomic profile, it limits statistical inference and should be considered when interpreting the results. Given the high cost of deep proteomic profiling, this study employed a pooled-sample design rather than biological replication at the proteomic level. Accordingly, the analysis focuses on identifying robust, conserved responses across independent dietary conditions rather than on statistical comparison between treatments.
CONCLUSION
We identified a conserved proteomic response of Apis mellifera across compositionally distinct diets, characterized by coordinated upregulation of 23 proteins-including MRJPs, carbohydrate metabolic enzymes, and immune-related proteins-together with downregulation of 31 pupal and storage proteins. This pattern is consistent with a shared early-life molecular response to nutritional variation. The day 5 head proteome, therefore, represents a candidate reference stage, with associated proteins offering potential candidate markers for assessing dietary effects and physiological state. These markers may further support the future evaluation of artificial diets under variable nutritional conditions. However, as the present study is limited to a single time point, it remains unclear whether this proteomic signature persists during later behavioral stages. Future longitudinal and age-matched analyses will be required to determine the temporal stability and functional relevance of these markers. Accordingly, this study focuses on conserved molecular responses rather than diet-specific effects.
SUPPLEMENTARY MATERIALS
Supplementary Material 1-methodological details of protein preparation, LC-MS/MS methods, and data analysis software; Supplementary Material 2-bioinformatics datasets and analyses (https://doi.org/10.5281/zenodo.20660145).
Acknowledgments
This research was supported by the Cooperative Research Program for Agriculture Science & Technology Development (Project No. RS-2024-00339097), the Priority Research Centers Program through the National Research Foundation of Korea (NRF) funded by the Ministry of Education (2020R1A6A1A03041954), and a post-doctoral research program for excellence institute (2025) in the Incheon National University. The funders had no role in study design, data collection and analysis, decision to publish, or preparation of the manuscript.
DATA AVAILABILITY STATEMENT
The mass spectrometry proteomics data have been deposited to the ProteomeXchange Consortium via the PRIDE partner repository with the dataset identifier PXD076284 (DOI: 10.6019/PXD076284). The dataset is currently available for peer review. The dataset is shared across related studies addressing different analytical objectives.
References
-
Altaye, S. Z., C. W. W. Pirk, R. M. Crewe and S. W. Nicolson. 2010. Convergence of carbohydrate-biased intake targets in caged worker honeybees fed different protein sources. J. Exp. Biol. 213: 3311-3318.
[https://doi.org/10.1242/jeb.046953]

-
Ament, S. A., M. Corona, H. S. Pollock and G. E. Robinson. 2008. Insulin signaling is involved in the regulation of worker division of labor in honey bee colonies. Proc. Natl. Acad. Sci. U.S.A. 105: 4226-4231.
[https://doi.org/10.1073/pnas.0800630105]
-
Arad, M., K. Ku, C. Frey, R. Hare, A. McAfee, G. Ghafourifar and L. J. Foster. 2025. What proteomics has taught us about honey bee (Apis mellifera) health and disease. Proteomics 25: 2400075.
[https://doi.org/10.1002/pmic.202400075]
-
Beaulieu, M. 2024. Oxidative status: A general but overlooked indicator of welfare across animal species? BioEssays 46: 2300205.
[https://doi.org/10.1002/bies.202300205]
-
Blank, S., F. I. Bantleon, M. McIntyre, M. Ollert and E. Spillner. 2012. The Major Royal Jelly proteins 8 and 9 are glycosylated components of Apis mellifera venom with allergenic potential beyond carbohydrate-based reactivity. Clin. Exp. Allergy 42: 976-985.
[https://doi.org/10.1111/j.1365-2222.2012.03966.x]
-
Branchiccela, B., L. Castelli, M. Corona, S. Díaz-Cetti, C. Invernizzi, G. Martínez De La Escalera, Y. Mendoza, E. Santos, C. Silva and P. Zunino and K. Antúnez. 2019. Impact of nutritional stress on the honeybee colony health. Sci. Rep. 9: 10156.
[https://doi.org/10.1038/s41598-019-46453-9]
-
Chakrabarti, P. and R. R. Sagili. 2020. Changes in honey bee head proteome in response to dietary 2, 4-methylenecholesterol. Insects. 11: 743.
[https://doi.org/10.3390/insects11110743]
-
Chan, Q. W. T., N. S. Mutti, L. J. Foster, S. D. Kocher, G. V. Amdam and F. Wolschin. 2011. The worker honeybee fat body proteome is extensively remodeled preceding a major life-history transition. PLoS ONE 6: e24794.
[https://doi.org/10.1371/journal.pone.0024794]
-
Corby-Harris, V. and L. A. Snyder. 2018. Measuring hypopharyngeal gland acinus size in honey bee (Apis mellifera) workers. JoVE 58261.
[https://doi.org/10.3791/58261-v]
-
Crailsheim, K. 1998. Trophallactic interactions in the adult honeybee (Apis mellifera L.). Apidologie 29: 97-112.
[https://doi.org/10.1051/apido:19980106]
-
Dobritzsch, D., D. Aumer, M. Fuszard, S. Erler and A. Buttstedt. 2019. The rise and fall of major Royal Jelly proteins during a honeybee (Apis mellifera) workers’ life. Ecol. Evol. 9: 8771-8782.
[https://doi.org/10.1002/ece3.5429]
-
Domon, B. and R. Aebersold. 2006. Challenges and opportunities in proteomics data analysis. Mol. Cell. Proteomics 5: 1921-1926.
[https://doi.org/10.1074/mcp.R600012-MCP200]
-
Drapeau, M. D., S. Albert, R. Kucharski, C. Prusko and R. Maleszka. 2006. Evolution of the yellow/Major Royal Jelly Protein family and the emergence of social behavior in honey bees. Genome Res. 16: 1385-1394.
[https://doi.org/10.1101/gr.5012006]
-
Floor, S. N. and J. A. Doudna. 2016. Tunable protein synthesis by transcript isoforms in human cells. eLife 5: e10921.
[https://doi.org/10.7554/eLife.10921]
-
Forêt, S. and R. Maleszka. 2006. Function and evolution of a gene family encoding odorant binding-like proteins in a social insect, the honey bee (Apis mellifera). Genome Res. 16: 1404-1413.
[https://doi.org/10.1101/gr.5075706]
-
González-Tokman, D., S. Villada-Bedoya, A. Hernández and B. Montoya. 2025. Antioxidants, oxidative stress and reactive oxygen species in insects exposed to heat. Curr. Res. Insect Sci. 7: 100114.
[https://doi.org/10.1016/j.cris.2025.100114]
-
Guzman-Novoa, E., N. Morfin, B. Dainat, G. R. Williams, J. Van Der Steen, A. Correa-Benítez and K. S. Delaplane. 2025. Standard methods to estimate strength parameters, flight activity, comb construction, and fitness of Apis mellifera colonies 2.0. J. Apic. Res. 64: 533-554.
[https://doi.org/10.1080/00218839.2024.2329853]
-
Iovinella, I., F. Cappa, A. Cini, I. Petrocelli, R. Cervo, S. Turillazzi and F. R. Dani. 2018. Antennal protein profile in honeybees: caste and task matter more than age. Front. Physiol. 9: 748.
[https://doi.org/10.3389/fphys.2018.00748]
-
Kamakura, M. 2011. Royalactin induces queen differentiation in honeybees. Nature 473: 478-483.
[https://doi.org/10.1038/nature10093]
-
Kunieda, T., T. Fujiyuki, R. Kucharski, S. Foret, S. A. Ament, A. L. Toth, K. Ohashi, H. Takeuchi, A. Kamikouchi and E. Kage. 2006. Carbohydrate metabolism genes and pathways in insects: insights from the honey bee genome. Insect Mol. Biol. 15: 563-576.
[https://doi.org/10.1111/j.1365-2583.2006.00677.x]
-
Lee, J. M., H. M. Hammarén, M. M. Savitski and S. H. Baek. 2023. Control of protein stability by post-translational modifications. Nat. Commun. 14: 201.
[https://doi.org/10.1038/s41467-023-35795-8]
-
López-Uribe, M. M., A. Fitzgerald and M. Simone-Finstrom. 2017. Inducible versus constitutive social immunity: Examining effects of colony infection on glucose oxidase and defensin-1 production in honeybees. R. Soc. Open Sci. 4: 170224.
[https://doi.org/10.1098/rsos.170224]
-
Luo, H., H.-H. Chiang, M. Louw, A. Susanto and D. Chen. 2017. Nutrient sensing and the oxidative stress response. Trends Endocrinol. Metab. 28: 449-460.
[https://doi.org/10.1016/j.tem.2017.02.008]
-
Majumdar, R., B. Barchi, S. A. Turlapati, M. Gagne, R. Minocha, S. Long and S. C. Minocha. 2016. Glutamate, ornithine, arginine, proline, and polyamine metabolic interactions: The pathway is regulated at the post-transcriptional level. Front. Plant Sci. 7: 78.
[https://doi.org/10.3389/fpls.2016.00078]
-
Martins, J. R., F. Morais Franco Nunes, Z. Luz Paulino Simões and M. Maria Gentile Bitondi. 2008. A honeybee storage protein gene, Hex 70a, expressed in developing gonads and nutritionally regulated in adult fat body. J. Insect Physiol. 54: 867-877.
[https://doi.org/10.1016/j.jinsphys.2008.03.009]
-
Martins, J. R., F. M. Nunes, A. S. Cristino, Z. L. Simões and M. M. Bitondi. 2010. The four hexamerin genes in the honey bee: Structure, molecular evolution and function deduced from expression patterns in queens, workers and drones. BMC Mol. Biol. 11: 23.
[https://doi.org/10.1186/1471-2199-11-23]
-
Mirzaei, H., J. A. Suarez and V. D. Longo. 2014. Protein and amino acid restriction, aging and disease: from yeast to humans. Trends Endocrinol. Metab. 25: 558-566.
[https://doi.org/10.1016/j.tem.2014.07.002]
- Mohammedi, A., D. Crauser, A. Paris and Y. Le Conte. 1996. Effect of a brood pheromone on honeybee hypopharyngeal glands. C. R. Acad. Sci. III 319: 769-772.
-
Ohashi, K., S. Natori and T. Kubo. 1999. Expression of amylase and glucose oxidase in the hypopharyngeal gland with an age-dependent role change of the worker honeybee (Apis mellifera L.). Eur. J. Biochem. 265: 127-133.
[https://doi.org/10.1046/j.1432-1327.1999.00696.x]
-
Parra, M., S. Stahl and H. Hellmann. 2018. Vitamin B6 and its role in cell metabolism and physiology. Cells 7: 84.
[https://doi.org/10.3390/cells7070084]
-
Peng, Y., S. Ma, L. Hu, Y. Li, X. Wang, Y. Xiong, J. Tan and F. Gong. 2024. Comparison of stimulation protocols for dose determination of gonadotropins: A systematic review and Bayesian network meta-analysis based on randomized controlled trials. Int. J. Gynecol. Obstet. 167: 66-79.
[https://doi.org/10.1002/ijgo.15602]
- Pluta, P. and R. Sokół. 2020. Changes in the expression of antimicrobial peptide genes in honey bees (Apis mellifera) under the influence of various pathogens. Ann. Parasitol. 66: 457-465.
-
Quaresma, A., J. M. Baveco, R. Brodschneider, W. B. Buddendorf, N. L. Carreck, K. Gratzer, F. Hatjina, O. Kilpinen, I. Roessink and F. Vejsnaes. 2025. Honey bee food resources under threat from climate change. Nat. Commun. 17: 1331.
[https://doi.org/10.1038/s41467-025-68085-6]
-
Ricigliano, V. A., C. Dong, L. T. Richardson, F. Donnarumma, S. T. Williams, T. Solouki, K. K. Murray. 2021. Honey bee proteome responses to plant and cyanobacteria (blue-green algae) Diets. ACS Food Sci. Technol. 1: 17-26.
[https://doi.org/10.1021/acsfoodscitech.0c00001]
-
Szklarczyk, D., R. Kirsch, M. Koutrouli, K. Nastou, F. Mehryary, R. Hachilif, A. L. Gable, T. Fang, N. T. Doncheva and S. Pyysalo. 2023. The STRING database in 2023: Protein-protein association networks and functional enrichment analyses for any sequenced genome of interest. Nucleic Acids Res. 51: 638-646.
[https://doi.org/10.1093/nar/gkac1000]
-
Tan, V. P. and S. Miyamoto. 2016. Nutrient-sensing mTORC1: Integration of metabolic and autophagic signals. J. Mol. Cell. Cardiol. 95: 31-41.
[https://doi.org/10.1016/j.yjmcc.2016.01.005]
-
Tang, M., C. Li, X. Ge, Y. Kuang, L. Qiu, K. C. Chan, Z. Chen, L. Guo, Z. Zhao and B. Zhang. 2025. Honeybee-Gilliamella synergy in carbohydrate metabolism enhances host thermogenesis in cold acclimation. npj Biofilms Microbiomes 11: 172.
[https://doi.org/10.1038/s41522-025-00798-4]
-
Traynor, K. S., Y. Le Conte and R. E. Page. 2014. Queen and young larval pheromones impact nursing and reproductive physiology of honey bee (Apis mellifera) workers. Behav. Ecol. Sociobiol. 68: 2059-2073.
[https://doi.org/10.1007/s00265-014-1811-y]
-
Tsai, T.-H., M. Wang and H. W. Ressom. 2016. Preprocessing and analysis of LC-MS-based proteomic data. In Statistical analysis in proteomics; Jung, K., Ed.; Methods in Molecular Biology; Springer New York: New York, NY, 2016; Vol. 1362, pp. 63-76.
[https://doi.org/10.1007/978-1-4939-3106-4_3]
-
Walsh, E. M. and M. Simone-Finstrom. 2024. Current honey bee stressor investigations and mitigation methods in the United States and Canada. J. Insect Sci. 24: 19.
[https://doi.org/10.1093/jisesa/ieae055]
-
Wheeler, M. M. and G. E. Robinson. 2014. Diet-dependent gene expression in honey bees: Honey vs. sucrose or high fructose corn syrup. Sci. Rep. 4: 5726.
[https://doi.org/10.1038/srep05726]
-
Wu, R., X. Chen, S. Kang, T. Wang, J. R. Gnanaprakasam, Y. Yao, L. Liu, G. Fan, M. R. Burns and R. Wang. 2020. De Novo synthesis and salvage pathway coordinately regulate polyamine homeostasis and determine T cell proliferation and function. Sci. Adv. 6: eabc4275.
[https://doi.org/10.1126/sciadv.abc4275]
-
Yang, L., J. Tan, E. J. O’Brien, J. M. Monk, D. Kim, H. J. Li, P. Charusanti, A. Ebrahim, C. J. Lloyd and J. T. Yurkovich. 2015. Systems biology definition of the core proteome of metabolism and expression is consistent with high-throughput data. Proc. Natl. Acad. Sci. U. S. A. 112: 10810-10815.
[https://doi.org/10.1073/pnas.1501384112]
-
Zaluski, R., A. C. Bittarello, J. C. S. Vieira, C. P. Braga, P. D. M. Padilha, M. D. S. Fernandes, T. D. S. Bovi and R. D. O. Orsi. 2020. Author correction: Modification of the head proteome of nurse honeybees (Apis mellifera) exposed to field-relevant doses of pesticides. Sci. Rep. 10: 6253.
[https://doi.org/10.1038/s41598-020-63289-w]
Appendix
SUPPLEMENTARY MATERIALS
Supplementary materials 1
LC.MS grade water, acetonitrile, methanol, and trifluoroacetic acid were obtained from Fisher Chemical (W6.1, A955.1, A456.1, and 85183, U.S.A.). Formic acid (F0507.100ML) and ammonium bicarbonate (09830) were purchased from Sigma.Aldrich (U.S.A.). RIPA lysis buffer (89900), BCA protein quantification assay (Q33211), dithiothreitol (A39255), iodoacetamide (A39271), and C18 peptide desalting spin columns (89851) were obtained from Thermo Fisher Scientific (PierceTM, U.S.A.). Sequencing.grade modified trypsin (Trypsin Gold, V5280) was purchased from Promega (U.S.A.).
Proteomic analyses were performed on a Thermo Scientific Vanquish Neo UHPLC system (VN.S10.A.01) coupled to a Q Exactive HF.X Hybrid Quadrupole.Orbitrap mass spectrometer (EXR0726042, Thermo Scientific). Samples were processed using Protein LoBind2® tubes (0.5, 1.5, and 2.0 mL; 0030108094, 0030108116, 0030108132, Eppendorf), a ThermoMixer2® C (5382000015, Eppendorf), vortex mixer (SI.0246A, Vortex Genie 2), mini microcentrifuge (CF.5, DAIHAN), refrigerated centrifuge (M15R, Smart R17 Plus, Hanil Science Medical), and a SpeedVac concentrator/lyophilizer (HyperVac Hyper HC3110 with VC2200, Hanil Science Medical). Samples were frozen in an ultra.low.temperature freezer (MD700, ARA MD700, Hanil Science Medical). Protein concentrations were measured using a Multiskan SkyHigh microplate spectrophotometer (Q33238, Thermo Fisher Scientific). Ultrafiltration was performed with 10 kDa Amicon Ultra-0.5 centrifugal filters (UFC500396, Millipore).
Chromatograms and mass spectra were inspected using FreeStyleTM 1.8 SP2 (Thermo Scientific). Peptide and protein identification and quantification were performed in Proteome DiscovererTM (Thermo Scientific). Data handling and downstream processing were conducted in Microsoft Excel (Microsoft Corp.) and Rstudio.