
Tissue-specific Induction Patterns of Antimicrobial Peptides in Response to Immunostimulants in the Western Honeybee, Apis mellifera (Hymenoptera: Apidae)
Abstract
The western honeybee, Apis mellifera Linnaeus (Hymenoptera: Apidae), is an economically important pollinator that has experienced sustained population decline driven in part by malnutrition and immunodeficiency. Commercial prebiotic and probiotic preparations have been marketed to support colony health, yet the molecular basis of their activity is poorly understood. Here we used an in silico screen of public transcriptomes to map tissue-specific expression of antimicrobial peptide (AMP) genes in nurse and forager bees and then performed feeding trials to screen candidate immunostimulants for tissue-resolved induction. In silico analysis showed that Defensin-1, Abaecin, Amylase and Glucose oxidase were enriched in the hypopharyngeal gland (social immunity), whereas Apidaecins and Hymenoptaecin dominated the abdominal carcass, Malpighian tubules and digestive tract (individual humoral immunity). Feeding a commercial mixed prebiotic-probiotic formulation (hereafter Formulation A) preferentially increased head-tissue Defensin-1 and Abaecin. A three-tissue component screen of label-matched constituents showed that filtered Formulation A itself suppressed head-tissue AMP transcripts (Amylase, Defensin-1, Glucose oxidase), whereas Japanese apricot extract, treacle and Eco media induced head-tissue Abaecin, Defensin-1, Glucose oxidase and Hymenoptaecin; resveratrol additionally produced a strong digestive-tract Glucose oxidase increase. Among six Lactobacillus isolates, L. brevis #3 and L. sakei #4 preferentially increased head-tissue Defensin-1, whereas L. fermentum #5 and another L. brevis isolate (#14) tended to suppress baseline AMP transcripts. These results define a tissue-resolved screening dataset and identify Japanese apricot extract, treacle and the L. brevis #3 /L. sakei #4 strains as priority candidates for follow-up dose-response and field-cage studies.
Keywords:
Abaecin, Antimicrobial peptide, Apis mellifera, Defensin-1, Immunostimulant, Social immunityINTRODUCTION
The western honeybee, Apis mellifera Linnaeus (Hymenoptera: Apidae), is a eusocial insect of substantial economic importance worldwide (Michener, 2000). Honeybee societies comprise three castes-queens, drones, and workers-with worker bees further partitioned into nurse bees and foragers through age-related division of labor (Synge, 1947; Flanders, 1960). Beyond their role as primary pollinators essential for agricultural productivity (Free, 1968; Olmstead and Wooten, 1987; Calderone, 2012; Barfield et al., 2015; Breeze et al., 2016), honeybees produce honey, beeswax, propolis, and royal jelly (Morse and Calderone, 2000; Klein et al., 2007).
Sustained declines in managed colonies have been documented globally, with annual losses in the United States reaching 40.6% and winter losses being particularly severe (Seitz et al., 2016). Colony Collapse Disorder, first reported in the mid-2000s, was the most prominent of these losses (van Engelsdorp et al., 2007; vanEngelsdorp et al., 2009). Multiple interacting stressors contribute, including the parasitic mite Varroa destructor, viral and microbial pathogens, malnutrition, pesticide exposure, and immunodeficiency (Cox-Foster et al., 2007; Cornman et al., 2012; McMenamin and Genersch, 2015).
Because conventional miticides and antibiotics are limited by the emergence of resistance and by adverse effects on colony fitness (Elzen et al., 1999; Boncristiani et al., 2012; Dahlgren et al., 2012; Tian et al., 2012), there is growing interest in nutritional approaches that support baseline colony health rather than directly targeting pathogens. Candidate prebiotics evaluated in honeybees include chitosan (Saltykova et al., 2016), resveratrol and thymol (Costa et al., 2010), vitamin C (Farjan et al., 2012, 2014), abscisic acid (Negri et al., 2015) and p-coumaric acid (Mao et al., 2013). Probiotics, in particular lactic acid bacteria, have also been reported to modulate honeybee immune gene expression (Evans and Lopez, 2004; Yoshiyama et al., 2013; Asama et al., 2015). Various commercial bee immunostimulants based on prebiotic and/or probiotic formulations are currently marketed worldwide, but the molecular basis of their effects is generally not disclosed.
We therefore set out to dissect, at tissue resolution, how a commercial mixed prebiotic-probiotic formulation and its label-matched components modulate honeybee immune gene expression. Specifically, we (i) used an in silico screen of public transcriptomes to identify tissue-enriched AMP markers of social versus individual immunity, (ii) tested whether a commercial mixed formulation preferentially activated these markers in the head, and (iii) screened individual components and selected Lactobacillus strains for tissue-specific induction patterns.
MATERIALS AND METHODS
1. Insect rearing
Western honeybees, A. mellifera, were obtained from the Insect Experience and Education Center in Damyang-gun, Republic of Korea. Colonies were managed according to standard apicultural practices (Kwon, 2009). For laboratory experiments, brood combs containing late-stage pupae were transferred to a temperature- and humidity-controlled incubator maintained at 34°C and 40±10% relative humidity. Newly emerged adult workers within a 6-h emergence window were collected to ensure age uniformity, and were housed in modified hoarding cages (8 cm×8 cm×12 cm) of approximately 50 individuals per cage. Bees were provided 50% (w/w) sucrose solution and pollen substitute ad libitum unless otherwise stated.
2. In silico transcriptome analysis
Tissue-specific transcriptome quantification was performed on an in-house Linux server (Intel Xeon L5639; 48 GB RAM; 256 GB SSD, 1 TB HDD) using kallisto v0.43.1 (Bray et al., 2016). The kallisto index was constructed from the A. mellifera Official Gene Set v3.2 (amel_OGSv3.2_cds.fa) released by BeeBase (Hymenoptera Genome Database) for genome assembly Amel_4.5. Public RNA-seq libraries covering brain, hypopharyngeal gland, mandibular gland, sting gland, Malpighian tubules, digestive tract and abdominal carcass of nurse and forager bees were retrieved from the NCBI Sequence Read Archive (SRA); accession numbers for each library are listed in Table 2. Target genes included antimicrobial peptides, oxidoreductases and digestive enzymes (Table 1). transcripts per million (TPM) values produced by kallisto were imported into Microsoft Excel (Microsoft Corp., Redmond, WA, USA), where they were rescaled in each library so that Actin TPM was set to 500 and the same per-library scaling factor was applied to the remaining transcripts; this expresses non-Actin abundance relative to a uniform Actin baseline across libraries.

Immune-related genes in Apis mellifera assayed in this study
NCBI SRA RNA-seq libraries used for in silico analysis
3. Feeding trials
Three feeding trial designs were implemented.
Trial 1 (commercial mixed formulation, ‘Formulation A’). A commercial mixed prebiotic-probiotic immunostimulant marketed under the trade name Newbee-Protector (Eco Co., Ltd., Republic of Korea) was used as a representative reference formulation; hereafter, Formulation A. The exact composition of Formulation A is proprietary and was not disclosed by the manufacturer; the product label indicated that the active ingredients comprised lactic acid bacteria, resveratrol, Bacillus subtilis, a proprietary microbial culture medium (‘Eco mediaTM’) and unspecified plant extracts. To probe its activity, Formulation A was diluted 100-fold into 50% (w/w) sucrose solution and offered ad libitum to newly emerged nurse bees for 1, 3 or 5 days, with 50% sucrose alone serving as the negative control.
Trial 2 (label-matched components). To dissect potential contributions of individual constituents in the absence of disclosed formulation details, we evaluated commercially obtainable analogues of the components listed on Formulation A’s label using publicly available chemicals: resveratrol (RE), Japanese apricot extract (JAE; Korean common name maesil-go), a flavonoid mixture (Fl), a commercially marketed effective microorganisms preparation (Em) and treacle (Tr). Forager bees were acclimated on 50% sucrose for 3 days, then fed each component at 0.02% (w/v) in 50% sucrose for 24 h. Lactobacillus acidophilus (La) was prepared at OD600=0.1 in 50% sucrose. Solutions were filter-sterilized (0.2 μm, Minisart) except for Lactobacillus spp.
Trial 3 (Lactobacillus strain panel). Six Lactobacillus strains isolated from honey (LAB#1=L. curvatus; LAB#3=L. brevis; LAB#4=L. sakei; LAB#5=L. fermentum; LAB#14=L. brevis; LAB#17=L. sakei) were cultured in MRS broth at 37°C for 3 days. Cells were harvested by centrifugation, washed with 0.9% NaCl, and resuspended to OD600=0.1 in 50% sucrose. Newly emerged nurse bees were acclimated for 3 days on 50% sucrose before being fed the probiotic suspensions for 24 h.
4. Sample collection
For developmental expression analysis, hypopharyngeal glands and the three regions of the digestive tract (foregut, midgut, hindgut) were dissected from 1-, 3- and 5-day-old adult workers under a stereomicroscope (Olympus SZ61, Japan). For feeding trials, three tissue compartments were collected: head (containing the hypopharyngeal and mandibular glands and brain), digestive tract, and abdominal carcass. All samples were snap-frozen in liquid nitrogen and stored at -80°C until processing. Each treatment was originally designed for three biological replicates (each comprising a pool of three bees), with two cDNA syntheses per biological-replicate RNA and three qPCR replicates per cDNA, yielding 18 Ct measurements per condition per gene.
5. RNA extraction, cDNA synthesis and quantitative RT-PCR
Total RNA was extracted using a modified TRIzol method. Tissues were homogenized in AccuZol Total RNA Extraction Solution (Bioneer, Republic of Korea) with 3.0-mm stainless-steel beads in a BeadBug 3 homogenizer (Benchmark Scientific, USA) at 4,000 min-1 for 20 s. Homogenates were diluted five-fold with fresh AccuZol and centrifuged at 3,000×g for 3 min. Three hundred microliters of supernatant was mixed with an equal volume of ethanol and applied to silica-based columns (Bioneer). After DNase I treatment (Qiagen, Germany) and washing with 80% ethanol, RNA was eluted in 50 μL of nuclease-free water. RNA concentration was measured on an Epoch spectrophotometer (BioTek, USA). Complementary DNA was synthesized from 2 μg of total RNA using AccuPower RT PreMix (Bioneer) with oligo (dT)12-18 and random hexamer primers.
Quantitative PCR was performed using AccuPower 2× GreenStar qPCR Master Mix (Bioneer, Daejeon, Republic of Korea) on a MyGenie 96 real-time thermal cycler (Bioneer) controlled by Bioneer Exicycler Run software (v3.55). Primer sequences are listed in Table 3. Cycling conditions were 95°C for 15 min, followed by 40 cycles of 95°C for 5 s and 60°C for 20 s. Actin was used as the reference gene. Threshold cycle (Ct) values were exported in tabular form and aggregated in Microsoft Excel. For all three trials, relative expression in treated bees was calculated against the matched sucrose-only control using the comparative 2-ΔΔCt method (Schmittgen and Livak, 2008): ΔCt=Ct[gene]-Ct[Actin]; ΔΔCt=ΔCt[treatment]-ΔCt[sucrose]; fold change=2-ΔΔCt.
Primer sequences used for quantitative RT-PCR
6. Statistical analysis
For Trial 1 (Formulation A), per-replicate Expression/Actin values-each an aggregate of two cDNA syntheses with three qPCR replicates per cDNA, i.e. up to six technical Ct readings per (sample, gene) cell-were converted to fold change versus the matched sucrose control within the same biological-replicate plate (the comparative 2-ΔΔCt method applied within each replicate, which removes between-plate Actin baseline drift). Per-replicate fold values were then aggregated as mean±SEM across biological replicates. For Trials 2 and 3, per-condition Expression/Actin means and SDs were taken from the original supplementary tables (Head, Digestive tract and Abdominal carcass for each of the eight prebiotic-component conditions and the seven Lactobacillus-strain conditions); fold change vs sucrose control and the corresponding fold-change SEM were derived by standard error propagation: SE_fold/fold=√[(SE_treat/Expr_treat)2+(SE_ctrl/Expr_ctrl)2]. Given the screening-level replication, asterisks in Figs. 3-5 indicate a descriptive induction flag (fold>2 with the lower SEM bound>1) rather than a corrected p-value.
RESULTS
1. In silico mapping of tissue-specific immune gene expression
Public transcriptome data (Table 2) revealed clear tissue-specific expression patterns of immune-related genes (Fig. 1). Forager bees exhibited higher overall AMP expression than nurse bees in most tissues. In the hypopharyngeal gland, Defensin-1, Abaecin, Amylase and Glucose oxidase were prominently expressed, with foragers showing markedly higher levels than nurses. Apisimin was largely restricted to the hypopharyngeal gland, while Lysozyme, Abaecin, Apidaecin22, Hymenoptaecin and Defensin-1 were enriched in the mandibular gland relative to other tissues.
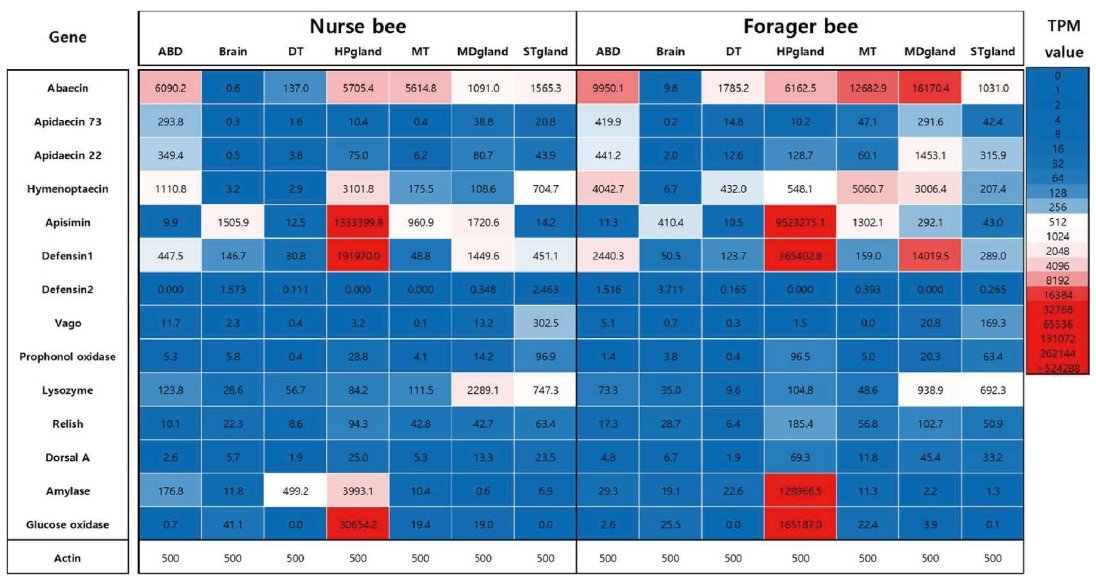
In silico expression profile of immune-related genes across nurse and forager bee tissues. Public RNA-seq libraries (Table 2) were quantified with KALLISTO using the A. mellifera Official Gene Set v3.2. Values represent Transcripts Per Million (TPM) rescaled in each library so that Actin TPM=500; the same per-library scaling factor was applied to the remaining transcripts. ABD, abdominal carcass; DT, digestive tract; HPgland, hypopharyngeal gland; MT, Malpighian tubule; MDgland, mandibular gland; STgland, sting gland. Source SRA accessions are listed in Table 2.
Abdominal tissues showed strong expression of Abaecin, Hymenoptaecin and Defensin-1, consistent with their established role in humoral immunity. Apidaecins were notably expressed in nurse bee abdomens. Digestive tract libraries from foragers showed elevated Abaecin, Hymenoptaecin and Defensin-1 relative to nurses. Malpighian tubules, an organ associated with individual immune function, displayed high expression of Abaecin, Hymenoptaecin and Apisimin, while brain libraries showed low overall AMP expression with only Defensin-2 marginally elevated. Together, these patterns identify Defensin-1, Abaecin, Glucose oxidase and Amylase as candidate markers of head-associated (social) immunity, and Apidaecins/Hymenoptaecin as markers of abdominal (individual) humoral immunity.
2. Developmental expression in early adult workers
We next examined the temporal trajectory of immune gene expression in 1-, 3- and 5-day-old adult workers (Fig. 2). In the hypopharyngeal gland (Fig. 2A), Defensin-1 and Apisimin peaked on day 1. The foregut showed elevated Abaecin and Defensin-1 on day 1 (Fig. 2B). In the midgut (Fig. 2C), Abaecin and Apisimin dominated but overall expression was lower than in other tissues. The hindgut displayed marked expression of Abaecin, Apidaecin1 and Defensin-1 on day 1 (Fig. 2D). Abdominal carcass showed delayed induction of Abaecin, Defensin-1 and Hymenoptaecin on days 3 and 5 (Fig. 2E), whereas Defensin-2 expression remained consistently low across all tissues. Major head-associated AMPs were therefore highest on day 1 post-emergence and declined by day 3, whereas abdominal AMP induction was delayed.
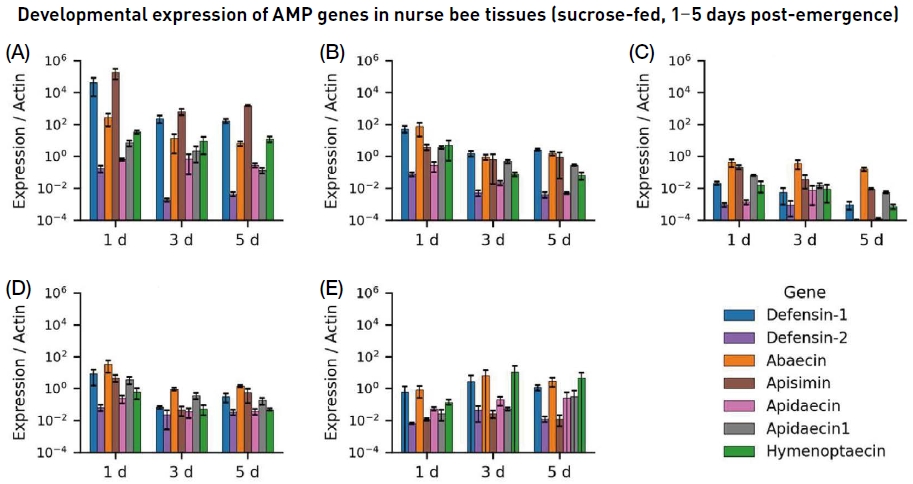
Tissue- and age-resolved expression of AMP genes in nurse bee tissues. (A) Hypopharyngeal gland, (B) foregut, (C) midgut, (D) hindgut, and (E) abdominal carcass dissected from 1-, 3- and 5-day-old nurse bees were assayed by quantitative RT-PCR. The y-axis is on a log10 scale and reports Expression / Actin (=2-ct with ΔCt=Ct[gene]-Ct[Actin]). Bars show mean±SD across the surviving biological replicates of the 2016 developmental dataset; the abdominal-carcass values were aggregated from the sucrose-fed time-course samples used as negative controls in Trial 1.
3. Tissue-specific immune induction by Formulation A
Feeding Formulation A to nurse bees modulated immune gene expression in a tissue-specific manner over 1, 3 and 5 days post-treatment (Fig. 3). Defensin-1 (Fig. 3A) and Abaecin (Fig. 3C) were induced in head tissues of treated bees relative to sucrose-only controls. Hymenoptaecin (Fig. 3G), Apidaecins (Fig. 3E, F) and Defensin-2 (Fig. 3B) showed apparent increases in abdominal carcass that did not meet the descriptive induction flag used in this screening analysis. These patterns are consistent with preferential activation of head-associated immunity by Formulation A rather than systemic activation of abdominal humoral immunity.
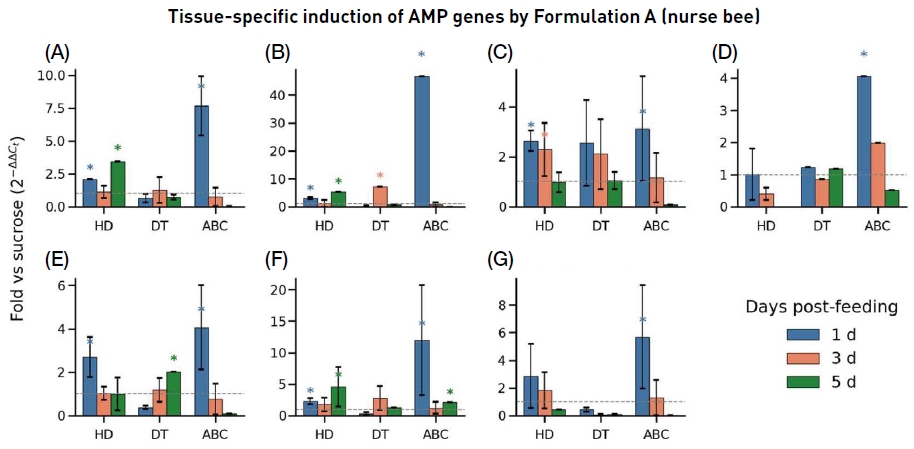
Tissue-specific induction of AMP genes after feeding nurse bees with Formulation A. Newly emerged nurse bees received Formulation A diluted 100-fold in 50% sucrose ad libitum, with sucrose-only as the negative control. Expression of (A) Defensin-1, (B) Defensin-2, (C) Abaecin, (D) Apisimin, (E) Apidaecin, (F) Apidaecin1 and (G) Hymenoptaecin at 1, 3 and 5 days post-treatment is shown as fold change relative to the matched sucrose-only control. Tissue abbreviations on the x-axis: HD, head; DT, digestive tract; ABC, abdominal carcass. Relative expression was calculated using the comparative 2-aact method (Schmittgen and Livak, 2008) within each surviving biological-replicate plate. Bars show mean±SEM across up to three biological replicates (sheets ‘Newbee treat-g1’, ‘g2’ and ‘g3’ of the 2016 master workbook); the actual n per condition (1-3) reflects coverage of the individual replicate sheets. Asterisks mark fold >2 with the lower SEM bound >1 (descriptive flag of induction; see Materials and Methods).
4. Component-level screen of label-matched constituents
We next screened individual constituents matched to the label of Formulation A in three forager-bee tissue compartments (Fig. 4: A Head, B Digestive tract, C Abdominal carcass). In head tissue (Fig. 4A), filtered Formulation A itself suppressed AMP transcripts relative to the sucrose control, with Amylase, Defensin-1 and Glucose oxidase fold changes of approximately 0.19, 0.38 and 0.52 respectively. By contrast, several individual constituents produced strong head-tissue induction: Japanese apricot extract elicited the largest fold-change increases (Abaecin ~69-fold, Hymenoptaecin ~80-fold, Defensin-1 ~5-fold, Glucose oxidase ~5-fold); treacle and Eco media produced broad head-tissue induction (Defensin-1 ~3-4-fold, Glucose oxidase ~2-5-fold, Hymenoptaecin ~4-11-fold); resveratrol induced Defensin-1 and Glucose oxidase ~3-fold; L. acidophilus produced a modest Abaecin and Hymenoptaecin increase; and the flavonoid mixture suppressed Amylase in the head (fold ~0.25). In the digestive tract (Fig. 4B), Glucose oxidase was broadly elevated across treatments, with the largest induction by resveratrol (~20-fold), Eco media (~11-fold), L. acidophilus (~7-fold), Japanese apricot extract and treacle (~6-fold). Hymenoptaecin was also elevated by Japanese apricot extract and the flavonoid mixture (~5-fold). In the abdominal carcass (Fig. 4C), Defensin-1 was broadly suppressed across treatments (most strongly by resveratrol, fold ~0.18), while Amylase showed striking induction in several treatments-most extremely in Eco-media-fed bees, where the fold-change estimate is dominated by an essentially zero UT baseline and should be interpreted with caution. Hymenoptaecin was induced by Eco media (~12-fold) and treacle (~7-fold) in the abdominal carcass. The contrast between Formulation A’s head-tissue suppression and the head-tissue induction produced by some of its label-matched constituents suggests that the overall effect of Formulation A reflects the net balance of its components rather than the effect of any single label-listed constituent in isolation.
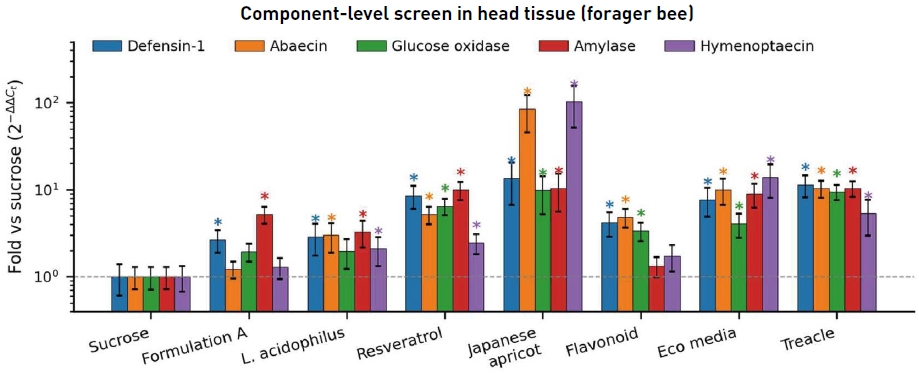
Component-level screen of label-matched constituents of Formulation A in forager bee head tissue. Bars show fold change relative to the matched sucrose-only control, computed by the comparative 2-aact method on the surviving 2016 raw Ct records. The five assayed genes are Defensin-1, Abaecin, Glucose oxidase, Amylase and Hymenoptaecin; treatments are filtered Formulation A, L. acidophilus, resveratrol, Japanese apricot extract (Korean maesil-go), a flavonoid mixture, an effective microorganisms preparation (Eco media) and treacle. Y-axis is on a log10 scale; the dashed grey line indicates fold=1. Error bars show SEM propagated from the technical-replicate SD of Expression/Actin via SE_fold/fold=√[ (SE_treat/Expr_treat)2+(SE_ctrl/Expr_ctrl)2]. Asterisks mark fold >2 with the lower SEM bound >1 (descriptive induction flag). Raw qPCR records for the digestive tract and abdominal carcass compartments of this trial were not retained, so the component screen is reported here as a head-only ranking.
5. Strain-specific immune induction by Lactobacillus probiotics
Six honey-derived Lactobacillus isolates were screened for tissue specificity of immune gene induction (Fig. 5). Strains LAB#1, #3, #4, #14 and #17 each modulated head-tissue immune transcripts (Fig. 5A); L. brevis #3 and L. sakei #4 showed a preferential head-tissue Defensin-1 fold-change increase. L. brevis #3 additionally produced elevated Abaecin, Defensin-1 and Hymenoptaecin fold changes in the head and elevated Defensin-1/Hymenoptaecin in abdominal carcass (Fig. 5C). L. sakei #4 produced an elevated Defensin-1 fold change mainly in the head under the screening conditions, with no apparent effect in the digestive tract or abdomen. L. sakei #17 preferentially increased Abaecin in the digestive tract (Fig. 5B). In contrast, L. fermentum #5 and L. brevis #14 tended to decrease baseline AMP transcripts in head and/or digestive tract tissue, so we classify these strains as immunomodulatory rather than immunostimulatory under our screening conditions.
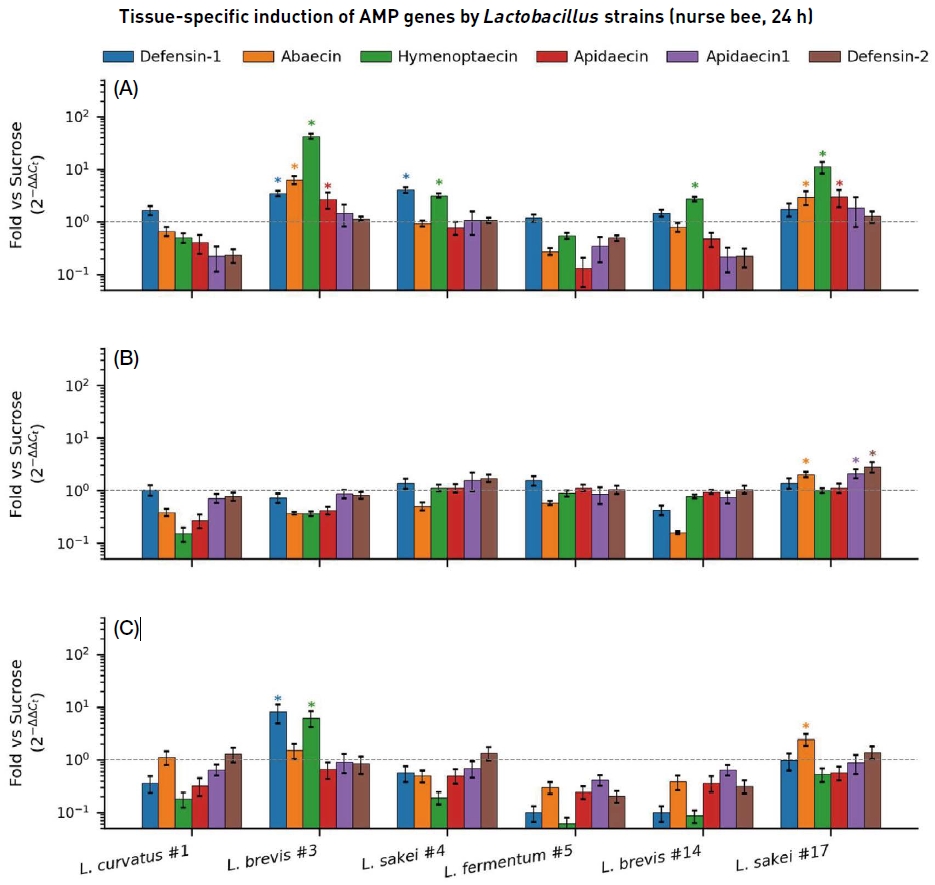
Tissue-specific induction patterns of AMP genes by Lactobacillus strain feeding in nurse bees. Induction patterns were investigated in (A) head, (B) digestive tract and (C) abdominal carcass following 24-h ad libitum feeding of single-strain probiotic suspensions. LAB#1, L. curvatus; LAB#3, L. brevis; LAB#4, L. sakei; LAB#5, L. fermentum; LAB#14, L. brevis; LAB#17, L. sakei. Bars show fold change relative to the sucrose-only control on the same plate, computed by the comparative 2-aact method. Error bars are fold-change SEM propagated from the technical-replicate SD of Expression/Actin (see Materials and Methods); asterisks mark fold >2 with the lower SEM bound >1 (descriptive induction flag). Y-axis is on a log10 scale; the dashed grey line indicates fold=1.
DISCUSSION
Our in silico analysis indicates that the hypopharyngeal gland-the primary organ for royal jelly production and nectar processing in worker bees-expresses high levels of Defensin-1, Abaecin, Amylase and Glucose oxidase. Glucose oxidase generated in this gland has been reported to produce hydrogen peroxide that contributes to the antimicrobial properties of honey and royal jelly (White et al., 1963; Ohashi et al., 1999; Bucekova et al., 2014); this provides background context rather than an outcome tested in the present study. The elevation of these transcripts in foragers compared with nurses likely reflects increased pathogen exposure during foraging activity (Vannette et al., 2015). The complementary spatial pattern-with Apidaecins and Hymenoptaecin enriched in abdominal tissues and Malpighian tubules-parallels the canonical distinction between social and individual immunity, with shared secretions of head-derived AMPs contributing to colony-level defense via trophallaxis (Evans and Spivak, 2010; Hamilton et al., 2010).
Feeding bees with Formulation A preferentially induced Defensin-1 and Abaecin in head tissue, mirroring the in silico tissue specificity of these markers. Because Formulation A’s exact composition was not disclosed by the manufacturer, we cannot attribute its effect to any single constituent. We therefore complemented the formulation trial with a label-matched component screen using publicly available chemicals.
Among the label-matched components, Japanese apricot extract emerged as the most consistent inducer of head-tissue AMP fold changes (notably Abaecin and Hymenoptaecin), with treacle and Eco media producing broad head-tissue induction across Defensin-1, Glucose oxidase, Abaecin and Hymenoptaecin. Resveratrol most strongly induced digestive-tract Glucose oxidase. Strikingly, filtered Formulation A itself did not phenocopy its label-listed constituents in the head-Amylase, Defensin-1 and Glucose oxidase transcripts were lower in Formulation-A-fed than in sucrose-fed forager bees-indicating that the net effect of the formulation in this tissue is dominated by suppressive or buffering components rather than by the inducer-type constituents identified above. Whether elevated Glucose oxidase activity in the gland translates to measurable changes in honey hydrogen-peroxide content or antibacterial activity was not tested here because neither honey peroxide levels nor antibacterial activity was assayed.
Probiotic strain comparisons revealed marked differences in tissue-resolved immunostimulatory potential, consistent with earlier reports that endogenous bacteria stimulate honeybee immunity in a strain-specific manner (Janashia and Alaux, 2016). L. brevis #3 and L. sakei #4 preferentially induced Defensin-1 in head tissue without broadly activating systemic responses, while L. fermentum #5 and L. brevis #14 tended to suppress baseline AMP expression. Because Defensin-1 and Abaecin have been correlated with colony fitness and reduced disease incidence (Evans and Pettis, 2005; Evans and Spivak, 2010; Sojka et al., 2016), strains that induce these AMPs without broad systemic activation are attractive candidates for further evaluation, given the metabolic costs of immune activation (Riessberger-Galle et al., 2015). Conversely, the apparent suppressive effect of certain Lactobacillus isolates underscores that probiotic supplementation is not invariably immunostimulatory and that strain selection should rely on direct measurement of immune endpoints.
The decline of immune transcripts from day 1 to day 5 post-emergence in untreated bees suggests developmental regulation of immune competence in early adult life and indicates that nutritional interventions may have their largest effect during this window. Honeybee colonies are exposed to multiple interacting stressors including parasites, pathogens, pesticides and nutritional shortfalls (Cornman et al., 2012; Nazzi et al., 2012). V. destructor infestation in particular has been associated with reduced immune gene expression and facilitated viral transmission (Gregory et al., 2005; Francis et al., 2013). Although our data do not address infestation rates or survival under V. destructor challenge, they are consistent with the hypothesis that nutritional immunostimulants may support baseline immune competence; direct tests of efficacy against V. destructor or specific pathogens would require dedicated challenge experiments.
On the basis of the present screen, we propose a tissue-resolved screening model for the interpretation of candidate honeybee immunostimulants (Fig. 6). The model summarizes a compartment-level strategy in which the head compartment-encompassing the gland-associated tissues relevant to social immunity-is represented by core screening markers (Defensin-1, Abaecin, Amylase and Glucose oxidase), with Apisimin, Lysozyme, Apidaecin22 and Hymenoptaecin appearing as additional head-enriched transcripts that may be informative in extended panels. A preferred response profile is a preferential increase in head-tissue markers, consistent with activation of social-immunity-associated functions such as trophallaxis-mediated sharing and royal-jelly composition. In contrast, the abdominal carcass and digestive tract are represented as compartments associated with individual humoral immunity, with Apidaecins and Hymenoptaecin as the core candidate markers and Abaecin and Defensin-1 as additional abdomen/gut-associated transcripts. An ideal immunostimulant profile would avoid broad systemic overactivation of these individual-immunity-associated markers, since unnecessary systemic immune activation is metabolically costly. Based on the present screening dataset, Japanese apricot extract, treacle, L. brevis #3 and L. sakei #4 are identified as priority leads for further validation. This model is a screening-level framework; confirmatory dose-response assays, independent-colony replication and field-cage studies are required before practical recommendations for apiculture can be made.
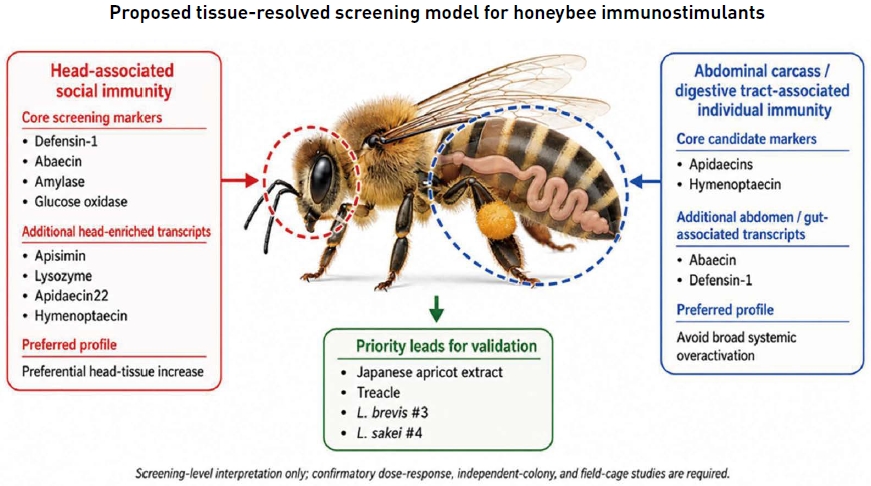
Proposed tissue-resolved screening model for honeybee immunostimulants. The model summarizes a tissue-resolved strategy for interpreting candidate honeybee immunostimulants based on compartment-specific immune transcript profiles. The head compartment, which includes gland-associated tissues relevant to social immunity, is represented by candidate markers such as Defensin-1, Abaecin, Amylase and Glucose oxidase, with Apisimin, Lysozyme, Apidaecin22 and Hymenoptaecin shown as additional head-enriched transcripts. A preferred response profile is a preferential increase in head-tissue markers, consistent with activation of social-immunity-associated functions. In contrast, the abdominal carcass and digestive tract are represented as compartments associated with individual humoral immunity, with Apidaecins and Hymenoptaecin highlighted as core candidate markers and Abaecin and Defensin-1 shown as additional abdomen/gut-associated transcripts. An ideal immunostimulant profile would avoid broad systemic overactivation of these individual-immunity-associated markers. Based on the present screening dataset, Japanese apricot extract, treacle, Lactobacillus brevis #3 and Lactobacillus sakei #4 are proposed as priority leads for further validation. The model should be interpreted as a screening-level framework only; confirmatory dose-response assays, independent-colony replication and field-cage studies are required before practical recommendations can be made.
This study has several limitations. The original feeding trials were designed for three biological replicates per condition (each comprising a pool of three bees), with two cDNA syntheses per biological-replicate RNA and three qPCR replicates per cDNA, yielding 18 Ct measurements per condition per gene. The available raw qPCR records retain three biological replicates for Trial 1 (Formulation A feeding) but only one biological replicate per condition for Trial 2 (label-matched components) and Trial 3 (Lactobacillus strain panel). Figures report fold-change SEM propagated from biological replicates (Trial 1) or from technical replicates (Trials 2 and 3); we present all three trials as a tissue-resolved screening dataset. The effects detected here identify priority leads for validation rather than efficacy claims. Confirmation requires studies with expanded biological replication, dose-response designs, independent colonies and, ultimately, colony-level phenotypes such as survival and pathogen load. The proprietary composition of Formulation A, including ‘Eco mediaTM’, also means that some of the differences between Formulation A and our label-matched component panel may reflect undisclosed ingredients. In addition, Trial 2 used forager bees while Trials 1 and 3 used nurse bees, so direct Trial 1-vs-Trial 2 comparisons are confounded by caste. Even with these limitations, the tissue-resolved screen provides a reproducible framework for ranking candidate immunostimulants and identifies Japanese apricot extract, treacle, L. brevis #3 and L. sakei #4 as priority candidates for follow-up validation.
Acknowledgments
We thank the Insect Experience and Education Center in Damyang-gun for providing the honeybee colonies used in this study, and Professor Woo-Jin Jung (Department of Agricultural Chemistry, Chonnam National University) for kindly donating the microbial isolates used in the prebiotic and probiotic feeding trials.
References
-
Asama, T., T. H. Arima, T. Gomi, T. Keishi, H. Tani, Y. Kimura, T. Tatefuji and K. Hashimoto. 2015. Lactobacillus kunkeei YB38 from honeybee products enhances IgA production in healthy adults. J. Appl. Microbiol. 119: 818-826.
[https://doi.org/10.1111/jam.12889]

-
Barfield, A. S., J. C. Bergstrom, S. Ferreira, A. P. Covich and K. S. Delaplane. 2015. An economic valuation of biotic pollination services in Georgia. J. Econ. Entomol. 108: 388-398.
[https://doi.org/10.1093/jee/tou045]
-
Boncristiani, H., R. Underwood, R. Schwarz, J. D. Evans, J. Pettis and D. vanEngelsdorp. 2012. Direct effect of acaricides on pathogen loads and gene expression levels in honey bees Apis mellifera. J. Insect Physiol. 58: 613-620.
[https://doi.org/10.1016/j.jinsphys.2011.12.011]
-
Bray, N. L., H. Pimentel, P. Melsted and L. Pachter. 2016. Near-optimal probabilistic RNA-seq quantification. Nat. Biotechnol. 34: 525-527.
[https://doi.org/10.1038/nbt.3519]
-
Breeze, T. D., N. Gallai, L. A. Garibaldi and X. S. Li. 2016. Economic measures of pollination services: Shortcomings and future directions. Trends Ecol. Evol. 31: 927-939.
[https://doi.org/10.1016/j.tree.2016.09.002]
-
Bucekova, M., I. Valachova, L. Kohutova, E. Prochazka, J. Klaudiny and J. Majtan. 2014. Honeybee glucose oxidase-its expression in honeybee workers and comparative analyses of its content and H2O2-mediated antibacterial activity in natural honeys. Naturwissenschaften 101: 661-670.
[https://doi.org/10.1007/s00114-014-1205-z]
-
Calderone, N. W. 2012. Insect pollinated crops, insect pollinators and US agriculture: Trend analysis of aggregate data for the period 1992-2009. PLoS One 7: e37235.
[https://doi.org/10.1371/journal.pone.0037235]
-
Casteels, P., C. Ampe, F. Jacobs, M. Vaeck and P. Tempst. 1989. Apidaecins: antibacterial peptides from honeybees. EMBO J. 8: 2387-2391.
[https://doi.org/10.1002/j.1460-2075.1989.tb08368.x]
-
Casteels, P., C. Ampe, L. Riviere, J. Van Damme, C. Elicone, M. Fleming, F. Jacobs and P. Tempst. 1990. Isolation and characterization of abaecin, a major antibacterial response peptide in the honeybee (Apis mellifera). Eur. J. Biochem. 187: 381-386.
[https://doi.org/10.1111/j.1432-1033.1990.tb15315.x]
-
Casteels, P., C. Ampe, F. Jacobs and P. Tempst. 1993. Functional and chemical characterization of Hymenoptaecin, an antibacterial polypeptide that is infection-inducible in the honeybee (Apis mellifera). J. Biol. Chem. 268: 7044-7054.
[https://doi.org/10.1016/S0021-9258(18)53143-4]
-
Cornman, R. S., D. R. Tarpy, Y. P. Chen, L. Jeffreys, D. Lopez, J. S. Pettis, D. vanEngelsdorp and J. D. Evans. 2012. Pathogen webs in collapsing honey bee colonies. PLoS One 7: e43562.
[https://doi.org/10.1371/journal.pone.0043562]
-
Costa, C., M. Lodesani and L. Maistrello. 2010. Effect of thymol and resveratrol administered with candy or syrup on the development of Nosema ceranae and on the longevity of honeybees (Apis mellifera L.) in laboratory conditions. Apidologie 41: 141-150.
[https://doi.org/10.1051/apido/2009070]
-
Cox-Foster, D. L., S. Conlan, E. C. Holmes, G. Palacios, J. D. Evans, N. A. Moran, P.-L. Quan, T. Briese, M. Hornig, D. M. Geiser, V. Martinson, D. vanEngelsdorp, A. L. Kalkstein, A. Drysdale, J. Hui, J. Zhai, L. Cui, S. K. Hutchison, J. F. Simons, M. Egholm, J. S. Pettis and W. I. Lipkin. 2007. A metagenomic survey of microbes in honey bee colony collapse disorder. Science 318: 283-287.
[https://doi.org/10.1126/science.1146498]
-
Dahlgren, L., R. M. Johnson, B. D. Siegfried and M. D. Ellis. 2012. Comparative toxicity of acaricides to honey bee (Hymenoptera: Apidae) workers and queens. J. Econ. Entomol. 105: 1895-1902.
[https://doi.org/10.1603/EC12175]
-
Elzen, P. J., F. A. Eischen, J. R. Baxter, G. W. Elzen and W. T. Wilson. 1999. Detection of resistance in US Varroa jacobsoni Oud. (Mesostigmata: Varroidae) to the acaricide fluvalinate. Apidologie 30: 13-18.
[https://doi.org/10.1051/apido:19990102]
-
Evans, J. D., K. Aronstein, Y. P. Chen, C. Hetru, J.-L. Imler, H. Jiang, M. Kanost, G. J. Thompson, Z. Zou and D. Hultmark. 2006. Immune pathways and defense mechanisms in honey bees Apis mellifera. Insect Mol. Biol. 15: 645-656.
[https://doi.org/10.1111/j.1365-2583.2006.00682.x]
-
Evans, J. D. and D. L. Lopez. 2004. Bacterial probiotics induce an immune response in the honey bee (Hymenoptera: Apidae). J. Econ. Entomol. 97: 752-756.
[https://doi.org/10.1093/jee/97.3.752]
-
Evans, J. D. and J. S. Pettis. 2005. Colony-level impacts of immune responsiveness in honey bees, Apis mellifera. Evolution 59: 2270-2274.
[https://doi.org/10.1111/j.0014-3820.2005.tb00935.x]
-
Evans, J. D. and M. Spivak. 2010. Socialized medicine: individual and communal disease barriers in honey bees. J. Invertebr. Pathol. 103: S62-S72.
[https://doi.org/10.1016/j.jip.2009.06.019]
-
Farjan, M., M. Dmitryjuk, Z. Lipinski, E. Biernat-Lopienska and K. Zoltowska. 2012. Supplementation of the honey bee diet with vitamin C: The effect on the antioxidative system of Apis mellifera carnica brood at different stages. J. Apic. Res. 51: 263-270.
[https://doi.org/10.3896/IBRA.1.51.3.07]
-
Farjan, M., E. Lopienska-Biernat, Z. Lipinski, M. Dmitryjuk and K. Zoltowska. 2014. Supplementing with vitamin C the diet of honeybees (Apis mellifera carnica) parasitized with Varroa destructor: Effects on antioxidative status. Parasitology 141: 770-776.
[https://doi.org/10.1017/S0031182013002126]
-
Flanders, S. E. 1960. Caste in the honey bee. Insectes Soc. 7: 9-16.
[https://doi.org/10.1007/BF02225754]
-
Francis, R. M., S. L. Nielsen and P. Kryger. 2013. Varroa-virus interaction in collapsing honey bee colonies. PLoS One 8: e57540.
[https://doi.org/10.1371/journal.pone.0057540]
-
Free, J. B. 1968. The foraging behaviour of honeybees (Apis mellifera) and bumblebees (Bombus spp.) on blackcurrant (Ribes nigrum), raspberry (Rubus idaeus) and strawberry (Fragaria×ananassa) flowers. J. Appl. Ecol. 5: 157-168.
[https://doi.org/10.2307/2401280]
- Gannabathula, S., M. A. Skinner, D. Rosendale, J. M. Greenwood, I. K. H. Hodgkinson, B. Bailey, K. P. Mutukumira and A. N. Hofbauer. 2015. Properties of natural manuka and clover honeys and co-cultures: Dual antibacterial and immune-modulating activities. Mediators Inflamm. 2015: 235910.
-
Gregory, P. G., J. D. Evans, T. Rinderer and L. de Guzman. 2005. Conditional immune-gene suppression of honeybees parasitized by Varroa mites. J. Insect Sci. 5: 7.
[https://doi.org/10.1673/031.005.0701]
-
Hamilton, C., B. T. Lejeune and R. B. Rosengaus. 2010. Trophallaxis and prophylaxis: social immunity in the carpenter ant Camponotus pennsylvanicus. Biol. Lett. 7: 89-92.
[https://doi.org/10.1098/rsbl.2010.0466]
-
Janashia, I. and C. Alaux. 2016. Specific immune stimulation by endogenous bacteria in honey bees (Hymenoptera: Apidae). J. Econ. Entomol. 109: 1474-1477.
[https://doi.org/10.1093/jee/tow065]
-
Klaudiny, J., S. Albert, K. Bachanová, J. Kopernický and J. Šimúth. 2005. Two structurally different defensin genes, one of them encoding a novel defensin isoform, are expressed in honeybee Apis mellifera. Insect Biochem. Mol. Biol. 35: 11-22.
[https://doi.org/10.1016/j.ibmb.2004.09.007]
-
Klein, A. M., B. E. Vaissiere, J. H. Cane, I. Steffan-Dewenter, S. A. Cunningham, C. Kremen and T. Tscharntke. 2007. Importance of pollinators in changing landscapes for world crops. Proc. R. Soc. B 274: 303-313.
[https://doi.org/10.1098/rspb.2006.3721]
- Kwon, S. H. 2009. Beekeeping 52 Weeks. 1st ed., Bora Publishing, Seoul.
-
Lourenço, A. P., A. Mackert, A. dos Santos Cristino and Z. L. P. Simões. 2008. Validation of reference genes for gene expression studies in the honey bee, Apis mellifera, by quantitative real-time RT-PCR. Apidologie 39: 372-385.
[https://doi.org/10.1051/apido:2008015]
-
Mao, W., M. A. Schuler and M. R. Berenbaum. 2013. Honey constituents up-regulate detoxification and immunity genes in the western honey bee Apis mellifera. Proc. Natl. Acad. Sci. USA 110: 8842-8846.
[https://doi.org/10.1073/pnas.1303884110]
-
McMenamin, A. J. and E. Genersch. 2015. Honey bee colony losses and associated viruses. Curr. Opin. Insect Sci. 8: 121-129.
[https://doi.org/10.1016/j.cois.2015.01.015]
- Michener, C. D. 2000. The Bees of the World. 1st ed., Johns Hopkins University Press, Baltimore.
- Morse, R. A. and N. W. Calderone. 2000. The value of honey bees as pollinators of US crops in 2000. Bee Cult. 128: 1-15.
-
Nazzi, F., S. P. Brown, D. Annoscia, F. Del Piccolo, G. Di Prisco, P. Varricchio, G. Della Vedova, F. Cattonaro, E. Caprio and F. Pennacchio. 2012. Synergistic parasite-pathogen interactions mediated by host immunity can drive the collapse of honeybee colonies. PLoS Pathog. 8: e1002735.
[https://doi.org/10.1371/journal.ppat.1002735]
-
Negri, P., M. D. Maggi, L. Ramirez, L. De Feudis, N. Szwarski, C. Quintana, M. Eguaras and L. Lamattina. 2015. Abscisic acid enhances the immune response in Apis mellifera and contributes to the colony fitness. Apidologie 46: 542-557.
[https://doi.org/10.1007/s13592-014-0345-7]
-
Niu, J., I. Meeus, K. Cappelle, F. Piot and G. Smagghe. 2016. The immune response of the small interfering RNA pathway in the defense against bee viruses. Curr. Opin. Insect Sci. 6: 22-27.
[https://doi.org/10.1016/j.cois.2014.09.014]
-
Ohashi, K., S. Natori and T. Kubo. 1999. Expression of amylase and glucose oxidase in the hypopharyngeal gland with an age-dependent role change of the worker honeybee (Apis mellifera L.). Eur. J. Biochem. 265: 127-133.
[https://doi.org/10.1046/j.1432-1327.1999.00696.x]
-
Olmstead, A. L. and D. B. Wooten. 1987. Bee pollination and productivity growth: the case of alfalfa. Am. J. Agric. Econ. 69: 56-63.
[https://doi.org/10.2307/1241306]
-
Riessberger-Galle, U., J. H. Lopez, W. Schuehly, S. Crockett, S. Krainer and K. Crailsheim. 2015. Immune responses of honeybees and their fitness costs as compared to bumblebees. Apidologie 46: 238-249.
[https://doi.org/10.1007/s13592-014-0318-x]
-
Saltykova, E. S., A. A. Karimova, A. G. Gataullin, R. R. Garipov, L. R. Gaifullina and A. V. Poskryakov. 2016. The effect of high-molecular weight chitosans on the antioxidant and immune systems of the honeybee. Appl. Biochem. Microbiol. 52: 553-557.
[https://doi.org/10.1134/S0003683816050136]
-
Schmittgen, T. D. and K. J. Livak. 2008. Analyzing real-time PCR data by the comparative CT method. Nat. Protoc. 3: 1101-1108.
[https://doi.org/10.1038/nprot.2008.73]
-
Seitz, N., K. S. Traynor, N. Steinhauer, K. Rennich, M. E. Wilson, J. D. Ellis, R. Rose, D. R. Tarpy, R. R. Sagili, D. M. Caron, K. S. Delaplane, J. Rangel, K. Lee, K. Baylis, J. T. Wilkes, J. A. Skinner, J. S. Pettis and D. vanEngelsdorp. 2016. A national survey of managed honey bee 2014-2015 annual colony losses in the USA. J. Apic. Res. 54: 292-304.
[https://doi.org/10.1080/00218839.2016.1153294]
-
Sojka, M., I. Valachova, M. Bucekova and J. Majtan. 2016. Antibiofilm efficacy of honey and bee-derived defensin-1 on multispecies wound biofilm. J. Med. Microbiol. 65: 337-344.
[https://doi.org/10.1099/jmm.0.000227]
-
Synge, A. D. 1947. Pollen collection by honeybees (Apis mellifera). J. Anim. Ecol. 16: 122-138.
[https://doi.org/10.2307/1492]
-
Tian, B. Y., N. H. Fadhil, J. E. Powell, W. K. Kwong and N. A. Moran. 2012. Long-term exposure to antibiotics has caused accumulation of resistance determinants in the gut microbiota of honeybees. mBio 3: e00377-12.
[https://doi.org/10.1128/mBio.00377-12]
- van Engelsdorp, D., D. Cox-Foster, M. Frazier, N. Ostiguy and J. Hayes. 2007. Colony Collapse Disorder Preliminary Report. In Proceedings of the Mid-Atlantic Apiculture Research and Extension Consortium (MAAREC), CCD Working Group, State College, PA, USA, pp. 1-22.
-
vanEngelsdorp, D., J. D. Evans, C. Saegerman, R. Mullin, E. Haubruge, B. K. Nguyen, M. Frazier, J. Frazier, D. Cox-Foster, Y. Chen, R. Underwood, D. R. Tarpy and J. S. Pettis. 2009. Colony collapse disorder: A descriptive study. PLoS One 4: e6481.
[https://doi.org/10.1371/journal.pone.0006481]
-
Vannette, R. L., A. Mohamed and B. R. Johnson. 2015. Forager bees (Apis mellifera) highly express immune and detoxification genes in tissues associated with nectar processing. Sci. Rep. 5: 16224.
[https://doi.org/10.1038/srep16224]
-
White, J. W., M. H. Subers and A. I. Schepartz. 1963. The identification of inhibine, the antibacterial factor in honey, as hydrogen peroxide and its origin in a honey glucose-oxidase system. Biochim. Biophys. Acta 73: 57-70.
[https://doi.org/10.1016/0926-6569(63)90108-1]
-
Yoshiyama, M., M. Wu, Y. Sugimura, N. Takaya, H. Kimoto-Nira and C. Suzuki. 2013. Inhibition of Paenibacillus larvae by lactic acid bacteria isolated from fermented materials. J. Invertebr. Pathol. 112: 62-67.
[https://doi.org/10.1016/j.jip.2012.09.002]