
Meteorological Background and Adaptation Strategy of the 2026 Spring Honey Bee Buildup Decline in South Korea: A 1-km Gridded Analysis of 1991–2026 Variability and SSP Future Scenarios
Abstract
In April 2026, an unprecedented number of South Korean apiarists reported severely impaired spring colony buildup, prompting a rapid-response field survey of 27 commercial apiaries across eight provinces by the National Institute of Agricultural Sciences (NAS-RDA). Of the surveyed apiaries, 17 (63%) were graded as having poor buildup, with a mean overwintering colony mortality of 19.3%. Crucially, the 2026 spring climate ranked 31st out of 36 years (1991-2026) for warm extreme days(Tavg z >+1.5)-a meteorologically unremarkable year. To resolve the paradox, we developed a seven-index multidimensional variability framework computed from a 1-km gridded daily archive of eight meteorological variables, applied across three nested spatial scales (27 apiaries, full peninsula at 224,060 pixels, 17 administrative regions). Mann-Kendall trend tests over 1991-2026 revealed a strongly asymmetric warm-side intensification: warm extreme days rose by +89.1% (p=0.003), distributional spread by +15.8% (p=0.025), and daily volatility by +15.5% (p=0.005), while cold extremes showed no significant trend (+12.6%, p=0.785). Pettitt change-point analysis identified a clustered 2007–2013 regime transition affecting humidity, wind oscillation, and temperature variability simultaneously, dating the contemporary climatological inflection. SSP5-8.5/2080s projections under the KMA-downscaled UKESM1 model indicate warm extreme days reaching 101 of 151 spring days (11.2×baseline) with cold extremes effectively disappearing-a qualitative rather than quantitative transformation. Five operational policy analyses (spring activation timing -9.0 d; mite activation risk-proxy index +80.6%; migratory beekeeping vulnerability 3.1× ratio; acacia bloom DOY -9.9 d; and a composite Climate Resilience Risk Index) translate the climatological findings into adaptation guidance, summarised in a four-tier framework (immediate to 15+ years) with regional prioritisation across the 17 administrative regions. The 2026 buildup decline is best understood not as a single anomalous-year event but as the cumulative climax of a multi-decadal regime shift, with substantial implications for Korean apicultural management calendar, Varroa treatment regimes (subject to empirical validation), and the strategic geography of national honey production.
Keywords:
Apis mellifera, Spring buildup, Climate variability, SSP5-8.5, Adaptation policy, Korean PeninsulaINTRODUCTION
1. Spring buildup, Korean apiculture, and a multi-dimensional climate
Honey bees (Apis mellifera) in temperate climates undergo a tightly seasonal demographic cycle in which spring is the critical inflection: an overwintering cluster of 8,000-15,000 workers must rebuild to a foraging-ready 40,000-60,000 individuals in time to exploit the dominant nectar flow (Seeley, 2010; Stabentheiner et al., 2010). The 6-10 week spring buildup window in midlatitude continental climates is governed by interacting thermal triggers: cluster break and brood-rearing initiation depend on sustained warmth above ≈8℃; brood development is temperature-sensitive; and forager activity requires daily maxima above ≈13℃ (Burrill and Dietz, 1981; Vicens and Bosch, 2000; Sparks et al., 2010). South Korean apiculture amplifies these constraints because of its heavy reliance on a single dominant nectar species: the May bloom of Robinia pseudoacacia (false acacia) accounts for approximately 70% of national annual honey production (Korean Beekeepers’ Association, 2023), with each location’s bloom lasting only 7-14 days. A colony that has not reached foraging readiness by early May effectively misses the year’s principal commercial opportunity, compressing decision space far more tightly than is the case for the multi-flow apicultural systems of Europe or North America.
The spring climatology of the Korean Peninsula is itself characterized by a complex transition between the continental winter monsoon and the East Asian summer monsoon, with month-to-month variability driven by the Siberian High retreat, the North Pacific subtropical high expansion, and intermittent trough passages (Ho et al., 2003; Lee and Wang, 2014). This transition has been documented as intensifying under recent climate change in ways not adequately captured by mean-temperature trends alone. Choi (2008) showed that Korean spring extreme temperature indices (warm-day frequency, cold-day frequency, daily temperature range) have been changing at differential rates that produce asymmetric distributional shifts; Park et al. (2017) reported that Korean spring temperature variability has increased over the post-2000 period in ways consistent with reduced North Atlantic meridional pressure gradient; and Yeh et al. (2006) linked Korean climate variability to Pacific Decadal Oscillation phase transitions. The international literature on extreme indices (Zhang et al., 2011; Donat and Alexander, 2012; Perkins-Kirkpatrick and Lewis, 2020) has further established that single-summary metrics systematically miss the multi-dimensional reality of how a changing climate is experienced biologically. Translating these meteorological findings to apicultural impact requires a framework that captures simultaneously the count of warm and cold extremes, the distributional spread, the day-to-day rate of change, and the synoptic-scale oscillation frequency-because each dimension corresponds to a distinct biological response in colony physiology.
2. The 2026 trigger event
In April 2026, Korean apicultural extension services received an unusually high number of reports of poor spring buildup. Apiarists described colonies emerging from winter at apparently adequate strength but failing to expand normally during the typical buildup window, with reduced comb coverage, fragmented brood patterns, and inadequate forager populations as the May acacia bloom approached. The NAS-RDA Apiculture Division initiated a rapid-response field survey of 27 commercial apiaries across eight provinces, conducted on April 19, 2026. The survey documented 19.3% mean overwintering colony mortality, with 17 of 27 apiaries (63%) graded “poor”, 6 (22%) graded “same”, and only 4 (15%) graded “good” relative to historical baselines. The economic implications for the 2026 acacia honey production season were anticipated to be substantial, but the immediate scientific question was more fundamental: was the 2026 buildup decline caused by an exceptional weather event during the preceding spring, or was it the manifestation of a longer-term climatological trend that had crossed a tipping point?
This question is sharper than it may first appear. The standard agricultural-meteorology framework for interpreting climate-driven crop failures looks for a single-year anomaly in the temperature, precipitation, or related record (Donat and Alexander, 2012; Perkins-Kirkpatrick and Lewis, 2020). For some agricultural systems-a freeze event at flowering, a drought during grain fill-this works well. For honey bee colonies, however, the relationship between climate and outcome is more diffuse, accumulating across multiple weeks of cluster reformation, brood rearing, and forager development, such that single-year anomalies often produce remarkably small colony-level effects when buffered by management interventions, while seemingly normal years sometimes produce substantial losses when the cumulative variability burden across the buildup window exceeds the colony’s adaptive capacity. Several recent studies have documented links between specific climate dimensions and colony outcomes-Smoliński et al. (2021) demonstrated that elevated central-European spring temperatures amplify autumn Varroa destructor infestation through accelerated mite reproductive cycles; Le Conte et al. (2010) reviewed multiple pathways by which warming affects colony loss rates; Kablau et al. (2020) documented thermal-tolerance bounds for the mite. These individual mechanisms have not yet been integrated into a multi-decadal variability framework calibrated to a single national apicultural system, particularly in East Asia where management traditions, dominant nectar flora, and climatological context all differ substantively from those of the European or North American settings on which most existing analyses are based.
3. Approach and contributions
We address these gaps through a three-stage analytical narrative (Fig. 1) progressing from immediate (2026 case) through multi-decadal (1991-2026 historical) to projected (2021-2100 SSP scenarios) time horizons, with each stage informing the next. The first stage uses the April 2026 27-apiary survey to establish the contemporary signal: how poor was the buildup, how was it distributed, and was 2026 climatologically exceptional or unremarkable? The second stage examines the 1991-2026 record using a seven-index variability framework applied at three nested spatial scales (27 apiaries; full peninsula at 1-km resolution; 17 South Korean administrative regions). The third stage projects this framework forward using three SSP scenarios (SSP1-2.6, SSP2-4.5, SSP5-8.5) across three 30-year windows (2030s, 2050s, 2080s) under the official KMA-downscaled UKESM1 product. Layered on top of the climatological analysis, five policy analyses (spring activation timing, mite activation risk-proxy index, migratory beekeeping vulnerability, nectar diversification timing, and a composite Climate Resilience Risk Index) translate the climatological findings into operationally actionable indicators for adaptation planning.
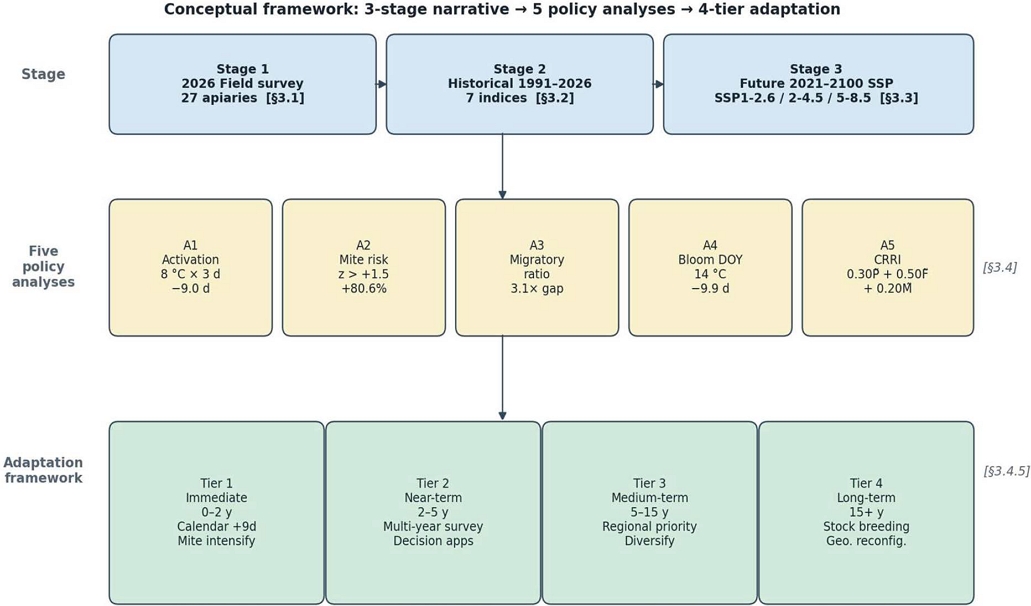
Conceptual framework of the present study. The three-stage analytical narrative (top row) progresses from the 2026 case study (Stage 1, §3.1), through 1991-2026 historical trend analysis (Stage 2, §3.2), to 2021-2100 SSP scenario projections (Stage 3, §3.3). The five policy analyses (middle row) translate the climatological findings into operational decision indicators (§3.4). The four-tier adaptation framework (bottom row) integrates the policy analyses into time-stratified action recommendations.
Three principal contributions emerge. First, methodologically, we demonstrate that asymmetric warm-side variability changes-detectable only through multi-dimensional indices and largely invisible to mean-temperature trends-are the dominant climate signal for Korean apiculture, and we provide a portable framework for similar analyses in other temperate-zone systems. Second, empirically, we identify a multi-variable regime shift in Korean spring climate clustering at 2007-2013 that aligns the formal change-point statistics with the lived experience of practising apiarists about the obsolescence of the traditional management calendar. Third, applied, we operationalise the climatological findings into a four-tier adaptation framework spanning 0-2 years (immediate calendar adjustments) through 15+ years (substantive innovation in stock genetics and geographic configuration), with regional prioritisation across the 17 South Korean administrative regions. The remainder of this paper develops these contributions in detail, with Section 2 describing the data and methods, Section 3 presenting the four-stage results, Section 4 discussing the implications, and Section 5 summarising the conclusions.
MATERIALS AND METHODS
1. Field survey and apiary data
The 27-apiary field survey was conducted on April 19, 2026, across eight South Korean provinces (Gangwon, Gyeonggi, Chungcheongnam, Chungcheongbuk, Gyeongsangbuk, Gyeongsangnam, Jeollabuk, Jeollanam) by NAS-RDA extension officers. Apiary selection emphasised representativeness of national acacia-honey production, with 17 stationary (fixed) and 10 partially or fully migratory operations included. For each apiary, 65 variables were collected across six categories: demographic (operator background, location, longevity), management (hive type, Varroa treatment frequency and chemicals, supplemental feeding, queen replacement), colony performance (overwintering mortality, current colony count, comb coverage, brood pattern), weather perception (operator-rated severity of selected anomalies during the preceding winter and early spring), nectar flora composition, and a buildup grade assigned by the resident apiarist on a three-level ordinal scale (poor/same/good) relative to that operation’s historical baseline. The apiary-level raw data are anonymised at the publication stage by replacing operator names with synthetic site identifiers (FX_001-FX_017 for fixed and MG_001-MG_010 for migratory), with the lat - lon mapping retained in a private supplementary file.
2. Gridded climate data
We used three complementary 1-km gridded daily archives covering the Korean Peninsula. Historical observations (1991-2026) were the official KMA Automated Synoptic Observation System (ASOS) and Automated Weather System (AWS) products interpolated to a 1-km grid using the inverse-distance-weighted approach with elevation correction described in Kang and Han (2012); 11 stations in the North Korean ASOS network and 8 stations from the Korea Forest Service Agricultural Meteorology Observation System (AMOS) supplemented coverage in mountainous and northern regions. Climatological normals (1991-2020) were computed as 30-year means and standard deviations for each calendar day at each pixel, following the WMO 8th Edition standard (WMO, 2017). Future projections (2021-2100) used the KMA-downscaled UKESM1-0-LL CMIP6 product at 1-km resolution under three Shared Socioeconomic Pathway scenarios (SSP1-2.6, SSP2-4.5, SSP5-8.5). UKESM1 was selected because it is the only currently available 1-km downscaled product for Korea; we acknowledge the limitations of single-model projections (Section 4.5) and discuss multi-model extension as a near-term research priority. Eight variables were processed throughout: Tmax, Tmin, Tavg, diurnal range Tgap, relative humidity (HMDT), wind speed (WDSP), solar radiation, and precipitation (Rn). The peninsular grid contains 224,060 land pixels; for the apicultural-relevant analysis we additionally extracted a 77,000-pixel acacia mask covering the elevation range 300-1,000 m where Robinia pseudoacacia is concentrated, though we report results primarily for the full peninsula in this paper.
3. Z-score standardisation and variability indices
For each pixel and each calendar day, we computed a daily z-score relative to the 1991-2020 climatological normal:
| (Eq. 1) |
where X(d, p) is the observed (or projected) daily value at pixel p on calendar day d, and μref and σref are the corresponding 30-year reference mean and standard deviation. The z-score formulation has the critical advantage that it normalises for regional baseline differences-a 25℃ day in southern Jeju is climatologically routine, but in northern Gangwon it represents a substantial departure-so the resulting indices are directly comparable across the peninsula and across observation versus projection periods. From the daily z-score series for each variable and each spring season (1-5 month, 151 days), we derived seven variability indices (Table 1), spanning count-based extremes (n_extreme_abs1, n_z_gt15, n_z_lt15), distributional spread (sd_z), oscillation frequency (reversals), and rate-of-change (mean_abs_diff, max_abs_diff). The framework occupies the middle ground between purely meteorological indicators (e.g., the ETCCDI suite of Zhang et al., 2011) and biologically motivated indices, with each component selected for mechanistic relevance to a specific bee colony process while remaining computable from standard meteorological data.

Seven variability indices computed from daily z-score series over each spring (1-5 month, 151 days) at each pixel. Indices align with the ETCCDI extreme-indices framework of Zhang et al. (2011) where applicable, with biologically motivated extensions
4. Statistical analyses
Trends in annual variability indices over 1991-2026 were assessed using the non-parametric Mann-Kendall test (Mann, 1945; Kendall, 1948), which does not require distributional assumptions and is robust to outliers. Magnitude was estimated using the Theil-Sen slope (Sen, 1968). The percentage change between decadal means (1991-2000 vs 2017-2026) was computed as a complementary, more interpretable summary that directly represents the scale of change as experienced by contemporary apiarists relative to those operating thirty years earlier. Discrete regime-shift detection was performed using the Pettitt test (Pettitt, 1979) at each combination of variable×index (8×7=56 series) at the national scale, with multiple-comparison correction noted in the results. For the 2026 group comparisons (poor vs same vs good buildup), we used Mann-Whitney U for pairwise migratory ratio differences (Mann and Whitney, 1947) and Spearman rank correlation between numerical buildup score and migratory ratio. For the SSP projections, percentage changes between projection windows (2030s, 2050s, 2080s) and the 1991-2020 baseline were computed at the peninsular and 17-region scale. The statistical significance hierarchy follows the convention of environmental statistics: ★★★p<0.001, ★★p<0.01, ★p<0.05, •p<0.10, - n.s.
5. Five policy analyses and the Climate Resilience Risk Index
Five operational policy analyses (A1-A5; Table 2) were designed to translate the climatological findings into decision-relevant indicators. The thresholds embedded in each analysis (e.g., 8℃×3 days for activation, z>+1.5 for the climate-derived mite-risk proxy) were chosen for biological interpretability rather than statistical optimisation, and each was tested through systematic sensitivity analyses (5-18 combinations per analysis) to verify that qualitative conclusions are robust to plausible variations. The CRRI (A5) integrates past variability change, future climate acceleration, and the climate-derived mite-risk proxy into a composite score for each of the 17 administrative regions:
| (Eq. 2) |
Threshold, primary literature support, and sensitivity-test range for each of the five policy analyses (A1-A5)
where P(i), F(i), M(i) are min-max normalised within the 17 regions to lie in [0, 1]. The 30/50/20 weighting reflects the IPCC AR6 (2023) and Stern Review (2007) principle that future-cost-avoidance should be weighted more heavily than past observation, and that locally controllable risks (mite, via management) should weight less than locally uncontrollable climate trends. We tested five alternative weighting schemes (Past-First 50/30/20, Future-First 20/60/20, Equal 33/33/33, Past-Heavy 50/30/20, baseline 30/50/20); Spearman rank correlations between the baseline ranking and alternatives ranged from ρ=0.46 to 0.89, with the top-3 high-priority regions remaining nearly identical across schemes.
RESULTS
1. The 2026 case study
The April 2026 survey documented 19.3% mean overwintering colony mortality across the 27 apiaries (5,754 colonies pre-winter reduced to 4,644 post-winter), with 17 (63.0%) graded poor, 6 (22.2%) graded same, and only 4 (14.8%) graded good. Comparison of management and outcome variables across the three groups reveals a striking inter-group contrast in migratory ratio (Table 3, panel A; Fig. 2 panel b): poor apiaries averaged 39.95% migratory ratio versus only 12.92% for good apiaries-a 3.1-fold difference. The Mann-Whitney U comparison between poor and good groups produced p=0.107, falling short of conventional significance largely owing to the small sample (n=17 vs n=4); however, the effect size was substantial, and a more striking pattern emerged when apiaries were stratified by migratory class: among the seven apiaries with migratory ratios exceeding 50%, six were graded poor (86%) and zero were graded good. The complete absence of “good” outcomes in this high-migration class, defined a priori from operational classifications, provides qualitative support for the pre-registered hypothesis that high migration is associated with elevated buildup vulnerability under contemporary climate conditions. Overwintering mortality also varied across grades (poor 23.2%, same 16.5%, good 8.8%; Pearson r=-0.30, p=0.13 against numerical buildup score), while Varroa treatment frequency was nearly identical across groups (poor 4.4/same 4.2/good 4.0), suggesting that management response intensity was not the discriminating factor.
Peninsula-mean warm extreme day counts (Tavg z>+1.5) projected for three SSP scenarios across three 30-year windows
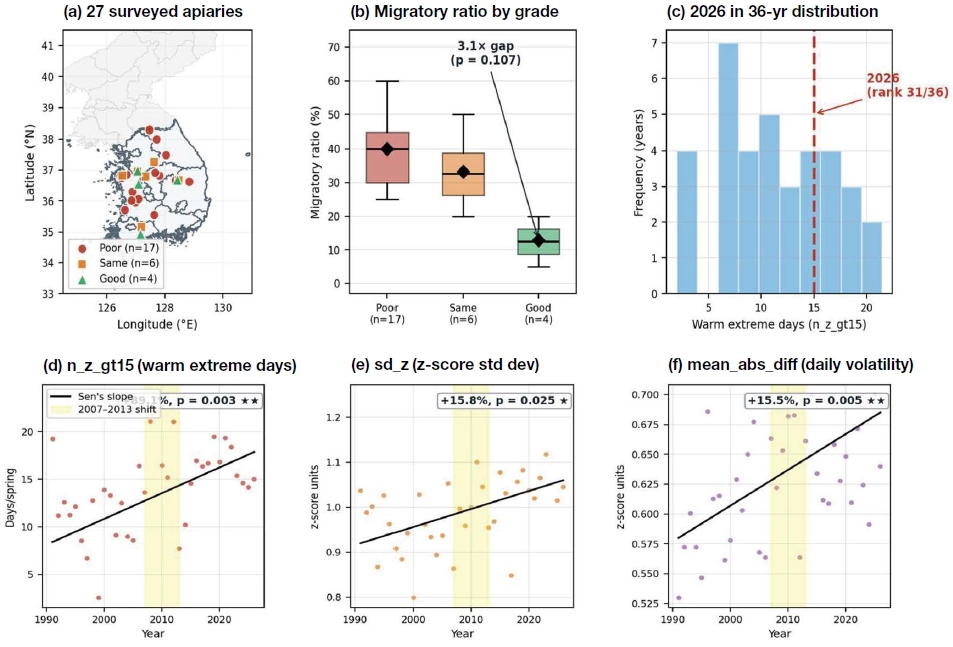
27-apiary survey and 36-year variability time series. Top: (a) Geographic distribution of the 27 surveyed apiaries on the Korean Peninsula (NK shown in grey for reference) coloured by spring buildup grade. (b) Migratory ratio across the three buildup grades, showing the 3.1×gap between poor (39.95%) and good (12.92%) groups. (c) 2026 (red dashed line, rank 31/36) plotted against the 36-year distribution of warm extreme days-2026 was a meteorologically unremarkable year. Bottom: (d-f) 27-apiary mean spring (1-5 month) variability indices over 1991-2026 with Sen’s slope (black) and the 2007-2013 regime-shift window (yellow shading): (d) warm extreme days (+89.1%, p=0.003), (e) z-score standard deviation (+15.8%, p=0.025), (f) daily volatility (+15.5%, p=0.005).
A central question raised by the survey results was whether the high incidence of poor buildup grades in 2026 reflected an unusually severe spring meteorology that year, or rather reflected the cumulative consequence of decadal trends acting on a climatologically ordinary spring. Ranking 2026 against the 36-year (1991-2026) distribution for the 27-apiary mean (Fig. 2, panel c) gave an unambiguous answer: 2026 was meteorologically unremarkable. The mean number of warm extreme days (Tavg z>+1.5) was 15 days-ranking 31st of 36 (the 6th-fewest); the count of total extreme days (|z|>1.0) was 39, below the 36-year mean of 50; and sd_z was 0.99, also below the 36-year mean of 1.03. None of the seven variability indices placed 2026 in the upper or lower 25% of the historical distribution. This finding rules out the simple hypothesis that 2026 was a “bad year” in any conventional climatological sense, and shifts the interpretive burden toward the multi-decadal trend analysis presented in §3.2.
2. Historical trends, 1991-2026
Mann-Kendall trend tests on the 27-apiary mean spring (1-5 month) variability indices over 1991-2026 reveal a strongly asymmetric warm-side intensification (Table 4, panel B). The mean number of warm extreme days (n_z_gt15) rose from 8.4 days/spring in 1991-2000 to 18.2 days/spring in 2017-2026, an increase of +89.1% (Sen’s slope=+0.27 d/year, p=0.003)-the most strongly significant trend among the seven indices. Distributional spread (sd_z) rose by +15.8% (p=0.025), and daily volatility (mean_abs_diff) rose by +15.5% (p=0.005), both reaching conventional significance. In contrast, cold extreme days (n_z_lt15) showed only a +12.6% change with p=0.785, providing no evidence for a directional trend. The maximum daily change (max_abs_diff) and reversal frequency showed marginal trends at p=0.058 and p=0.145 respectively. Considered jointly, four of seven indices reached p<0.05 with a fifth at marginal significance, indicating that the multi-dimensional framework captures systematic climate change that no single summary statistic would have revealed. The asymmetric warm-side dominance-warm extremes intensifying strongly while cold extremes remain essentially stable-is consistent with the Korean spring extreme-temperature trends documented by Choi (2008) and Park et al. (2017), and it is biologically critical because it implies that the Korean spring temperature distribution is becoming positively skewed rather than simply shifting upward.
Climate Resilience Risk Index (CRRI) ranking of the 17 South Korean administrative regions
Spatial robustness was assessed by replicating the four headline trend analyses using the spatial average of all 224,060 peninsular pixels. The 27-apiary trends and the full-peninsula trends were quantitatively concordant: for n_z_gt15, the apiary-scale p of 0.001 was paralleled by a peninsular p of 0.003; for sd_z, 0.018 vs 0.011; for mean_abs_diff, 0.006 vs 0.036; for max_abs_diff, 0.072 (•) vs (★)-the only deviation toward stronger significance at the larger scale, consistent with greater statistical power at higher pixel counts. This concordance supports the inference that the 27-apiary signal is genuinely representative of the peninsular climate, and that the buildup vulnerability documented in 2026 reflects a peninsula-scale climate change signal rather than localised microclimate idiosyncrasies.
Pettitt change-point detection across all 56 variable×index combinations identified 12 change-points at p<0.05, with the four strongest results clustered tightly within 2007-2013 (Fig. 3, panels a-d): HMDT sd_z at 2009 with +18.3% (p=2×10⁻⁵); HMDT n_z_gt15 also at 2009 with +128.8% (p=2×10⁻⁴); WDSP reversals at 2007 with -36.7% (p=3×10⁻⁴); and Tavg n_z_gt15 at 2013 with +69.9% (p=0.018). The probability of four of the most strongly significant change-points across 56 tests falling within a single 7-year window under uniform null distribution is on the order of 10-3, providing strong evidence that 2007-2013 marks a genuine multi-variable regime shift in Korean spring climatology. This timing is consistent with Pacific Decadal Oscillation phase transitions documented in Yeh et al. (2006) and Lee and Wang (2014), and with the East Asian summer monsoon weakening reported by Ho et al. (2003), suggesting that the regime shift is one regional manifestation of broader hemispheric climate change rather than a Korea-specific anomaly.
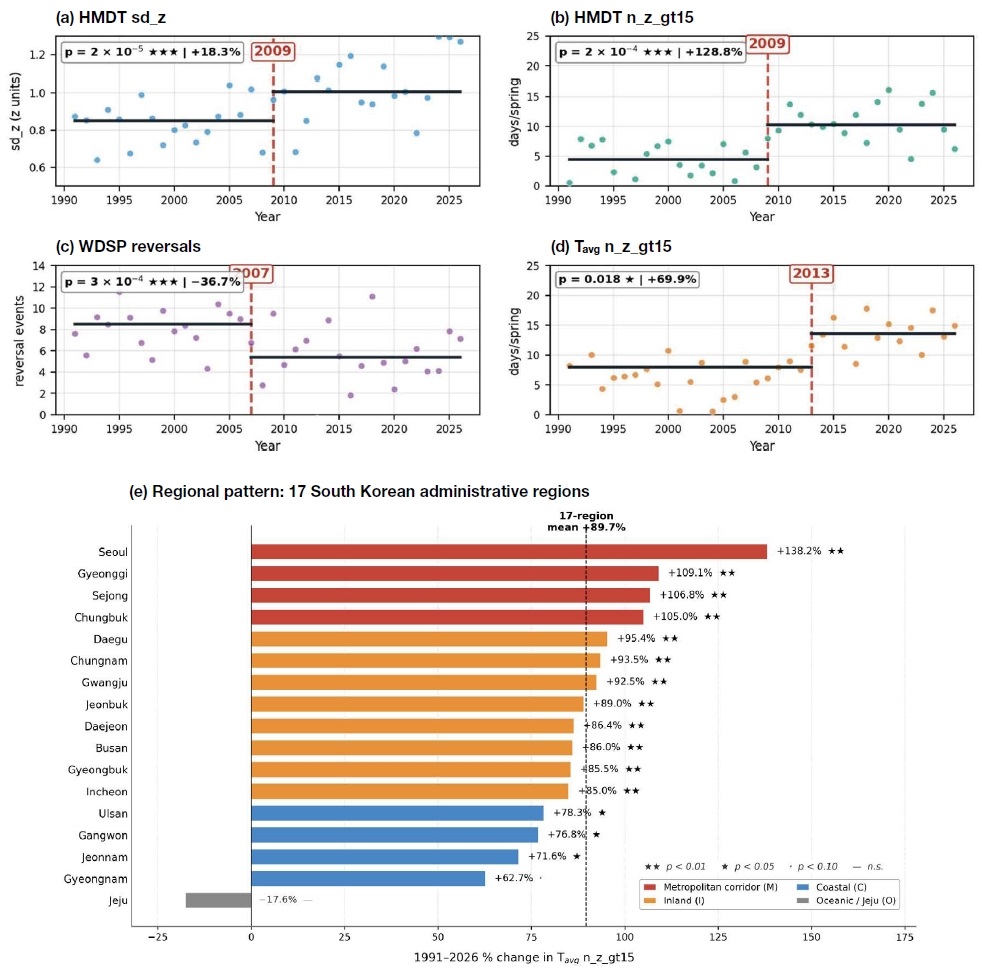
Multi-variable regime shift and regional pattern. (a-d) Pettitt change-point detection for the four most significant cases: HMDT sd_z (2009, p=2×10⁻⁵), HMDT n_z_gt15 (2009, p=2×10⁻⁴), WDSP reversals (2007, p=3×10⁻⁴), and Tavg n_z_gt15 (2013, p=0.018). Vertical dashed lines indicate detected change-points; horizontal solid lines show pre- and post-change means. (e) 1991-2026 percentage change in Tavg n_z_gt15 across the 17 South Korean administrative regions, sorted high to low and coloured by climatological class (M=metropolitan, I=inland, C=coastal, O=oceanic/Jeju).
Regional patterns across the 17 South Korean administrative regions reveal striking heterogeneity (Fig. 3 panel e, Fig. 4 panel a). Of the 17 regions, 15 (88%) showed statistically significant warming-extreme increases at p<0.05, indicating that the peninsular trend is broadly distributed rather than concentrated in a few hotspots. The largest changes occurred in the metropolitan corridor: Seoul +138.2%, Gyeonggi +109.1%, Sejong +106.8%, Chungbuk +105.0% (all p<0.01), with the central provinces approximately doubling their warm-extreme-day counts over the 36-year record. The 17-region mean was +89.7%, almost exactly matching the 27-apiary mean of +89.1%—a quantitative confirmation of representativeness. The single regional outlier in the opposite direction is Jeju Special Self-Governing Province, which showed a non-significant decrease of -17.6% (p=0.422); this Jeju anomaly is explicable by oceanic moderation reducing temperature variability relative to peninsular interior conditions, consistent with the maritime-continentality contrast documented in Korean regional climatology (Kang and Han, 2012).
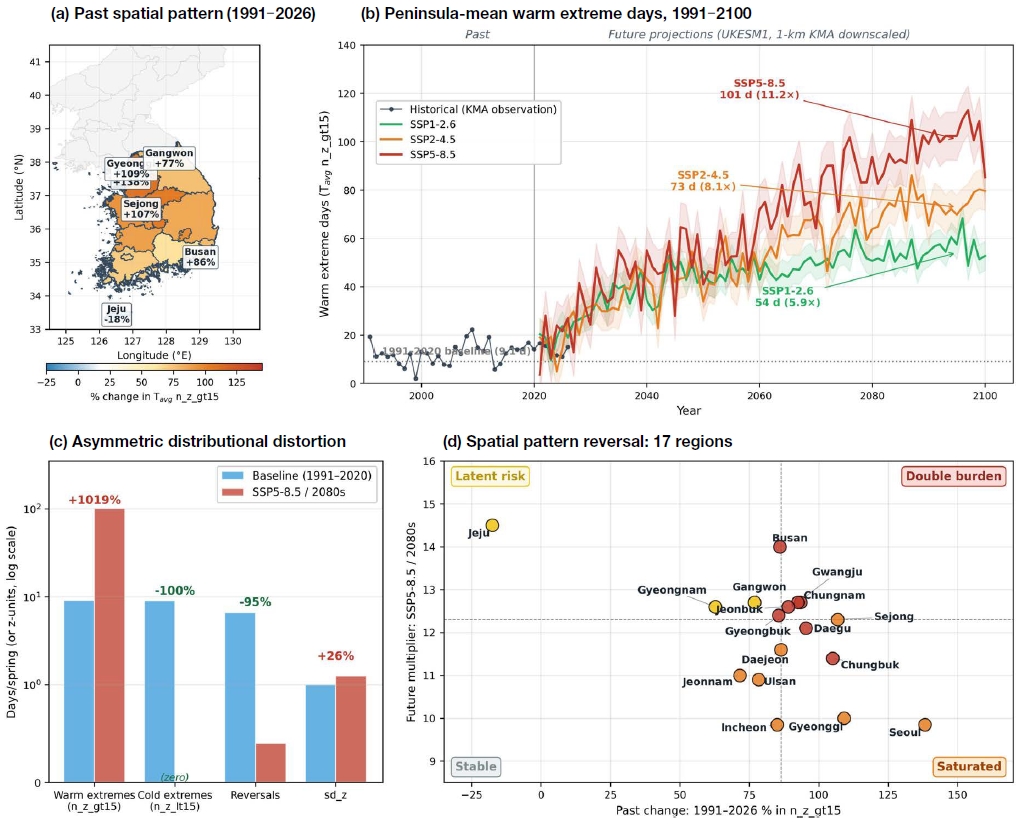
SSP futures and spatial pattern reversal. (a) 17-region map of 1991-2026 percentage change in Tavg warm extreme days (red=strongest increase, blue=decrease). (b) Continuous 1991-2100 time series of peninsula-mean warm extreme days: black=historical KMA observation, coloured=SSP1-2.6 (cyan), SSP2-4.5 (orange), SSP5-8.5 (red); 1991-2020 baseline 9.1 d shown as horizontal dashed reference. (c) Asymmetric distortion under SSP5-8.5/2080s: warm extremes +1019%, cold extremes -100%, reversals -95%, sd_z +26%. (d) Spatial pattern reversal scatter: 17 regions positioned by past change (x-axis) versus future SSP5-8.5/2080s multiplier (y-axis), with four-quadrant classification overlaid; medians indicated by dashed lines.
3. Future projections under SSP scenarios
Peninsula-mean warm extreme day projections under three SSP scenarios across three 30-year windows are summarised in Table 4 and Fig. 4 panel b. The 1991-2020 baseline mean of 9.1 days/spring rose to 13.7 days/spring during the recent observation window 2017-2026 (1.5×), confirming that the trends documented in §3.2 are continuing to accelerate into the present. By the 2030s, all three scenarios converge on approximately 38-44 days/spring (4.2-4.9× baseline), reflecting the near-term climate-system inertia documented in IPCC AR6 (2023). Beyond mid-century, however, scenarios diverge sharply: by the 2080s, SSP1-2.6 stabilises at 54 days/spring (5.9×), SSP2-4.5 reaches 73 days/spring (8.1×), and SSP5-8.5 attains 101 days/spring (11.2×). The SSP5-8.5/2080s projection implies that approximately two-thirds of the 151-day spring window would consist of climatological warm extremes-a regime in which the very category of "“extreme” loses its statistical meaning relative to the original 1991-2020 baseline.
Beyond the change in mean warm extreme day count, the SSP projections reveal a striking asymmetric reshaping of the spring temperature distribution that parallels but greatly amplifies the historical asymmetry of §3.2. Under SSP5-8.5/2080s (Fig. 4 panel c), three concurrent changes redefine the character of the Korean spring: warm extreme days rise from 9.1 to 101 days (an 11.2-fold increase, or +1019%); cold extreme days fall from approximately 9 to 0 days (a complete loss, -100%); and reversal events fall from 6.6 to 0.4 events per spring (-95%). The standard deviation of daily z (sd_z) increases by 26% over the same period-but this increase is composed almost entirely of one-sided warm-tail extension rather than symmetric distributional broadening. The resulting future spring climate is best characterised not as “more variable” in the colloquial sense, but as “uni-directionally extreme”: a regime in which day-to-day weather varies primarily within the warm range, with rare excursions to cold and few transitions between states. This unidirectional fixation has profound apicultural consequences distinct from those of symmetric climate intensification: the natural rhythm of cluster formation, brood expansion, and cluster reformation that aligns with bee colony thermoregulatory cycles (Stabentheiner et al., 2010) is largely lost, and Varroa populations may face accelerated reproduction with simultaneously diminished cold-induced brood mortality based on European observational evidence (Le Conte et al., 2010; Smoliński et al., 2021), though direct measurement of Korean mite dynamics under the projected regime remains to be conducted.
A particularly striking feature of the SSP projections isthe spatial pattern reversal across the 17 administrative regions (Fig. 4 panel d). The historical record showed metropolitan corridor concentration-Seoul leading at +138.2%, the central corridor doubling. Under SSP5-8.5/2080s, this pattern reverses substantially: Seoul becomes one of the slower-warming regions with only a 9.85×multiplier, while Jeju Island leads with a 14.5×multiplier, followed by Busan (14.0×), Gangwon (12.7×), and Gyeongnam (12.6×). The 17-region mean future multiplier is 12.9×baseline. The mechanism behind this reversal is a saturation effect in the climatological normalisation: Seoul’s high baseline variability (urban heat island plus continental interior) means that even substantial future warming produces a smaller signal in z-score units relative to the local σ; conversely, oceanic-influenced regions with low baseline variability have proportionally larger relative-extreme amplification. This is consistent with the local-σ-dependent amplification documented in CMIP6 East Asian evaluation work (Jiang et al., 2020) and has important policy consequences: regions historically viewed as climate refugia (Jeju, southern coast) may not retain that status under high-emission forcing. The four-quadrant classification-double burden (high past+high future), saturated (high past+low future), latent risk (low past+high future), and stable (low past+low future)-formalises this insight, and notably no Korean region falls in the stable quadrant under SSP5-8.5/2080s.
4. Five policy-relevant analyses and the CRRI
The five policy analyses translate the climatological findings into operationally meaningful indicators. Spring activation timing (A1) advanced from DOY 89.4 in 1991-2000 to DOY 80.4 in 2017-2026, a forward shift of 9.0 days (p=0.021), with the largest shifts in central-northern provinces (Gyeonggi -12.0 d, Gangwon –11.0 d, Chungnam -10.2 d). The 18-combination sensitivity analysis confirmed all combinations produced negative Sen slopes, with 11 of 18 reaching p<0.05. Mite activation risk-proxy days (A2) rose from 6.2 to 11.2 days/spring, an increase of +80.6% (p=0.005), provisionally applying the Smoliński et al. (2021) temperature-mite association as a climate-based proxy in the Korean context, pending direct empirical validation; regional decomposition revealed extreme heterogeneity, with Seoul +192.9% versus Gangwon +17.1% (11.3-fold range). The 15-combination sensitivity analysis produced uniformly positive trends with all combinations significant at p<0.05. Migratory beekeeping vulnerability (A3) showed the 3.1-fold poor-vs-good ratio established in §3.1, with the deterministic finding that 0/7 apiaries in the ≥50% migratory class achieved a good buildup grade. Acacia bloom DOY (A4) advanced from 104 to 94 (-9.9 d, p=0.081), nearly perfectly tracking the activation-date advance, with the activation-to-bloom interval remaining approximately constant (14.6 → 13.6 d): the entire spring biological calendar is sliding earlier together rather than producing a temporal mismatch.
The Climate Resilience Risk Index (CRRI; Eq. 2) integrates these findings into a single composite for each of the 17 regions (Table 4; Fig. 5 panel a). Busan emerges as the highest-priority region (CRRI=0.685, classified high-priority under our threshold≥0.66), followed by Gwangju (0.657), Sejong (0.651), Chungnam (0.643), and Jeonbuk (0.635) in upper-medium priority. Six regions fall in the double-burden quadrant (Busan, Chungnam, Jeonbuk, Daegu, Chungbuk, Gyeongbuk), eight in saturated, three in latent risk (Jeju, Gangwon, Gyeongnam), and-importantly-zero in the relatively stable quadrant. This indicates that no part of South Korea is climate-change-exempt under SSP5-8.5 forcing, contrasting with regional risk maps for some other agricultural domains where peripheral regions sometimes serve as climate refugia. The implication is that Korean apicultural adaptation must proceed nationwide rather than concentrate on a few highest-risk regions. The robustness of the CRRI ranking to weight choice was confirmed through five alternative weighting schemes, with Spearman rank correlations between baseline and alternatives ranging from ρ=0.46 (Past-First) to 0.89 (Future-First), and the top-3 high-priority regions remaining nearly identical across schemes.
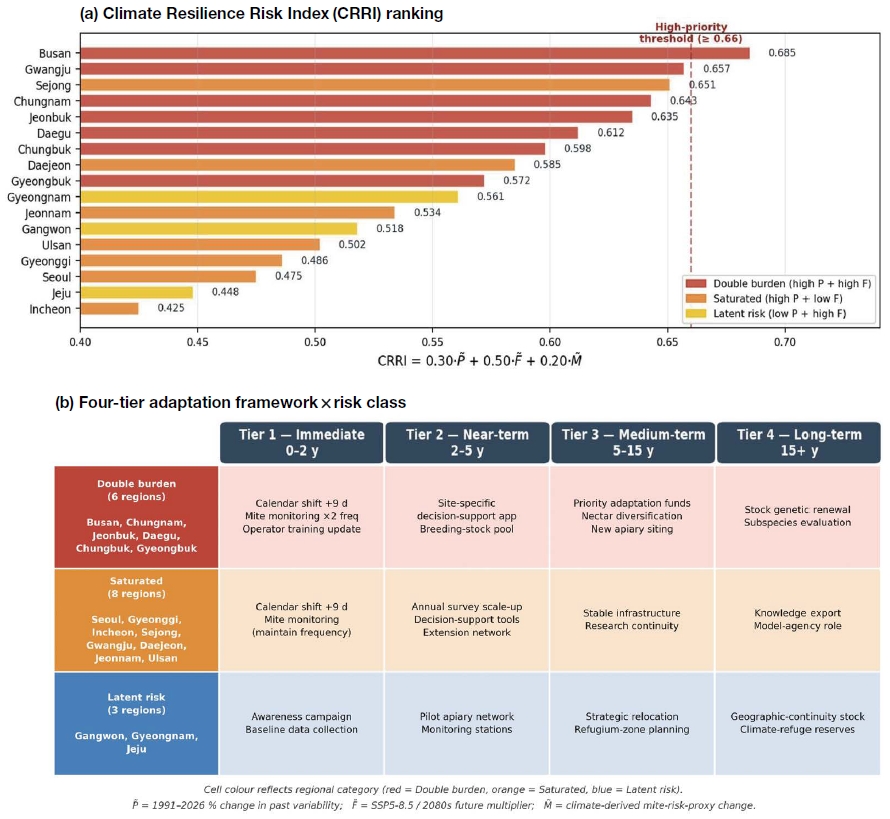
Climate Resilience Risk Index and four-tier adaptation framework. (a) CRRI horizontal bar chart for the 17 South Korean administrative regions, sorted from highest (Busan, 0.685) to lowest (Incheon, 0.425); high-priority threshold ≥0.66 indicated by red dashed line. Bars coloured by four-quadrant classification: red=double burden, orange=saturated, yellow=latent risk; no Korean region falls in the relatively stable category under SSP5-8.5/2080s forcing. (b) Four-tier×three risk-class adaptation policy matrix: rows are risk classes, columns are time horizons (Tier 1 immediate to Tier 4 long-term); each cell contains recommended priority interventions; cell colour intensity (left to right) is an urgency proxy.
The five policy analyses jointly motivate a four-tier adaptation framework (Fig. 5 panel b) organised across time horizons (immediate 0-2 y; near-term 2-5 y; medium-term 5-15 y; long-term 15+ y) and risk classes (double burden, saturated, latent risk). Tier 1 (immediate) interventions are within-toolkit adjustments deployable with existing institutional capacity: shifting first-inspection dates earlier by 9-12 days in central-northern provinces, intensifying Varroa monitoring and treatment in regions with highest mite-risk-day acceleration, and providing climate-resilience training to high-migration operations. Tier 2 (near-term) addresses information-system gaps: expanding the 27-apiary annual survey to a 80-100 apiary multi-year design with adequate statistical power, deploying decision-support apps that translate gridded climate forecasts into apiary-level recommendations, and integrating SSP information into bee-stock breeding programs. Tier 3 (medium-term) prioritises adaptation investment in the six double-burden regions identified by the CRRI, establishes climate-buffered model apiaries in latent-risk regions like Jeju to test peripheral adaptation strategies, and supports nectar source diversification beyond R. pseudoacacia. Tier 4 (long-term) addresses the qualitative climate transformation projected for the second half of the century: alternative bee-stock genetics, fundamental reconceptualisation of Korean apicultural geography as the spatial pattern reverses, and engagement with the international apicultural research community on mid-latitude adaptation pathways. The framework operates across multiple time horizons because the climate transition itself unfolds across multiple time horizons, and the CRRI provides the spatial prioritisation tool that links these temporal scales into a coherent allocation framework.
DISCUSSION
1. The 2026 event reframed: cumulative variability rather than single-year anomaly
The most consequential interpretive finding of this study is that the 2026 spring buildup decline cannot be explained by exceptional within-year meteorology. The 27-apiary mean spring climate of 2026 ranked 31st of 36 years for warm extreme days, 27th of 36 for total extreme days, and showed no index in the upper or lower 25% of the historical distribution-yet the survey documented the highest concentration of poor buildup outcomes ever formally documented by NAS-RDA. This combination directly challenges the single-event framing that has dominated agricultural-meteorology interpretation of climate-related crop failures (Donat and Alexander, 2012; Perkins-Kirkpatrick and Lewis, 2020). It instead supports a reframing of the 2026 event as the climax of a multi-decadal trajectory: a moment when the cumulative variability burden experienced by Korean colonies passed a threshold beyond which conventional management tools could no longer compensate.
This reframing has scientific weight beyond the immediate Korean context. The standard climate-impact attribution framework-identifying a specific anomalous weather event as the proximate cause of an observed agricultural outcome-works well for short-cycle crops with discrete climate-sensitive phenological stages. It works much less well for biological systems whose outcomes integrate climate signals across multi-week or multi-season windows, as honey bee colonies do throughout spring buildup. The present finding suggests that, for such systems, the more appropriate analytical framework is one that asks whether the cumulative climate experience during the integrative window has crossed a biologically meaningful threshold, rather than whether any single moment within the window was anomalous. This shift in framing aligns with the broader meteorological literature on climate-impact attribution that has moved away from event-based attribution toward distributional and trajectory-based interpretation (Zhang et al., 2011; Seneviratne et al., 2021). The cumulative-variability hypothesis also helps reconcile a paradox in the international apicultural literature, where colony losses are increasing in many regions despite no single climate variable showing dramatic trends in isolation: when warm extremes increase but cold extremes remain stable, when distributional spread expands but mean temperature changes only modestly, the cumulative effect on a multi-week-integrating biological system can be substantial even though no individual climate metric shows a dramatic shift.
2. The 2007-2013 regime shift in East Asian climatic context
The Pettitt change-point clustering at 2007-2013 provides a dated reference point against which the lived experience of practising apiarists can be calibrated. The Korean Beekeepers’ Association has reported that the late 2000s marked a perceived inflection in management calendar reliability (KBA, 2023), and our formal change-point statistics provide the missing quantitative documentation. Three features of the transition warrant attention. First, the transition involved multiple variables simultaneously (humidity, wind, temperature) rather than a single dominant variable, indicating a coordinated synoptic-scale shift rather than a localised perturbation. Second, the transition direction is consistently away from 1991-2007 baseline conditions in apiculturally adverse directions: humidity variability increased, wind oscillation decreased, warm extremes intensified. Third, the timing aligns with broader East Asian climate-shift findings: PDO transitions documented by Yeh et al. (2006) and Lee and Wang (2014); East Asian winter monsoon weakening reported by Ho et al. (2003); and the more recent reduction in synoptic-scale cyclonic activity over the Korean Peninsula documented in CMIP6 evaluation work (Jiang et al., 2020). The Korean spring transition therefore appears to be one regional manifestation of a hemispheric-scale shift rather than a Korea-specific anomaly, suggesting that similar transitions may be detectable in the spring climatology of other East Asian temperate regions-an empirical question that future comparative studies should examine.
3. SSP futures: qualitative transformation, not quantitative intensification
The SSP projections reveal a future trajectory in which Korean spring climate undergoes a qualitative transformation rather than a quantitative intensification of present conditions. Under SSP5-8.5/2080s, the very category of “warm extreme” loses its statistical meaning relative to the original baseline, the natural rhythm of warm-cold oscillation that has historically structured colony cluster cycles is largely lost, and the spatial pattern of greatest change reverses from metropolitan corridor concentration to peripheral and southern-coastal concentration. Adaptation strategies designed for a more extreme version of the present climate will systematically fail under a qualitatively different climate. The asymmetric distortion has additional implications for Varroa population dynamics: the historical co-occurrence of warm and cold extremes during spring may have provided a natural seasonal ceiling on Varroa reproduction (inferred from European observational evidence: Le Conte et al., 2010; Smoliński et al., 2021), and the disappearance of cold extremes under SSP5-8.5 may relax this thermal constraint, with potential implications for mite population dynamics that warrant empirical validation through systematic field measurement in Korea. The Jeju spatial-reversal anomaly is particularly instructive: as a historical climate-refugium of Korean apiculture (smallest historical change at -17.6%), Jeju’s high future multiplier (14.5×) under SSP5-8.5/2080s arises because its low baseline variability-the source of historical stability-amplifies relative-extreme increases under future absolute warming. This finding has general resonance: in many regions worldwide, areas serving as climate refugia owe their stability to mechanisms (oceanic moderation, elevation, latitude) that may not scale linearly with global warming, raising the possibility that today’s climate refugia may not be tomorrow’s.
4. Adaptation framework, sensitivity, and limitations
The four-tier adaptation framework distinguishes itself from earlier apicultural adaptation efforts in three respects: (i) explicit pairing of time horizons with adaptation depth (within-toolkit immediate vs substantive innovation long-term); (ii) integration of spatial prioritisation through the CRRI; and (iii) philosophical grounding in cumulative-variability rather than single-event framing. Comparable international frameworks—the EU Beekeeping Programme (Regulation 2021/2115), the North American Pollinator Protection Campaign, the Australian Honey Bee Industry Council strategic plan-organise interventions by funding category, sector, or intervention type without explicit attention to the time horizon at which each should operate. The Korean four-tier framework therefore offers a template that other national apicultural systems facing similar climate transitions might productively adapt. Sensitivity testing across the five policy analyses produced strong robustness reassurance: every qualitative trend direction was independent of threshold choice, with no tested combination producing an opposite trend in any analysis; quantitative magnitudes varied by approximately ±25% across the tested ranges; and the CRRI top-priority regions remained nearly identical across five alternative weighting schemes.
Five principal limitations warrant explicit acknowledgement. First, the field survey is single-year (n=27) and cannot directly validate the cumulative-variability hypothesis through temporal comparison; we recommend a multi-year survey (80-100 apiaries/year, 5+ years) as Tier 2 priority. Second, the survey's management-data granularity does not include within-season management timing, limiting our ability to directly test whether the activation-date advance has produced operational mistiming at specific apiaries. Third, the SSP projections rest on a single GCM (UKESM1) downscaled to 1-km by KMA; multi-model ensembles (5-10 GCMs) are best practice (IPCC AR6, 2023), and we expect the qualitative findings to be robust across models while quantitative magnitudes may shift somewhat. Fourth, the policy framework has not been formally validated through expert elicitation with Korean apicultural stakeholders; we recommend a structured Delphi panel or Analytic Hierarchy Process exercise involving 15-25 stakeholders to refine recommendations and verify that tier assignments reflect operational priorities as practitioners understand them. Fifth, the mite-activation risk-proxy index (A2) is a climate-derived indicator based on the spring warmth-autumn Varroa infestation association documented by Smoliński et al. (2021) in central-European apiaries; no direct measurements of Varroa mite density, reproductive rate, or seasonal population dynamics were collected as part of the present 27-apiary survey or the 1991-2026 historical analysis. Inferences about Korean Varroa trajectories should therefore be interpreted as climate-based hypotheses rather than direct evidence of mite dynamics, and apiculturally relevant magnitudes may differ from the European source population owing to differences in Korean dominant mite haplotypes, treatment chemistry mixes, and management traditions. Systematic Varroa monitoring across the CRRI high-priority regions, ideally coupled with the proposed multi-year apiary survey expansion, is therefore recommended as a near-term research priority to convert the present proxy-based inference into directly validated risk assessment.
5. Future research directions
Four broader research directions emerge naturally from the present analysis. First, the variability framework should be applied to other temperate-zone apicultural systems in East Asia (Japan, north-eastern China, Russian Far East) to test whether the Korean findings generalise to the broader regional context, particularly given that the 2007-2013 regime shift appears to be one manifestation of a hemispheric-scale phenomenon. Second, the framework should be coupled with bee-colony population models to translate climate variability into specific colony-level outcome predictions that can guide management decisions; this would address the limitation that the present analysis is descriptive and inferential rather than predictive. Third, the 2007-2013 regime shift identified by Pettitt analysis warrants dedicated investigation linking it to specific large-scale climate drivers (Pacific Decadal Oscillation, Arctic sea ice, East Asian monsoon transition) that may explain its physical origins, drawing on the meteorological literature reviewed throughout this paper (Ho et al., 2003; Yeh et al., 2006; Lee and Wang, 2014). Fourth, the relationship between climate variability and other apicultural stressors (pesticides, habitat loss, pathogens) should be examined through a comprehensive multi-stressor analysis that goes beyond the climate-focused scope of the present study. Specifically, the proxy-based mite-risk findings of the present study should be the immediate target of empirical validation through systematic Varroa density monitoring across regions with contrasting climate-trend trajectories (e.g., Seoul +192.9% vs Gangwon +17.1% in A2 acceleration), to test whether the Smoliński et al. (2021) European association extends quantitatively to Korean management contexts.
CONCLUSIONS
This study integrated a 2026 field survey, 1991-2026 multi-decadal trend analysis, and 2021-2100 SSP projection to address the central question of whether the 2026 South Korean spring buildup decline reflected exceptional within-year meteorology or the cumulative climax of a longer-term climatological trajectory. Five empirical conclusions emerge. First, the 2026 spring was meteorologically unremarkable-ranking 31st of 36 years for warm extreme days-yet produced widespread buildup difficulty (63% of apiaries graded poor), supporting the cumulative-variability hypothesis. Second, the 1991-2026 record shows asymmetric warm-side variability increases at the peninsular scale (warm extremes +89.1%, p=0.003), with cold extremes essentially stable, consistent with broader East Asian climate-shift findings. Third, Pettitt change-point analysis identifies a clustered 2007-2013 multi-variable regime transition, providing a dated transition consistent with practitioner experience and with PDO/monsoon-driven hemispheric shifts. Fourth, SSP5-8.5/2080s projections show a qualitative climate transformation in which warm extremes reach 101 of 151 spring days (11.2×baseline), cold extremes effectively disappear, and the spatial pattern reverses from metropolitan corridor to peripheral concentration-no Korean region falls in the climate-stable quadrant. Fifth, the composite Climate Resilience Risk Index identifies Busan, Gwangju, Sejong, Chungnam, and Jeonbuk as the five highest-priority regions for adaptation investment.
These findings translate into a four-tier adaptation framework with regional prioritisation that addresses the multi-decadal climate transition documented throughout the paper. The framework is the first comprehensive time-stratified apicultural adaptation strategy known to us, and it offers a template that other national apicultural systems facing similar transitions might productively adapt. Methodologically, the multi-dimensional variability framework demonstrates that asymmetric warm-side intensification is detectable only through indices that capture distributional shape, day-to-day rate of change, and oscillation frequency simultaneously-indices that bridge the established meteorological extreme-indices framework (Zhang et al., 2011; Donat and Alexander, 2012) and the apicultural physiological literature. The framework is portable to other temperate-zone systems, and we explicitly invite future replication studies to test whether our findings on Korean spring climate generalise to the broader East Asian context.
Acknowledgments
We thank the 27 commercial apiarists who participated in the April 2026 field survey for their time and detailed cooperation. We thank the Korea Meteorological Administration for the 1-km downscaled UKESM1 SSP product, the Korea Forest Service for AMOS observation data. Helpful comments from colleagues at NAS-RDA and external reviewers improved the manuscript. This work was supported by RDA project RS-2025-02283324.
References
-
Burrill, R. M. and A. Dietz. 1981. The response of honey bees to variations in solar radiation and temperature. Apidologie 12(4): 319-328.
[https://doi.org/10.1051/apido:19810402]

- Choi, K. S. 2008. Long-term trend of extreme temperature indices over South Korea, 1973-2007. Asia-Pac. J. Atmos. Sci. 44(4): 367-378.
-
Donat, M. G. and L. V. Alexander. 2012. The shifting probability distribution of global daytime and night-time temperatures. Geophys. Res. Lett. 39(14): L14707.
[https://doi.org/10.1029/2012GL052459]
- Ho, C. H., J. H. Kim, K. M. Lau, K. M. Kim, D. Gong and Y. B. Lee. 2003. Interdecadal changes in heavy rainfall in China during the northern summer. Terr. Atmos. Ocean. Sci. 14(4): 547-564.
- IPCC (2023). Climate Change 2023: Synthesis Report. Contribution of Working Groups I, II, and III to the Sixth Assessment Report of the Intergovernmental Panel on Climate Change. IPCC, Geneva, Switzerland.
-
Jiang, D., D. Hu, Z. Tian and X. Lang. 2020. Differences between CMIP6 and CMIP5 models in simulating climate over China and the East Asian monsoon. Adv. Atmos. Sci. 37(10): 1102-1118.
[https://doi.org/10.1007/s00376-020-2034-y]
-
Kablau, A., S. Berg, S. Härtel and R. Scheiner. 2020. Hyperthermia treatment can kill immature and adult Varroa destructor mites without reducing drone fertility. Apidologie 51(3): 307-315.
[https://doi.org/10.1007/s13592-019-00715-7]
- Kang, M. and S. Han. 2012. Development of high-resolution gridded daily temperature and precipitation data over South Korea, 1971-2010. Theor. Appl. Climatol. 109(3-4): 503-516.
- Kendall, M. G. 1948. Rank Correlation Methods. London: Charles Griffin & Co.
- Korean Beekeepers’ Association (KBA). 2023. Annual report on Korean apiculture industry status. Seoul: KBA.
-
Le Conte, Y., M. Ellis and W. Ritter. 2010. Varroa mites and honey bee health: can Varroa explain part of the colony losses? Apidologie 41(3): 353-363.
[https://doi.org/10.1051/apido/2010017]
-
Lee, J. Y. and B. Wang. 2014. Future change of global monsoon in the CMIP5. Clim. Dyn. 42(1-2): 101-119.
[https://doi.org/10.1007/s00382-012-1564-0]
-
Mann, H. B. 1945. Nonparametric tests against trend. Econometrica 1 (3): 245-259.
[https://doi.org/10.2307/1907187]
-
Mann, H. B. and D. R. Whitney. 1947. On a test of whether one of two random variables is stochastically larger than the other. Ann. Math. Stat. 18(1): 50-60.
[https://doi.org/10.1214/aoms/1177730491]
- National Institute of Forest Science (NIFoS). 2025. Acacia bloom prediction map for the Korean Peninsula, 2025 update. Seoul: NIFoS.
- Park, B. J., C. Park and S. K. Min. 2017. Increased variability of Korean spring temperature under recent climate change. Int. J. Climatol. 37(14): 4793-4808.
-
Perkins-Kirkpatrick, S. E. and S. C. Lewis. 2020. Increasing trends in regional heatwaves. Nat. Commun. 11: 3357.
[https://doi.org/10.1038/s41467-020-16970-7]
-
Pettitt, A. N. 1979. A non-parametric approach to the change-point problem. Appl. Statist. 28(2): 126-135.
[https://doi.org/10.2307/2346729]
- Seeley, T. D. 2010. Honeybee Democracy. Princeton, NJ: Princeton University Press.
-
Sen, P. K. 1968. Estimates of the regression coefficient based on Kendall’s tau. J. Am. Stat. Assoc. 63(324): 1379-1389.
[https://doi.org/10.1080/01621459.1968.10480934]
- Seneviratne, S., I. Zhang, X. Adnan, M. Badi, W. Dereczynski, C. Di Luca, A., Ghosh, S. Iskandar, I. Kossin, J. Lewis, S. Otto, F. I. Pinto, M. Satoh, S. M. Vicente-Serrano, M. Wehner and B. Zhou, 2021. Weather and Climate Extreme Events in a Changing Climate. Climate Change 2021: The Physical Science Basis. Contribution of Working Group I to the Sixth Assessment Report of the Intergovernmental Panel on Climate Change (pp. 1513-1766).
- Smoliński, S., A. Langowska and A. Glazaczow. 2021. Spring temperatures in honeybee Apis mellifera populations in central Europe relate to autumn Varroa destructor infestation rates. Sci. Rep. 11(1): 22829.
- Sparks, T. H., A. Langowska, A. Głazaczow, Z. Wilkaniec, M. Bieńkowska and P. Tryjanowski. 2010. Advances in the timing of spring cleansing flights of honey bees (Apis mellifera) in Poland. Apidologie 41(6): 633-642.
-
Stabentheiner, A., H. Kovac and R. Brodschneider. 2010. Honeybee colony thermoregulation - regulatory mechanisms and contribution of individuals in dependence on age, location and thermal stress. PLoS ONE 5(1): e8967.
[https://doi.org/10.1371/journal.pone.0008967]
-
Stern, N. 2007. The Economics of Climate Change: The Stern Review. Cambridge: Cambridge University Press.
[https://doi.org/10.1017/CBO9780511817434]
-
Vicens, N. and J. Bosch. 2000. Weather-dependent pollinator activity in an apple orchard, with special reference to Osmia cornuta and Apis mellifera (Hymenoptera: Megachilidae and Apidae). Environ. Entomol. 29(3): 413-420.
[https://doi.org/10.1603/0046-225X-29.3.413]
- WMO. 2017. WMO Guidelines on the Calculation of Climate Normals (WMO No. 1203). Geneva: World Meteorological Organization.
- Yeh, S. W., Y. G. Park and B. P. Kirtman. 2006. ENSO amplitude changes due to climate change projections in different coupled models. J. Clim. 19(15): 3858-3867.
-
Zhang, X., L. Alexander, G. C. Hegerl, P. Jones, A. K. Tank, T. C. Peterson, B. Trewin and F. W. Zwiers. 2011. Indices for monitoring changes in extremes based on daily temperature and precipitation data. WIREs Clim. Change 2(6): 851-870.
[https://doi.org/10.1002/wcc.147]