
Detecting Black Locust (Robinia pseudoacacia) Flowering Areas Using UAV Imagery and Vegetation Indices
Abstract
This study presents a quantitative methodology to extract the estimated flowering area of the black locust (Robinia pseudoacacia), a primary nectar source in South Korea, utilizing vegetation indices derived from Unmanned Aerial Vehicle (UAV) RGB imagery. High-resolution UAV orthomosaics were constructed across three survey plots (500 m radius each) surrounding a domestic apiary. First, the Excess Green (ExG) index was employed to isolate green forest canopy from non-vegetated backgrounds by establishing a site-optimized threshold. To delineate the apparent blooming footprint, the Enhanced Bloom Index(EBI) was modified and optimized to align with the specific flowering traits of R. pseudoacacia. Subsequently, the Segment Anything Model Geospatial (SAMGeo) deep learning architecture automatically segmented the flowering areas into vector polygons at individual and cluster levels. Our analysis revealed that out of a total forest area of 263,315 m2, the net black locust flowering area accounted for 23,980 m2 (an average ratio of 9.1%), with individual site ratios ranging between 7.2% and 11.9%. These findings highlight that evaluating the gross forest area within a foraging radius as a uniform nectar resource introduces critical discrepancies regarding estimated available forage. Consequently, this integrated framework provides crucial baseline data to accurately estimate single-source honey yields and optimize national nectar resource management strategies.
Keywords:
UAV, Robinia pseudoacacia, Flowering, Remote sensingINTRODUCTION
Quantitative monitoring of the flowering of the black locust (Robinia pseudoacacia), a primary nectar source for honeybees in South Korea, has emerged as a critical means to ensure the sustainability of the apiculture industry amid recent climate change. Because South Korean apiculture relies heavily on R. pseudoacacia, shifts in flowering phenology and periods directly fluctuate the annual income of beekeeping households. However, increasing climate variability, such as recent abnormal high temperatures and irregular precipitation, exacerbates prediction errors for flowering onset and shortens the overall flowering period. Consequently, conventional predictive models based solely on accumulated growing degree-days (GDD) now show clear limitations in accurately estimating potential harvestable honey yields (Kim and Jung, 2025).
In this context, ultra-high-resolution remote sensing using Unmanned Aerial Vehicles (UAVs) is rapidly expanding as a viable alternative for the non-destructive observation of vegetation structures and growth status at the individual tree canopy level (Maes and Steppe, 2019; Zha et al., 2020; Istiak et al., 2023; Zhang et al., 2024). Providing relatively higher spatial resolution and more flexible spatiotemporal observation capabilities than satellites, UAVs have become a core tool in precision agriculture for quantitatively estimating crop growth, nitrogen status, pest damage, biomass, and yield (Maes and Steppe, 2019; Olson and Anderson, 2021). Extensive literature demonstrates that researchers widely apply UAV-based remote sensing to crop growth monitoring, nitrogen use efficiency, pest surveillance, and phenology tracking; moreover, integrating these systems with machine learning or deep learning techniques further enhances predictive accuracy (D’Odorico et al., 2020; Istiak et al., 2023; Raniga et al., 2024; Zhang et al., 2024). In forestry, practitioners also widely utilize UAVs to estimate structural parameters, biomass, and health status at the individual tree level (Lu et al., 2020; Cheng et al., 2024; Rosen et al., 2024). For instance, in studies of oilseed rape (Brassica napus), a major nectar crop, researchers have extensively combined UAV imagery with the Normalized Difference Yellowness Index (NDYI) to extract floral cover area, effectively demonstrating its practicality in predicting seed yield and potential honey production (Sulik and Long, 2016).
Although previous UAV studies on R. pseudoacacia have primarily focused on distribution, health status, and biomass estimation from the perspective of invasive species or protected forest management (Gary et al., 1975; Müllerová et al., 2017; Lu et al., 2020; Cheng et al., 2024), attempts to quantify flowering intensity directly linked to honey productivity remain limited. Carl et al. (2017) demonstrated the efficacy of UAV-derived flowering information for apicultural productivity evaluation by combining UAV RGB imagery with ground-based flower counts and weight measurements to estimate the number of flowers per unit area, flowering area, and potential honey yield (approximately 5.3 million flowers and 69 kg of honey per hectare). Furthermore, researchers have recently developed specialized algorithms to automatically detect white flowers, such as those of the black locust, using UAV RGB/multispectral imagery, which improves classification accuracy and reduces false positives (Atanasov et al., 2024). Some studies have even proposed methodologies to evaluate potential nectar resources alongside hive placement by simultaneously detecting white-flower areas and the distribution of surrounding honeybee colonies (Atanasov et al., 2024). Meanwhile, deep learning-based object detection and segmentation techniques, combined with transfer learning, have proven the feasibility of individual- and flower-level quantification; examples include automatically recognizing flower individuals and fractional cover in flower-rich grasslands from UAV imagery (Ding et al., 2023; Schnalke et al., 2025) and quantitatively estimating the abundance and yield of alpine medicinal plants using Mask R-CNN (Ding et al., 2023).
As described above, UAV remote sensing and artificial intelligence technologies already exhibit high potential for quantifying the distribution and abundance of floral resources in crops, forests, and grasslands at a high resolution (Woebbecke et al., 1995; Zhu et al., 2024). Nevertheless, research that directly calculates the flowering area of R. pseudoacacia reflecting the domestic beekeeping situation in South Korea, and links it to harvestable nectar biomass for migratory beekeeping planning or nectar resource management, remains scarce. Therefore, this study establishes a technical framework to quantify the practical flowering area at the individual canopy level by integrating ultra-high-resolution UAV imagery, vegetation and flower-specific indices-such as Excess Green (ExG) and a modified Excess Blue Index (EBI)-and deep learning-based object segmentation techniques. Moving beyond conventional remote sensing research centered on distribution and biomass, our approach directly numericalizes the available nectar resources for honeybees. Consequently, these findings will serve as baseline data and provide a new scientific foundation for determining optimal colony sizes in apicultural management and establishing national nectar resource conservation strategies.
MATERIALS AND METHODS
1. Study site selection and spatial bounds
To analyze the flowering characteristics of the black locust and calculate the estimated harvestable flowering area, we selected the apiary grounds of the National Institute of Agricultural Sciences (NIAS) in Wanju-gun, Jeonbuk State, South Korea (35°49ʹ29ʺ N, 127°02ʹ46ʺ E) as the study site. The topography of the study site features an alternating landscape of gentle plains and rolling hills, where the target species, R. pseudoacacia, forms localized forest stands primarily along forest edges and low hilltops. We monitored the flowering stages of the black locust flowers from the initial corolla exposure stage through full bloom. Upon reaching peak bloom, we selected three identical survey plots (Site A, Site B, and Site C) to perform simultaneous aerial imaging.
2. UAV and sensor specifications
To capture the subtle spectral characteristics of black locust flowers alongside high-resolution spatial data, we utilized an enterprise-grade Unmanned Aerial Vehicle (UAV), the Matrice 300 RTK (DJI, Shenzhen, China). For data acquisition, we equipped the platform with a Zenmuse P1, a full-frame aerial photogrammetry camera. The Zenmuse P1 delivers detailed canopy-layer imagery via its high-resolution sensor, while its integrated Real-Time Kinematic (RTK) functionality ensures high positioning accuracy, thereby minimizing spatial error rates between observation points during flowering monitoring.
3. UAV Data acquisition and preprocessing
UAV imagery was acquired using a DJI enterprise drone platform equipped with a DJI Zenmuse P1 camera sensor. The aerial imaging missions were executed at a flight altitude of 120 m above ground level (AGL). The Zenmuse P1 sensor features a high-performance full-frame format (35.9*24.0 mm) delivering an image resolution of 8,192*5,460 pixels, totaling approximately 45 megapixels. We conducted the aerial imagery data acquisition in early May, aligning with the peak flowering period of R. pseudoacacia in the Wanju region. Flight missions took place between 11:00 and 14 : 00 local time when the solar altitude is highest, to minimize the confounding effects of canopy shadows. To generate rigorous orthomosaics, we set both the forward and side overlap of the images to 70%. We then aligned the acquired individual images and generated point clouds using Pix4Dmapper software (Pix4D SA, Prilly, Switzerland), converting the outputs into the final orthomosaics.
4. Forest area extraction using excess green index
Prior to extracting the spatial boundaries of the black locust flowering zones from the high-resolution RGB orthomosaics, we removed non-vegetated areas such as roads and buildings. To isolate pure vegetation zones, we calculated the Excess Green Index (ExG), a visible-band vegetation index. The ExG accentuates the green reflectance properties of plants to effectively separate vegetation from background elements (Woebbecke et al., 1995). We derived the index based on the digital numbers (DN) of the red, green, and blue channels for each pixel using the following equation:
5. Flowering zone extraction using enhanced bloom index
To segment the estimated area occupied by black locust flowers within the green vegetation regions masked by ExG, we applied the Enhanced Bloom Index (EBI). Chen et al. (2019) originally designed the EBI to maximize the spectral signatures of flowers using UAV-based RGB and multispectral imagery. In this study, rather than adopting the original formula verbatim, we modified and optimized the equation to fit the specific characteristics of our high-resolution visible-band UAV sensor. To mitigate the impacts of uneven illumination caused by intra-canopy shadows or topography, we calculated the visible-band optimized Enhanced Bloom Index (EBI) based on the original spectral framework of Chen et al. (2019). While Chen et al. (2019) incorporated multi-scale indices, we adjusted the index to leverage the absolute brightness and spectral bounds of ultra-high-resolution RGB sensors without losing albedo data. The explicit equation applied to our orthomosaics is defined as follows:
where R, G, and B denote the raw digital numbers (DN) of the red, green, and blue channels for each individual pixel, respectively. In this framework, the numerator incorporates the total visible light reflectance, which naturally scales upward for white floral targets, while the green-to-blue ratio (G/B) in the denominator structurally suppresses the non-flowering green forest background.
6. SAMGeo-based deep learning object segmentation and flowering area calculation
To calculate the projected canopy area of individual black locust trees based on the flowering candidates identified through vegetation index analysis, we employed the deep learning-based Segment Anything Model Geospatial (SAMGeo) algorithm. SAMGeo is an open-source package designed to optimize Meta AI's foundational Segment Anything Model (SAM) for geospatial applications. Unlike conventional supervised learning models, SAMGeo leverages zero-shot inference capabilities pre-trained on massive datasets, allowing it to delineate canopy boundaries with high accuracy without requiring additional training (Wu et al., 2023). To eliminate human subjectivity and ensure complete experimental reproducibility, the generation of input polygon prompts for the SAMGeo model followed a rigid, three-tiered objective decision framework. First, candidate blooming pixels were primary-filtered based on the strict spectral constraint of EBI>0.7 alongside a brightness albedo cutoff (R+G+B>500) to eliminate shaded background components. Second, a spatial connectivity constraint was applied: only contiguous pixel clusters forming a continuous spatial area 2.0 m2 were recognized as true flowering tree objects, effectively filtering out minor canopy glints or isolated understory weeds. Third, to construct the model prompts, standardized vector polygons were automatically generated by applying a uniform spatial dilation buffer of 0.5 m around the outer perimeter of each qualified EBI cluster. This programmatic buffer guaranteed that the prompt shapes consistently captured both the target blooming crown and a minimal amount of surrounding non-blooming background forest. This standardization allowed the SAMGeo zero-shot inference engine to independently and algorithmically execute edge-segmentation, preventing any manual tracing bias or variation between individual operators. Using the input polygon layers as prompts, the SAMGeo model segmented the boundaries between the background and tree canopies via deep learning. For spatial analysis, we converted the extracted raster-format canopy zones into vector polygon layers, which automatically computed the estimated projected canopy area of R. pseudoacacia for each survey plot.
RESULTS AND DISCUSSION
1. Selection of UAV flight sites
Generally, the primary foraging radius of honeybees tightly concentrates within a 1 km range; although foraging can extend up to 2.5 km, such instances remain extremely rare (Ochumgo et al., 2021). Corroborating this, Gary et al. (1975) reported that more than 50% of honeybees forage within 305 m of their hive, with the vast majority of nectar-gathering activities concentrated under 1 km. Reflecting these ecological characteristics, we established the spatial coverage for our UAV flight missions. We captured aerial imagery across three distinct sampling locations, subsequently processing the individual images using Pix4Dmapper software to execute alignment, generate point clouds, and produce the final orthomosaics (Fig. 1).
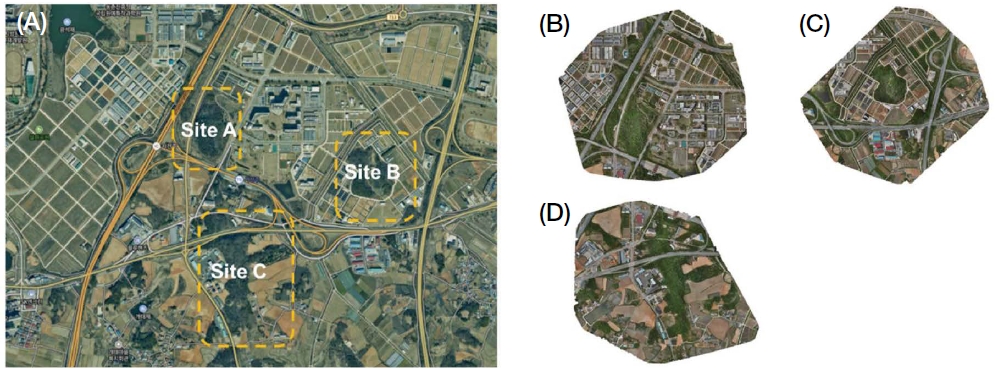
(A) Aerial view illustrating the landscape context and locations of the three sampling sites (Sites A, B, and C) situated in forest-rich areas surrounding the apiary. (B-D) Representative drone images of each site: (B) site A, (C) Site B, and (D) site C, showing surrounding vegetation conditions.
2. Threshold optimization and forest area extraction via ExG
To isolate the green vegetation areas corresponding to forest cover, we extracted pixels satisfying the condition of ExG>0.1 by establishing a strict threshold of 0.1. While conventional methods frequently employ a baseline threshold of 0 to separate general vegetation in RGB imagery (Meyer and Neto, 2008; Rosen et al., 2024), we applied a more stringent criterion to selectively isolate the green canopy of R. pseudoacacia. Theoretically, perfectly white objects yield uniform RGB channels, causing their ExG values to converge toward 0. However, the target species, R. pseudoacacia, exhibits a distinct biological trait where leaf development and flowering occur simultaneously. Consequently, even within high-resolution UAV imagery, pixels covering blooming flowers do not appear as pure white; instead, they display a mixed spectral signature heavily influenced by light reflectance from the surrounding dense green foliage. Rather than extracting the white flowers prematurely, maintaining a green reflectance threshold of ExG>0.1 served as a crucial primary criterion to effectively eliminate non-vegetated areas and isolate the entire forest canopy layer where flowers and leaves coexist. Applying this optimized threshold effectively filtered out soil layers with yellowish or light-green hues and peripheral road-boundary vegetation, thereby enabling the selective extraction of high-density forest zones. Based on this ExG threshold, we effectively delineated the forest vegetation areas for each site (Fig. 2). The analyzed forest area reached 91,462 m2 for Site A, 37,602 m2 for Site B, and 134,251 m2 for Site C (Table 1).
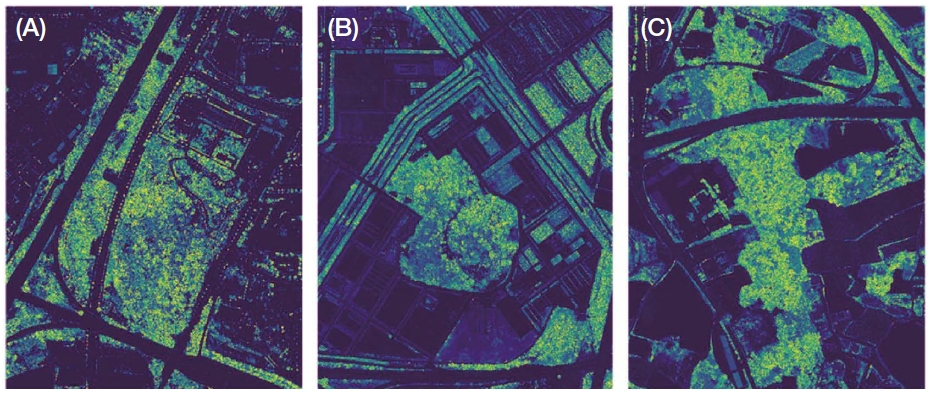
Extraction images applying the Excess Green Index (ExG). (A) ExG-derived image for Site A, (B) ExG-derived image for Site B, and (C) ExG-derived image for Site C.

Quantitative summary of extracted forest areas, net flowering areas, and flowered-to-forest ratios across the three study sites
3. EBI application and deep learning-based flowering area segmentation
To quantify the apparent flowering segments of R. pseudoacacia within the ExG-masked forest zones, we computed the EBI based on RGB digital numbers (DN) and subsequently performed a pixel-level threshold analysis. To optimize the quantification of flowering intensity, we compared and analyzed multi-temporal datasets captured before and after the onset of bloom, which led us to establish a value of EBI>0.7 as the valid flowering zone. Despite the high EBI threshold, we implemented an additional data-filtering step-excluding pixels with an RGB DN sum of less than 500-to mitigate the confounding effects of gray tones and shadows, thereby isolating the estimated blooming canopy. We derived this optimal threshold (EBI>0.7) through a rigorous process combining histogram analysis of randomly sampled plots and visual cross-verification. Setting the threshold below 0.7 introduced false positives, where leaves with high solar reflectance were misidentified as flowers; thus, the 0.7 baseline served as the optimal cutoff to prevent such misclassifications.
At Site A, applying the EBI partitioned the black locust flowering zones into five distinct classes; zones with concentrated, intense blooming (EBI>0.7) were visually distinct, represented in blue hues (Fig. 3A). After removing dark regions with an RGB sum under 500, we extracted the corresponding pixels to establish polygon layers for bounded area estimations (Fig. 3B). Finally, the deep learning framework effectively segmented the true effective flowering area of R. pseudoacacia (Fig. 3C).
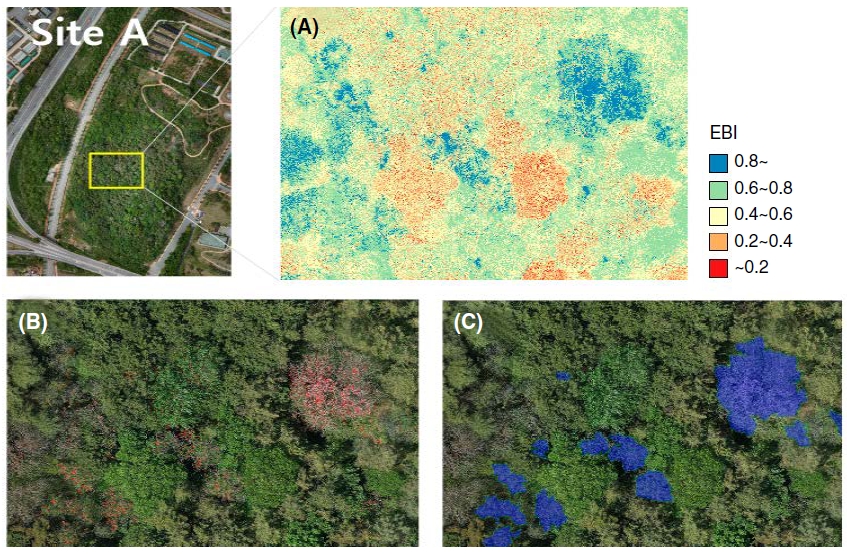
Extraction of R. pseudoacacia flowering area using the Enhanced Bloom Index (EBI) at Site A. (A) EBI-derived spectral image, (B) Binary image after applying the threshold, and (C) Valid area extraction based on deep learning segmentation.
We replicated this pipeline for Site B; the blooming zones appeared clearly in blue hues (Fig. 4A), from which we systematically extracted the pixels using our threshold criteria to establish the spatial bounds (Fig. 4B) and compute the deep learning-based flowering area (Fig. 4C). Similarly, for Site C, applying the EBI pipeline isolated the flowering canopy, filtered out non-target areas via thresholding, and automatically calculated the estimated flowering footprint using the deep learning model (Fig. 5).
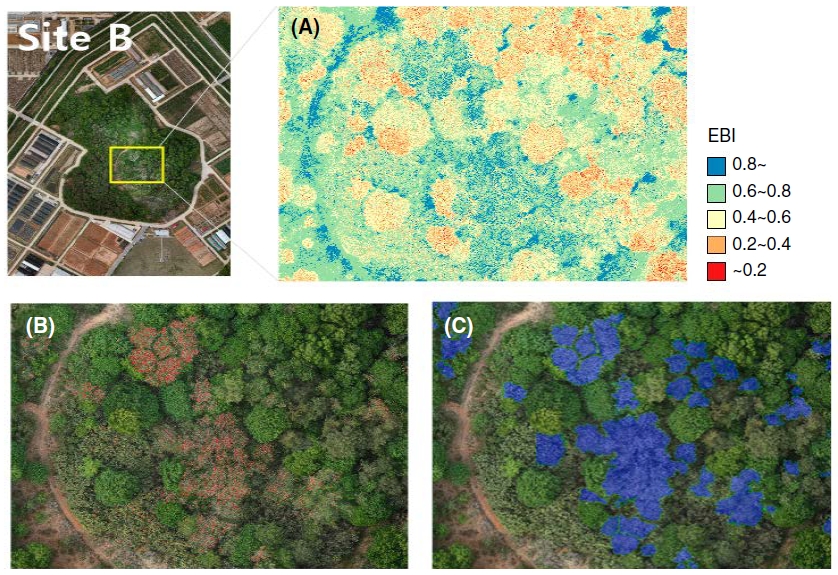
Extraction of R. pseudoacacia flowering area using the Enhanced Bloom Index (EBI) at Site B. (A) EBI-derived spectral image, (B) Binary image after applying the threshold, and (C) Valid area extraction based on deep learning segmentation.
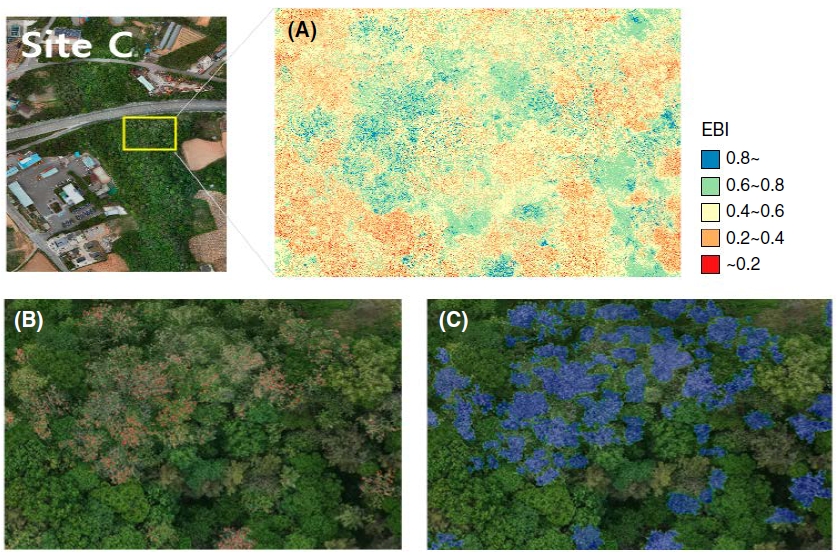
Extraction of R. pseudoacacia flowering area using the Enhanced Bloom Index (EBI) at Site C. (A) EBI-derived spectral image, (B) Binary image after applying the threshold, and (C) Valid area extraction based on deep learning segmentation.
Considering the nectar source distribution and honeybee foraging dynamics, this comprehensive extraction framework effectively mapped the total effective flowering area of R. pseudoacacia across all three study plots (Fig. 6).
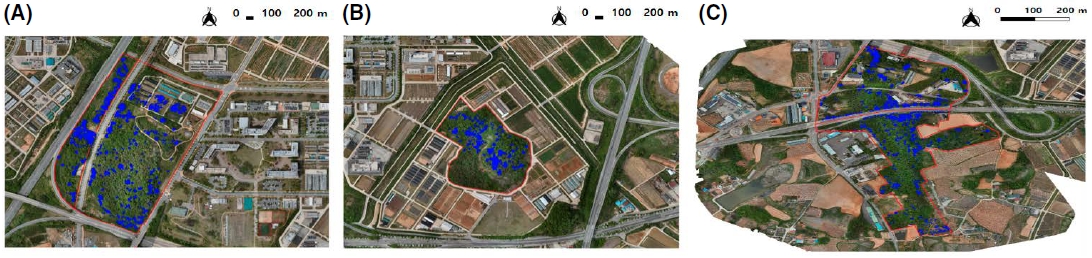
Total effective flowering Robinia pseudoacacia at the three study sites. (A) Representative image of Site A, (B) Representative image of Site B, and (C) Representative image of Site C.
4. UAV-EBI based flowering area calculation
Utilizing the deep learning-driven outputs across the three apiary-adjacent plots, we computed the estimated flowering areas within a QGIS software environment using the Raster Calculator tool. Our analysis revealed that the black locust flowering area at Site A spanned 10,924 m2, accounting for 11.9% of the total green forest canopy isolated by the ExG index. At Site B, the flowering area reached 3,379 m2, representing 9.0% of its corresponding forest zone. For Site C, the flowering footprint was 9,677 m2, which constituted a mere 7.2% of the local forest area. Collectively, across the three sites encompassing the honeybee foraging radius, the total forest area spanned 263,315 m2, whereas the apparent blooming area of R. pseudoacacia amounted to only 23,980 m2, yielding an overall average flowered-to-forest ratio of just 9.1% (Table 1).
These findings underscore that the apparent area of blooming R. pseudoacacia within a honeybee̓s active foraging radius can be substantially smaller than the total geographical area of the foraging zone itself. Although the surrounding environment of the NIAS in Wanju-gun represents a peri-urban landscape rather than a deep, dense mountainous forest, estimated forest cover comprised only a fraction of the region, and the apparent blooming portion within that forest was limited to 9.1%.
Therefore, to accurately estimate potential honey yields, researchers and practitioners must transition away from simply calculating the gross area of the foraging radius; instead, they must extract and apply the net effective flowering area. By utilizing high-resolution UAV imagery to quantify the net available nectar resources within a foraging bounds, this study provides a more quantitative, systematic foundation for predicting single-source honey production and optimizing colony stocking densities in future apicultural management.
However, despite these methodological advancements, this study has several limitations that should be acknowledged in the interpretation of results. Primarily, relying exclusively on aerial visible-band imagery presents an inherent challenge in distinguishing R. pseudoacacia from co-occurring tree species that also produce while flowers (Atanasova et al., 2024). Furthermore, the absence of ground-truth validation means that the aerially observed bloom remains an estimation. It has not yet been verified how the UAV-classified areas correlate with the number of inflorescences at the ground levels. Therefore, a necessary direction for future research is to conduct filed validation studies to verify these aerial estimations. Additionally, predicting realistic nectar potential from these spatial estimates will require considering the broader ecological context (Kim and Jung, 2025). Ecological studies demonstrate that nectar secretion is not highly static. Plants can adaptively adjust their nectar production in response to environmental cues and the floral density of neighboring vegetation. For instance, plants often increase nectar rewards to compete for pollinators when the surrounding bloom is abundant (Parachnowitsch et al., 2019; Veits et al., 2019). Future validation models must therefore integrate rigorous ground-truth data with the ecological dynamics of surrounding plant communities to refine the spatial estimation framework established in this study.
CONCLUSIONS
In this study, we developed a technical pipeline that integrates UAV-based visible-band vegetation indices with a geospatial deep learning segmentation model (SAMGeo) to quantitatively estimate the individual canopy-level flowering area of R. pseudoacacia. Our experimental results demonstrated that the apparent blooming footprint accounted for a mere 9.1% (23,980 m2) of the total forest canopy (263,315 m2) across the investigated honeybee foraging zones, exhibiting substantial spatial variations between 7.2% and 11.9%.
The primary scholarly and practical contribution of this research is the transition from conventional remote sensing centered on gross forest distribution to the systematic estimation of net effective nectar resources. Our findings provide valuable scientific evidence that evaluating honeybee carrying capacities or potential honey yields based on gross geographical area leads to considerable overestimations. Ultimately, the framework established in this study offers a practical, reproducible tool for the apiculture industry. We anticipate that these baseline data will serve as a foundational cornerstone for optimizing apiary site selection, determining optimal colony stocking densities, and formulating data-driven national strategies for nectar resource conservation and management.
Acknowledgments
This study was supported by a research project (RS-2023-00230940) and 2026 the RDA Fellowship Program of National Institute of Agricultural Science, Rural Development Administration, Republic of Korea.
References
-
Atanasov, A., B. Evstatiev, A. Atanasov and I. Hristakov. 2024. Detection and Assessment of White Flowering Nectar Source Trees and Location of Bee Colonies in Rural and Suburban Environments Using Deep Learning. Diversity.
[https://doi.org/10.3390/d16090578]

-
Atanasov, A., B. Evstatiev, V. Vlӑduț and S. Biriş. 2024. A Novel Algorithm to Detect White Flowering Honey Trees in Mixed Forest Ecosystems Using UAV-Based RGB Imaging. AgriEngineering.
[https://doi.org/10.3390/agriengineering6010007]
-
Carl, C., D. Landgraf, M. Van der Maaten-Theunissen, P. Biber and H. Pretzsch. 2017. Robinia pseudoacacia L. Flowers Analyzed by Using an Unmanned Aerial Vehicle (UAV). Remote Sens. 9(11): 1091.
[https://doi.org/10.3390/rs9111091]
-
Chen, B., Y. Jin and P. Brown. 2019. An Enhanced Bloom Index for Quantifying Floral Phenology Using Multi-Scale Remote Sensing Observations. ISPRS J. Photogramm. Remote Sens. 156: 108-120.
[https://doi.org/10.1016/j.isprsjprs.2019.08.006]
-
Cheng, J., X. Zhang, J. Zhang, Y. Zhang, Y. Hu, J. Zhao and Y. Li. 2024. Estimating the Aboveground Biomass of Robinia pseudoacacia Based on UAV LiDAR Data. Forests 15(3): 548.
[https://doi.org/10.3390/f15030548]
-
D’Odorico, P., A. Besik, C. Wong, N. Isabel and I. Ensminger. 2020. High-Throughput Drone Based Remote Sensing Reliably Tracks Phenology in Thousands of Conifer Seedlings. New Phytol. 226(6): 1667-1681.
[https://doi.org/10.1111/nph.16488]
-
Ding, R., J. Luo, C. Wang, L. Yu, J. Yang, M. Wang, S. Zhong and R. Gu. 2023. Identifying and Mapping Individual Medicinal Plant Lamiophlomis rotata at High Elevations by Using Unmanned Aerial Vehicles and Deep Learning. Plant Methods 19: 38.
[https://doi.org/10.1186/s13007-023-01015-z]
-
Gary, N. E., P. C. Witherell and J. M. Marston. 1975. The Distribution of Foraging Honey Bees from Colonies Used for Honeydew Melon Pollination. Environ. Entomol. 4(2): 277-281.
[https://doi.org/10.1093/ee/4.2.277]
-
Istiak, M., M. Syeed, M. Hossain, M. Uddin, M. Hasan, R. Khan and N. Azad. 2023. Adoption of Unmanned Aerial Vehicle (UAV) Imagery in Agricultural Management: A Systematic Literature Review. Ecol. Inform.78: 102305.
[https://doi.org/10.1016/j.ecoinf.2023.102305]
-
Kim, M. J. and C. Jung. 2025. Beyond the timing of flowering: Shortening of spring flowering duration of Korean trees and potential community effects. Ecology 106(9): e70194.
[https://doi.org/10.1002/ecy.70194]
-
Lu, J., H. Wang, S. Qin, L. Cao, R. Pu, G. Li and J. Sun. 2020. Estimation of Aboveground Biomass of Robinia pseudoacacia Forest in the Yellow River Delta Based on UAV and Backpack LiDAR Point Clouds. Int. Appl. Earth Obs. Geoinf. 86.
[https://doi.org/10.1016/j.jag.2019.102014]
-
Maes, W. H. and K. Steppe. 2019. Perspectives for Remote Sensing with Unmanned Aerial Vehicles in Precision Agriculture. Trends Plant Sci. 24(2): 152-164.
[https://doi.org/10.1016/j.tplants.2018.11.007]
-
Meyer, G. E. and J. C. Neto. 2008. Verification of Color Vegetation Indices for Automated Crop Imaging Applications. Comput. Electron. Agric. 63(2): 282-293.
[https://doi.org/10.1016/j.compag.2008.03.009]
-
Müllerová, J., T. Bartalos, J. Bruňa, P. Dvořák and M. Vítková. 2017. Unmanned Aircraft in Nature Conservation: An Example from Plant Invasions. Int. J. Remote Sens. 38: 2177-2198.
[https://doi.org/10.1080/01431161.2016.1275059]
-
Ochungo, P., R. Veldtman, E. M. Abdel-Rahman, J. Ng̓ang̓a, H. E. Z. Tonnang and T. Landmann. 2022. Fragmented Landscapes Affect Honey Bee Colony Strength at Diverse Spatial Scales in Agroecological Landscapes in Kenya. Ecol. Appl. 32(1): e02483.
[https://doi.org/10.1002/eap.2483]
-
Olson, D. O. and J. V. Anderson. 2021. Review on Unmanned Aerial Vehicles, Remote Sensors, Imagery Processing, and Their Applications in Agriculture. Agron. J. 113(3): 1450-1474.
[https://doi.org/10.1002/agj2.20595]
-
Parachnowitsch, A. L., J. S. Manson and N. Sletvold. 2019. Evolutionary ecology of nectar. Ann. Bot. 123(2): 247-261.
[https://doi.org/10.1093/aob/mcy132]
-
Raniga, D., N. Amarasingam, J. Sandino, A. Doshi, J. Barthélemy, K. Randall, S. Robinson, F. Gonzalez and B. Bollard. 2024. Monitoring of Antarctica’s Fragile Vegetation Using Drone-Based Remote Sensing, Multispectral Imagery and AI. Sensors, 24: 1063.
[https://doi.org/10.3390/s24041063]
-
Rosen, L., P. M. Ewing and B. C. Runck. 2024. RGB-Based Indices for Estimating Cover Crop Biomass, Nitrogen Content, and Carbon: Nitrogen Ratio. Agron. J. 116(6): 3070-3080.
[https://doi.org/10.1002/agj2.21657]
-
Schnalke, M., J. Funk and A. Wagner. 2025. Bridging Technology and Ecology: Enhancing Applicability of Deep Learning and UAV-Based Flower Recognition. Front. Plant Sci. 16: 1498913.
[https://doi.org/10.3389/fpls.2025.1498913]
-
Sulki, J. J. and D. S. Long. 2016. Spectral considerations for modeling yield of canola. Remote Sens. Environ. 184: 161-174.
[https://doi.org/10.1016/j.rse.2016.06.016]
-
Veits, M., I. Khait, O. Ovadia, O. Zik, A. Boonman, Y. Yovel and L. Hadany. 2019. Flowers respond to pollinator sound within minutes by increasing nectar sugar concentration. Ecol. Lett. 22(9): 1483-1492.
[https://doi.org/10.1111/ele.13331]
-
Woebbecke, D. M., G. E. Meyer, K. Von Bargen and D. A. Mortensen. 1995. Color Indices for Weed Identification under Various Soil, Residue, and Lighting Conditions. Trans. ASAE 38(1): 259-269.
[https://doi.org/10.13031/2013.27838]
-
Wu, Q. and L. P. Osco. 2023. samgeo: A python package for segmenting geospatial data with the Segment Anything Model (SAM). J. Open Source Softw. 8(89): 5663.
[https://doi.org/10.21105/joss.05663]
-
Zha, H., Y. Miao, T. Wang, Y. Li, J. Zhang, W. Sun, Z. Feng and K. Kusnierek. 2020. Improving Unmanned Aerial Vehicle Remote Sensing-Based Rice Nitrogen Nutrition Index Prediction with Machine Learning. Remote Sens. 12: 215.
[https://doi.org/10.3390/rs12020215]
-
Zhang, J., Y. Hu, F. Li, K. Fue and K. Yu. 2024. Meta-Analysis Assessing Potential of Drone Remote Sensing in Estimating Plant Traits Related to Nitrogen Use Efficiency. Remote Sens. 16: 838.
[https://doi.org/10.3390/rs16050838]
-
Zhu, H., C. Lin, G. Liu, D. Wang, S. Qin, A. Li, J. Xu and Y. He. 2024. Intelligent Agriculture: Deep Learning in UAV-Based Remote Sensing Imagery for Crop Diseases and Pests Detection. Front. Plant Sci. 15: 1435016.
[https://doi.org/10.3389/fpls.2024.1435016]