Automatic Environmental Monitoring of Honeybee Hive
Environmental regulation of the inside nest is an important trait of social insects such as honeybee. Temperature and humidity inside the nest often indicate the colony health. A design for an environmental monitoring system was prepared to log temperature inside the hive space for three dimensional analyses. For logging multiple data for a period of time, sensor networking, electronic power provision and data storage were the main problem. For these, we developed a novel design and tested in the honeybee hive. The results showed that temperature was more stable inside the brood area and variable in the peripheral area of brood, and upper or lower side of the bee hive. This system could run for 3 weeks with reliability but not afterward. Further improvement of this system includes the increase of the sensor network with diverse environmental variables such as including humidity or sound, and the prolongation of the monitoring system even with the aid of the external power sources. Then this system would help in determining the colony health and even the attack from the larger animals such as hornets.
Keywords:
Environment, Temperature, Monitoring, Alarm, Colony healthINTRODUCTION
Honeybee is one of the highly evolved social animals and recently the concept of superorganism is applied to honeybee colony where honeybees are restricted to the certain physical structure of nest with caste hierarchies and the division of labour (Holldobler and Wilson, 2009). In a superorganism (honeybee colony), the somatic (workers) and reproductive (gynes and males) cells are compartmentalized into functional organs (castes), the whole inhabiting a unique skeleton and skin structure (the nest) (Tautz, 2008). As the structural basis of the colony, the nest must be protected to ensure colony survival. Predation, in particular, is regarded as a major cause of colony mortality. Consequently, nest defense behavior is one of the most important roles assigned to worker bees resulting in the unique development of stinging behavior with venom, or group defense behaviors of ball-forming or massive sound production (Winston, 1987). On the other hand, regulation or maintenance of the environmental condition inside the nest becomes more important for keeping the social structure and brood production (Stabentheiner et al., 2010). Specially being a poikilothermal animal, temperature regulation is important for many aspects including brood rearing, group survival in the extreme conditions even for the foraging to activate the wing muscle. Thus worker bees can sense the temperature change and activate the negative feedback regulation through the coordinated group behavior. Several studies reported the fine-tuned regulation of the nest temperature especially on the brood area (Simpson, 1961; Seeley and Heinrich, 1981, Jung 2009, Yi and Jung, 2010). It is known that honeybee, Apis mellifera colony begin to make the winter cluster when the air temperature drops below 18°C, and the cluster becomes tighter as the temperature drops. But the core part of the cluster should be higher than 13°C for the colony survival. During the season, nest temperature can fluctuate depending on weather and other factors, but the brood area is homeostatic 33.3~36.0°C with minimum variation (0.6°C) in a day (Simpson 1961, Winston, 1987). Recently Yi and Jung (2010) compared the temperature fluctuation inside the brood area of A. mellifera and outside air temperature. Temperature of honeybee brood area was constantly maintained with mean of 35.2±0.42°C while the air temperature fluctuated with 32°C variation. Most of the previous studies on temperature monitoring was done with one or smaller number of data capturing point, spatial distribution of the environmental variables inside the three dimensional hive. Developing multiple sensor networks into the data logger is the main key for the automated spatially distributed data monitoring system. Here we report the prototype design and the variation of the temperature inside the hive relative to the position inside.
MATERIALS AND METHODS
Monitoring system component
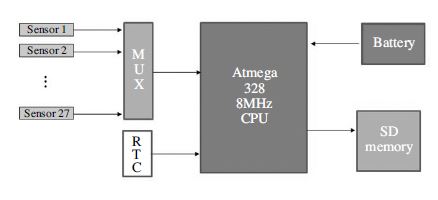
The design of the monitoring system includes various components from the sensing, data logging and processing (Fig. 1). For this, as an initial step, we employed a multiplexer (DEV-09832 Mux) that is a device that selects one of several analog or digital input signals and forwards the selected input into a single line for 27 sensors. .For temperature sensing, TMP36 sensor was used. The TMP36 is a low voltage, precision centigrade temperature sensor. It provides a voltage output that is linearly proportional to the Celsius temperature. It also doesn’t require any external calibration to provide typical accuracies of ±1°C at +25°C and ±2°C ver the -40°C to +125°C temperature range. For tracking real time, the DS1307 real-time clock (RTC) was employed. This is a low-power, full binary-coded decimal (BCD) clock/calendar plus 56 bytes of nonvolatile SRAM. Address and data are transferred serially to the micro controller through an I2C, bidirectional bus. The clock/calendar provides seconds, minutes, hours, day, date, month, and year information. For the data logging, SD (Secure Digital) memory card (INT106D1P) was used. Mainboard for microprocessor was Arduino328.
Programing
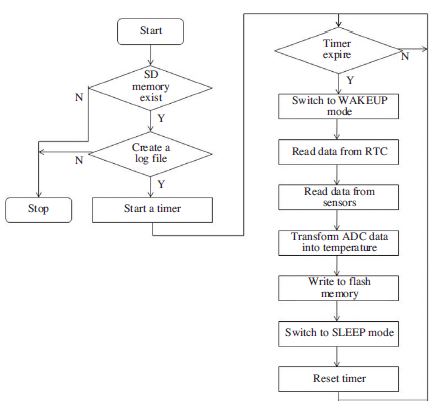
Fig. 2 shows the algorithm for our monitoring system. It begins with the presence of the SD cards. If it detects a SD card presence then a log file is created otherwise the program stops, and starts a timer with 5 minutes. If the timer does not expire, we read the current time and the ADC (Analog-to-Digital Converter) values from the 27 temperature sensors. In this case, analogous voltage data are converted into the temperature digits (°C), then recorded into the memory card. After this process, program switches to sleep mode to save the power until the battery remains.
Field verification and validation
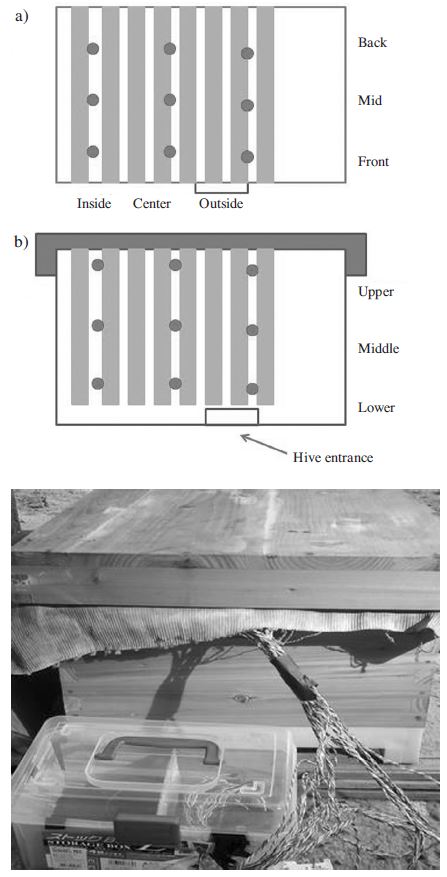
For the verification of the process and validation of the data, field implementation of the monitoring system was set-up in the experimental apiary of Andong National University. Three queen-right colonies of Apis mellifera were selected. Each colony in a single story hive consisted of 7 frames full loaded with normal brood rearing. In the beginning, system verification was conducted, and found there was no problem in the sensing and data retrieving. However, the temperature profiles (27.5±2.7°C) were different to the temperature ranges measured by Hobo pro V2 (Onset Computer Cooperation, Pocasset, MA, USA) system (33.9±0.69°C). The verification process by the programing improved the data converting and resulted in the normal range of temperature (33.6±0.6°C). For the validation and monitoring the spatial distribution of the temperature inside the hive, twenty seven monitoring sensors were deployed into the hive to cover the three dimensional space inside the box (Fig. 3). Details were displayed in Fig. 3. Each point of monitoring spots were named as inside, center and outside or front, mid and back from the hive entrance in horizontal view (Fig. 3a), and lower, middle and upper on the vertical view (Fig. 3b). Honeybee colonies were facing south. Monitoring data acquisition was made every 5 minutes for two weeks in July and August without replacement of the battery.
RESULTS AND DISCUSSION
Temperature distribution
The monitoring system provided valid temperature data inside the hive without further provision of external power. Temperature in the central part was more stable than at the inside or outside within the hive (Fig. 4). Total 3880×27 data points were acquired without error. There were significant variations of the temperature profiles. From the inside measure points, temperature fluctuated with the range of 25.7~40.8, and 24.2~40.2 from the outside part of the hive (Fig. 4a, 4c). However, temperature profiles in the central frames were rather stable especially in the middle and lower part compared to the upper part (Fig. 4b). However, overall temperature was maintained as 32.9± 1.03°C Thermoregulation of honeybee has been well demonstrated through diverse mechanisms (Batian and Esch, 1970; Southwick and Mugaas. 1971), and the range seemed the species-specific (Burgett and Titayavan, 1993, Burgett et al., 1997, 1998). The data seemed a bit different to Yi and Jung (2010) where they showed that the brood temperature was rather stable regardless of the outside temperature fluctuation. In their study, they kept the sensor in the middle of the brood comb while the current study sensors were either systematically allocated. However, there still exist some chance of the sensor precision and resolution.
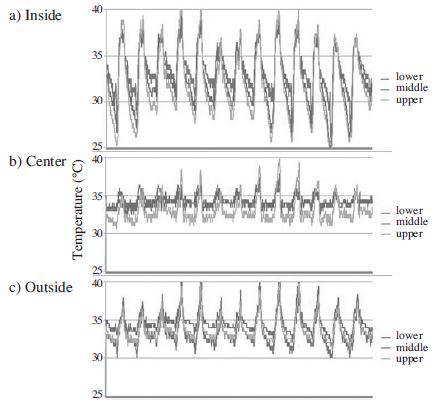
Temperature profiles from inside (a), center (b) and outside (c) of the honeybee colony from three vertical layers from July 22 to Aug. 4.
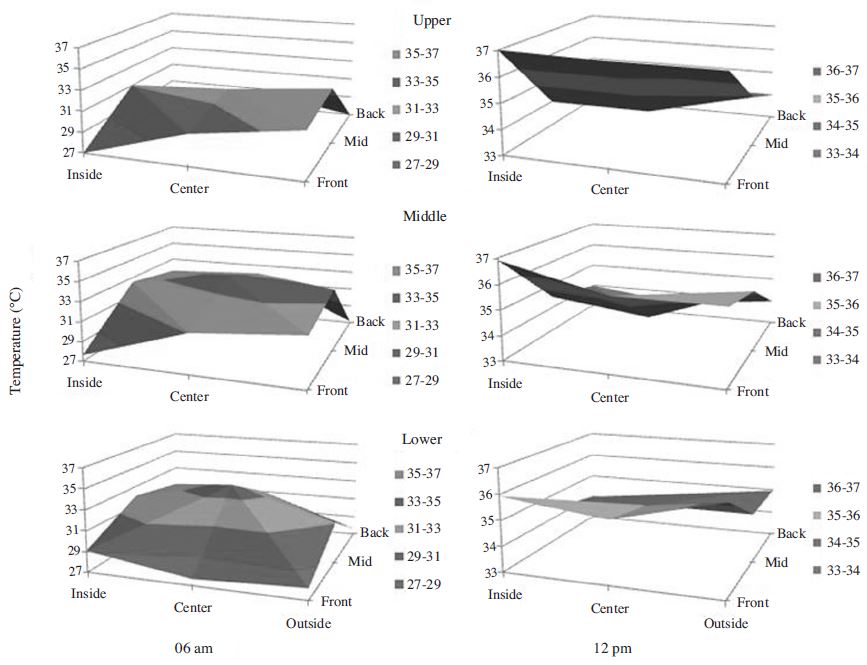
Spatial temperature profiles are displayed in Fig. 5 which was measured in the morning (Fig. 5a) and at noon (Fig. 5b) when the sun shined directly on the front part of the bee hive. In the early morning, front part was cooler than the other sides and temperature gradients were more on the lower part of the bee hive. However at noon, temperature gradient steeped in the upper part where most of the heat produced and gained crowded in the upper part between the top cover. Since the temperature regulation is the integration of the individual honeybee’s decision (Jones et al., 2004), distribution of different individuals could be reflected into the variation of the temperature variation.
Implementation
Rapid improvement of environmental monitoring and information technology now allow the precision agriculture through the sensor networks. In the field of beekeeping temperature measurement system can be adapted for the individual bee hive monitoring and maintenance, substituting the traditional monitoring methods. Bee hive temperature measurements can provide beekeeper with continuous, real time data about the state of the bee colony. Through the continuous monitoring of the hive temperature, onset of the brood rearing can be detected (Seeley, 1985; Lee et al., 2008; Zacepines, 2012), and may regulate the process in case of need to slow down, because too early start can lead to the death of the whole colony. From the measurement results during the passive wintering period, while bees are kept in the specific wintering building, Zacepines (2012) showed it is possible to precisely find out the date, when the bee colony died and find out the dates of the potential start of the brood rearing process. Also, Ferrari et al. (2008) reported that by monitoring of the hive environmental variables, swarming can be early-warned, so to escape from the loss of bees from swarming. The initiation of a swarming period is characterized as the raise in temperature from 33°C to 35°C until the actual time of swarming when the temperature drops to 32°C. With more activity, ventilation from bee wings causes drop of temperature. The disturbance-induced heat production or sound production can be detected. For example, if the vespid hornets begin to attack, disturbance of the bees inside the hive can be observed and possible results in the increase of the hive temperature (CJ, personal observation). Ferrari et al. (2012) showed that acoustic method can detect. In that; the microphones were placed inside the hives. The sounds were recorded with a sample rate of 2 kHz, and analyzed. During the monitoring, swarming activities occurred and was indicated by an increase in the power spectral density at about 110 Hz; approaching to swarm the sound augmented in amplitude and frequency to 300 Hz, occasionally a rapid change occurred from 150 Hz to 500 Hz (Ferrari et al., 2008).
The prototype of the environmental monitoring system of the hive needs further improvement especially in the precision and power supply. Also the sensor should have enough resolution to catch up the subtle change of the inside hive environment such as the heat from the swarm or nose itself. Also, surprisingly higher variation was noted even in the middle part of the colony which make the further development more complicated. However, sensor network of the hive environmental monitoring eventually could help mitigate the labor cost to inspect the each colony health from the remote area, if the wireless long distance communication be possible, and contribute to the bee health management.
Acknowledgments
This research was funded by RDA agenda research project PJ010487.
References
- Batian, J, Esch, H, (1970), The nervous control of the indirect flight muscles of the honey bee, Zeitschrift fir Vergleichende Physiologie, 67, p307-324.
- Burgett, M, Titayavan, M, (1993), Brood thermoregulation by the giant honey bee (Apis dorsata F.), Nat. Hist. Bull. Siam Soc, 41, p91-98.
- Burgett, M, Titayavan, M, Kitprasert, C, (1997), Brood thermoregulation by the dwart honey bee (Apis florea F.), Nat. Hist. Bull. Siam Soc, 45, p143-148.
- Burgett, M, Titayavan, M, Sukumalanand, P, (1998), Brood thermoregulation by the Eastern honey bee (Apis cerana F.), Nat. Hist. Bull. Siam Soc, 46, p141-147.
-
Ferrari, S, Silva, M, Guarino, M, Berckmans, D, (2008), Monitoring of swarming sounds in bee hives for early detection of the swarming period, Computers and Electronics in Agriculture, 64, p72-77.
[https://doi.org/10.1016/j.compag.2008.05.010]

- Holldobler, B, Wilson, EO, (2009), The Superorganism: The Beauty, Elegance, and Strangeness of Insect Societies, WWNorton, p522.
- Jones, JC, Myerscough, MR, Graham, S, Oldroyd, BP, (2004), Honeybee nest thermoregulation: Diversity promotes stability, Science, 305, p402-404.
- Lee, MY, Lee, ML, Kim, YS, Kang, SW, Lee, KG, (2008), Temperature in honeybee colonies during summer and standardization of rearing houses in apiary, Korean J. Apic, 23, p7-12.
- Seeley, TD, (1985), Honeybee ecology, A study of adaptation in social life, p201, Princeton University Press. NJ.
- Seeley, TD, Heinrich, B, (1981), Regulation of temperature in the nests of social insects, p159-234, in Insect thermoregulation, ed. by B. Heinrich, Wiley Press, New York.
- Simpson, J, (1961), Nest climate regulation in honeybee colonies, Science, 133, p1327-1333.
- Southwick, E E, Mugaas, J N, (1971), A hypothetical homeotherm: the honeybee hive, Comp. Biochem. Physiol, 40A, p935-944.
-
Stabentheiner, A, Kovac, H, Brodschneider, R, (2010), Honeybee colony thermoregulation - Regulatory mechanisms and contribution of individuals in dependence on age, location and thermal Stress, PLoS ONE, 5(1), pe8967.
[https://doi.org/10.1371/journal.pone.0008967]

- Tautz, J, (2008), The buzz about bees, Biology of a superorganism, Springer p284.
- Winston, M L, (1987), The biology of the honey bee, p281, Harvard University Press.
