
벌꿀에서 잔류 DNA의 분리를 위한 과정의 최적화
Abstract
Stable carbon isotope ratio analysis (SCIRA) is an important technique accepted by the Association of Official Analytical Chemistry (AOAC, 1990) as the official method for the detection of honey adulterated with sugars. However, this analytical technique is not sensitive enough to detect very low concentrations of adulterating sugars. It has shown results that PCR, detecting trace amounts of specific target genes, was useful a tool to distinguish adulterated honey. The presence of sugarcane or sugarbeet specific gene in honey means that sugarcane or sugarbeet sugar was used in the honey production process. Residual DNA are distinguished from pollen DNA mixed in the honey production process. In sugar manufacturing process, the residual DNA of sugarcane or beet plants remains in the final product, which is used in honey production. This residual DNA is targeted for detection. Therefore, purification of residual DNA in honey is crucial to trace amounts of specific genes to detect using PCR. This study summarized the optimal conditions for using DNA affinity columns to isolate residual genes quickly and easily from honey and expects to be widely used as standard method.
Keywords:
Honey, Residual DNA, Purification method서 론
설탕에 의한 사양꿀은 천연꿀의 가치를 크게 훼손시키고 있어, 사양꿀과 천연벌꿀을 구분하기 위하여 탄소동위원소비 (Isotope ratio mass spectrometry)의 검사법이 널리 사용되어 왔다. 이 방법은 생물체 내의 탄소동위원소 13C 대 12C의 상대적 비율이 달라진다는 사실에 기초하여 벌꿀에 포함된 당의 유래를 추정할 수 있어 국제분석화학기구 (AOAC)에서 벌꿀 내 C4설탕을 구별해내는 방법으로 사용하고 있으며 국내에서도 이 방법으로 사양꿀의 판별을 하고 있다 (Elflein and Raezke, 2008; Kim et al., 2018a; Kim et al., 2018b; Sung et al., 2018). 그러나 이 탄소동위원소비 검사법은 사탕수수 설탕에 의한 사양꿀과 천연벌꿀 간의 판별에서는 유효하였으나, 사탕무 설탕에 의한 사양꿀과 천연벌꿀 간의 판별은 어렵다는 것이 알려졌으며, 이로 인해 천연 벌꿀의 신뢰와 가치가 훼손되고 있다.
최근 PCR (Polymerase Chain Reaction)에 의한 극소량 특이 유전자의 증폭법은 큰 기술적 진보를 보여주었으며 (꿀벌 바이러스 검출법 등) (Kim et al., 2019; Kim et al., 2020; Troung et al., 2021), 이에 힘입어 사양꿀에 존재하는 극미량의 사탕무 특이 유전자 증폭도 가능해짐에 따라, 벌꿀의 잔류 유전자 (residual DNA)에 대한 유전자 증폭, 사탕무 고유 유전자의 증폭 등이 벌꿀의 품질검사에서 정밀 유전자 검출법이 적용될 수 있는 길을 열어 왔다.
벌꿀의 잔류 유전자 (residual DNA)란 벌꿀 생산과정에서 꿀에 혼입된 화분의 화분 유전자 (Pollen DNA)와 구별되는 것으로, 노출된 DNA의 조각들 (Naked DNA fragments)을 말하며, 이는 환경 DNA (Enviromental DNA, eDNA) (Ruppert et al., 2019)와 같은 여러 경로로 벌꿀로 들어와 벌꿀의 보존성에 의하여 DNA가 잔류 상태로 유지되는 것으로 생각되고 있다. 사양꿀에 사용되는 설탕은 식물체인 사탕수수 또는 사탕무의 줄기 또는 뿌리를 분쇄하여 정제 건조과정을 거친 것으로, 99.99% 이상이 설탕 (이당류, Sucrose)을 가진 것으로 알려져 있다. 이 정제과정에서 사탕수수 또는 사탕무의 고유 유전자 (DNA)는 거의 분쇄되고 제거되기에, 설탕에 포함된 DNA의 양은 극미량이라 할 것이다.
사양꿀은 사탕수수 또는 사탕무의 설탕물을 꿀벌에게 인위적으로 공급하여 꿀의 모양으로 생산한 것으로, 이 과정에서 사탕수수 또는 사탕무의 고유 유전자는 거의 분쇄되리라 추정되었으나, 극미량은 존재하게 되며, 이는 PCR에 의한 특이 증폭에서 초기 주형 DNA (Initial template DNA)로 작용될 수 있는 충분한 수준의 양이라 할 수 있다. 따라서, 사양꿀 판별을 위한 특이 유전자 증폭 (PCR) 검사에서 먼저 중요한 과정은 벌꿀에서 잔류 유전자를 쉽고 빠르게 획득할 수 있는 DNA 순수분리법이라 할 것이다. 벌꿀에서 DNA의 순수분리는 주로 화분 유전자의 분리에 목적을 두어, 점도를 낮추기 위한 CTAB의 사용, 화분의 분쇄 그리고 단백질 제거를 위한 페놀처리, 적정량의 DNA를 순수분리하기 위하여 다량의 꿀시료가 필요하였으나 (Jain et al., 2013; Sobrina-Gregorio et al., 2015), 본 연구의 목표인 잔류 유전자의 순수분리에는 그리 유용하다 할 수 없었다. 한편, affinity column에 의한 DNA의 순수분리법은, column 내 membrane filter의 glass-fiber가, 고염농도의 조건에서, negative charge를 띠는 DNA의 phosphate backbone과 쉽게 결합되는 성질을 이용한 것으로, 페놀을 사용하지 않는다는 장점과 용해된 DNA를 가장 쉽게 분리할 수 있다는 장점으로 생물학 연구의 DNA 순수분리법 중 가장 널리 사용되어 왔으며, 대장균, 동물세포, 혈액 또는 조직 등을 대상으로 하는 많은 키트가 개발, 상품화되어 활용되고 있다 (Gadgil et al., 2001). 벌꿀은 기본적으로 수용성이며, 약 20% (w/v)의 수분함량을 갖는다. 주성분은 Glucose, Fructose 등의 단당류이며, 꿀의 종류에 따라, 화분 등의 고형물과 왁스 등의 난용성 성분을 다소 포함하고 있다. 벌꿀의 잔류 DNA를 분리하기 위하여 벌꿀을 완전히 용해시킬 필요가 있으며, 동시에 이 잔류 DNA가 컬럼의 DNA-binding fiber에 효율적으로 붙을 수 있는 환경과 binding된 DNA를 회수하는 조건이 요구된다.
본 연구는 벌꿀의 천연꿀과 사양꿀 판별을 위한 사탕수수 특이 정량 PCR 및 사탕무 특이 정량 PCR에 사용하기 위하여, 벌꿀에서 affinity column을 사용하는 잔류 DNA 분리법을 최적화하였으며, 이를 벌꿀에 대한 표준 DNA 분리법으로 제안하고자 하였다.
재료 및 방법
1. pGEM-sugarcane-cp (pSc) plasmid DNA 희석을 통한 특이유전자 검출한계
사양꿀에서 DNA isolation 최적 조건을 알아보고자 pGEM-sugarcane-cp (pSc) plasmid DNA를 일정 분자를 넣어주고 꿀에 넣어주고 QIAquick PCR purification kit를 이용하여 DNA를 isolation하여 회수된 DNA copy 수를 넣어준 양과 비교하여 최적조건을 알아보았다. 이 실험에서 사용하는 pSc는 사탕수수 엽록체에 위치한 maturase K (matK, GenBank accession No. LN 849913) 유전자를 클로닝하여 얻은 재조합 DNA로 이를 특이적으로 검출하기 위하여 Cane-dF/dR로 명명한 프라이머를 제작하였다. 24개의 염기수로 제작된 Cane-dF 5′-CACCGCAATTATTTTTATTCTGAG-3′와 22개의 염기수로 제작된 Cane-dR 5′-GAACATCTTGAATCCGGTATTC-3′를 사용하였다 (Kim et al., 2018). PCR 반응액은 1 μL 10 pmole primer (F/R), 5 μL 2× Rapi : Detect Master mix (Genesystem, Korea), 2 μL 증류수, 1 μL pSc를 혼합하여, 10 μL reaction volume으로 만들었으며, PCR의 조건은 초기변성 95℃ 30 s, 95℃ 3 s, 55℃ 3 s, 72℃ 3 s를 1 cycle로 총 50 cycle을 Genechecker (Genesystem, Korea)를 사용하여 수행하였다. 이후 Ct 값의 변화와 Tm 값, dCt10 값을 이용하여 분석하였다.
2. 용해용액 (Lysis buffer)의 최적화
벌꿀의 잔류 DNA를 분리하기 위하여 벌꿀을 완전히 용해시키고 잔류 DNA가 컬럼의 DNA-binding fiber에 효율적으로 붙을 수 있는 환경을 위해 2개의 서로 다른 Chaotropic agent를 사용하여 그 효율성을 비교하여 벌꿀의 수분함량 측정을 수행하였고 이를 기반으로 lysis buffer를 최적화하기 위하여 1×10⁸ pSC 1 μL를 꿀 시료에 100 μL에 첨가한 후 각각의 buffer를 500 μL 첨가하고, Vortexer를 이용하여 잘 섞어준 후 QIAGEN column에 넣어주고 13000 rpm에서 30 s 원심분리하였다. Washing buffer 700 μL를 column에 넣고 13000 rpm에서 30 s 원심분리하였다. 3′DW 50 μL로 Elution하였고 GI buffer, GSI buffer와 비교하기 위해 QIAGEN kit를 사용한 sample 1개는 kit 내 50 μL Elution buffer를 사용하여 DNA를 얻었다. 이 중 1 μL를 이용하여 PCR하여 결과를 분석하였다.
3. DNA binding column의 선발
적정 affinity column 선정을 위해 5개의 서로 다른 제품의 column을 대상으로 꿀 100 μL에 1×10⁸ pSC 1 μL를 첨가 후 GI buffer를 500 μL 넣고 잘 섞어준 후 5개 다른 column에 넣고 13000 rpm에서 원심분리하였다. 실험은 duplicate로 실시하였으며 washing buffer로 washing한 후 50 μL 3′DW로 Elution하였다. 이렇게 얻은 50 μL에서 1 μL를 사용하여 PCR하였고 그 결과를 분석하였다.
4. Washing buffer의 선발
적정 washing buffer 선정을 위해 조성이 다른 washing buffer A와 B의 차이를 알아보고자 꿀 100 μL에 1×10⁸ pSC 1 μL를 첨가하고 GI buffer를 500 μL 넣고 잘 섞어준 후 P column에 넣고 13000 rpm에서 원심분리하였다. Washing buffer A, B로 washing한 후 50 μL 3′DW를 사용하여 Elution하였다. 이렇게 얻은 50 μL에서 1 μL를 사용하여 PCR하여 그 결과를 분석하였다.
5. DNA Elution buffer 선정
적정 Elution buffer 선정을 위해 3′DW, Elution buffer A와 B를 비교하고자 하였다. 먼저 꿀 100 μL에 1×10⁸ pSC 1 μL를 첨가 후 GI buffer를 500 μL 넣고 잘 섞어준 후 P column에 넣고 13000 rpm에서 원심분리하였다. Washing buffer A로 washing한 후 50 μL 3′DW, Elution buffer A, B를 이용하여 Elution하였다. 이렇게 얻은 50 μL에서 1 μL를 사용하여 PCR하여 그 결과를 분석하였다.
결과 및 고찰
1. pGEM-sugarcane-cp (pSc) plasmid DNA를 이용한 특이유전자 검출한계
1×10¹¹ 분자 pGEM-sugarcane-cp (pSc) plasmid DNA를 ×10단계 희석하여 108, 107, 106, 105, 104, 103, 102, 101, 100 분자수, 그리고 negative (no template, DW)로 총 10개의 시료로 초고속 PCR을 수행하였다. 결과는 다음과 같다 (Fig. 1).
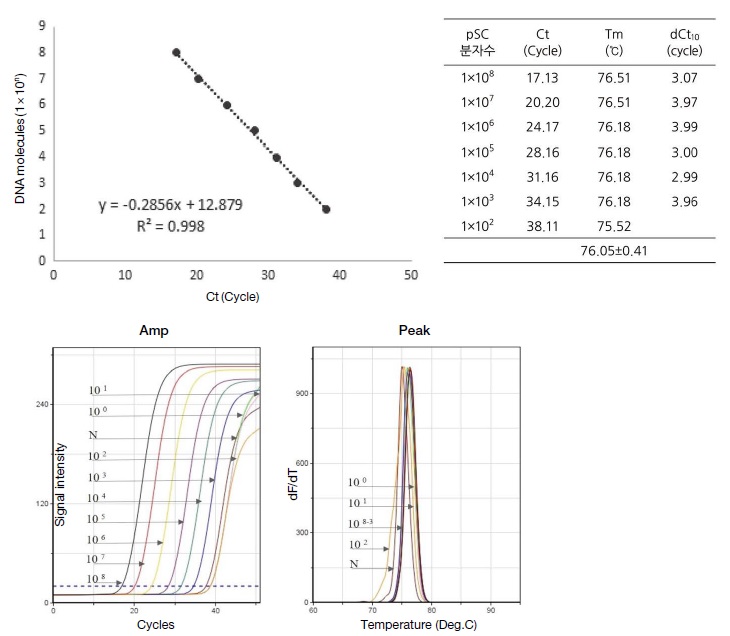
Detection limit of sugarcane-specific detection primers (Cane-dF/dR) in ultra-rapid quantitative PCR. UR-qPCR was performed with the cane dF/dR primers and pGEM-sugarcane-cp (pSc). The template was 10 times serially diluted from 108 to 100 molecules. UR-qPCR was performed using GENECHECER (Genesystem Co., Ltd., Korea) under the following conditions: pre-denaturation at 95°C for 30 s, followed by 50 cycles of denaturation at 95°C for 3 s, annealing at 55°C for 3 s, and polymerization at 72°C for 3 s. Plotting of the Ct value for each DNA molecule yielded a regression formula of y= -0.2856x+12.879. The regression constant R2 was calculated to be 0.998.
pSc의 검출한계는 1×10²으로 나타났으며 융점온도는 평균 76.05±0.41였다. 이 결과를 이용하여 검량선을 작성하여 직선성과 기울기를 조사하였다. 그 결과 y=-0.2856x+12.879로 신뢰성 높은 기울기 값 범위인 -0.25~-0.33 안에 들며 높은 상관계수 값 (R2=0.998)을 얻었다. 이를 정량실험에 이용하였다.
2. Guanidine hydrochloride (GnHCl)과 guanidine thiocyanate (GuSCN) 결합력 비교
DNA binding buffer에 사용하는 chaotropic agent의 농도가 높을수록 결합력이 좋다는 보고에 따라 chaotropic agent 중 대표적인 guanidine hydrochloride과 guanidine thiocyanate을 사용하여 결합력의 변화를 알아보았다. 각 농도에 따라 2개의 시료를 시험하였으며 외부에서 넣어준 재조합의 DNA copy 수에 따른 Ct 값 비교를 위하여 2개의 재조합 DNA 시료와 함께 qPCR를 수행하였다. 결과는 5 M과 6 M GnHCl 사이에 회수된 유전자 copy 수는 1.6×10⁶와 1.2×10⁶ 차이를 보였다 (Table 1).
GuSCN으로 제조된 binding buffer의 경우 5 M의 GuSCN binding buffer로 회수된 유전자 분자수가 1.5×10⁵이었고 4 M의 GuSCN binding buffer로 회수된 유전자의 분자수는 7.3×10⁴ 분자수였다. 하지만 5 M GnHCl binding buffer보다 적은 수의 분자가 회수되었다. 이에 꿀을 대상으로 하는 잔류 유전자 분리법으로 사용하고자 하는 binding buffer는 5 M GnHCl binding buffer가 좀 더 유리하다 판단되어 사용을 결정하였다 (Table 2).
3. DNA binding column 선발
잔류 DNA 분리에서 column의 DNA 결합능력은 중요하다. 이에 현재 국내에서 시판되는 silica membrane based column 5가지를 이용하여 DNA binding capacity의 차이를 확인하고자 하였다. 5개 회사의 column은 4.7×10⁵에서 1.1×10⁶로 회수되는 분자수가 차이를 보여 column이 꿀에서 미량의 DNA를 분리 시 고려되어야 하는 항목임을 확인할 수 있었다 (Table 3).
4. Washing buffer 선정
회수되는 DNA의 purity를 위하여 column에 DNA를 결합시킨 후 다음과 같이 washing buffer의 조성을 변화시켜 회수되는 DNA 양에 변화를 확인하였다. Washing buffer는 염과 에탄올로 구성되어 있으며 에탄올을 80%로 고정하고 염의 농도를 변화시켰을 때 에탄올을 85%로 고정하고 염의 농도를 변화시켰을 때 변화를 보았다. 또한 QIAGEN 키트의 washing buffer인 PE와 비교하였을 때 에탄올이 80%였을 때 염 농도의 변화에 따라 Ct 값은 차이를 보였으며 15 mM Tris-HCl에서 DNA 분자수가 다른 농도보다 높게 나타났다 (Table 4). 에탄올이 85%였을 때 역시 PE를 사용하였을 때보다 회수된 DNA 분자수가 높게 나타나는 것을 볼 수 있었으며 염 농도의 변화에서는 차이를 보이지 않았다 (Table 5).
5. DNA Elution buffer 선정
Column affinity법의 마지막 단계인 DNA elution buffer 선정을 위하여 10 mM Tris-HCl (pH 8.5), TE buffer (10 mM Tris-HCl, 0.5 mM EDTA, pH 8.5)와 DW 간의 elution 효과를 비교하였다. 그 결과 10 mM Tris-HCl (pH 8.5)만을 사용하였을 때 DNA 분자수가 멸균 증류수와 TE buffer보다 적게 나타나 10 mM Tris-HCl (pH 8.5)의 단독 사용은 제외하였다 (Table 6). 또한 염의 pH를 염기성에 맞추어 제조된 10 mM Tris-HCl (pH 9.0), TE buffer (10 mM Tris-HCl, 0.5 mM EDTA, pH 9.0)와 DW의 비교에서도 10 mM Tris-HCl (pH 9.0)을 단독 사용은 DNA 분자수가 가장 적게 검출됨을 확인하였고 TE buffer는 이보다 높은 분자수가 검출되었다. 또한 염기의 pH 8.5에서 높은 분자수가 검출됨을 알 수 있었다. TE buffer는 DNA를 안정되게 오래 보관할 수 있는 좋은 buffer이다. 그러나 이 분리한 DNA를 2차 다양한 반응, PCR, 염기서열분석, 효소반응 등에 사용 시 다른 반응을 저해할 수 있어 Elution은 멸균된 3′DW를 쓰는 것이 반응의 안전성에 도움이 된다고 판단하였다 (Table 7).
적 요
결론적으로 꿀에 제작된 재조합 DNA를 넣어주고 인위적으로 혼입한 재조합 DNA의 특정 프라이머를 이용하여 유전자분리의 각 단계별 회수율을 검토하는 방법으로 꿀에서 가장 적절하게 잔류하고 있는 유전자 분리법을 정립하였다.
1. 벌꿀에서 잔류 DNA의 순수분리법
- (1) 꿀 2 mL을 50 mL tube에 담고 GI buffer 10 mL을 넣고 5분간 Vortexer를 사용하여 섞어준다.
- (2) GI buffer와 꿀을 잘 섞어준 용액 모두를 affinity column에 통과시킨다. 이때 column extension accessory와 column manifolder를 vacuum에 연결하여 사용하면 좀 더 손쉽게 column을 통과시킬 수 있다.
- (3) 700 μL washing buffer를 column에 넣고 13000 rpm에서 30 sec 원심분리한다.
- (4) Collection tube에 담긴 washing buffer를 제거한 후 column을 collection tube와 다시 결합시킨 후 1분간 13000 rpm으로 원심분리하여 알코올을 날려준다.
- (5) Column을 collection tube에서 분리한 후 멸균된 1.5mL microcentrifuge tube에 놓는다.
- (6) 50 μL의 3차 멸균수를 column의 정중앙에 tip이 닿지 않게 하여 떨궈준 후 1분간 정치한다.
- (7) 13000 rpm에서 1분간 원심분리하여 넣어준 50 μL의 DNA 용액을 회수한다. 이를 확인 후 새 멸균 microcentrifuge tube에 담고 -20℃에 보관하여 PCR에 사용한다.
2. 잔류 DNA 분리에 사용되는 시약 및 그 조성
- (1) DNA binding buffer; 5 M guanidine hydrochloride (GnHCl), 30% isopropyl alcohol
- (2) Washing buffer; 15 mM Tris-HCl pH 7.6, 85% ethanol
- (3) Elution buffer; 3차 멸균 증류수
Acknowledgments
본 연구는 국립농업과학원 농업과학기반기술연구사업 (과제번호:PJ01574601)과 Korea Institute of Planning and Evaluation for Technology in Food, Agriculture and Forestry (IPET:318093-03)의 지원에 의하여 수행되었으며 이에 감사드립니다.
References
- AOAC. 1995. Official Method of Analysis of AOAC Intl. 20th ed. Method 998-12. Association of Official Analytical Chemists, Arlington, VA, USA.
- CODEX. 2001. CODEX STANDARD FOR SUGARS. CODEX STAN 212-1999. European Commission.2015. Official controls and enforcement. Honey 2015-16. Brussels, Belgium.
-
Elflein, L. and K. P. Raezke. 2008. Improved detectopm of honey adulteration by measuring differences between 13C/12C stable carbon isotope ratios of protein and sugar compounds with a combination of elemental analyzer-isotope ratio mass spectrometry and liquid chromatomraphy-isoptope ratio mass spectrometry (δ13C-EA/LC-IRMS). Apidologie 39: 574-587.
[https://doi.org/10.1051/apido:2008042]

-
Gadgil, H., S. A. Oak and H. W. Jarrett. 2001. Affinity purification od DNA-binding proteins. Journal of Biochemical and Biophysical Methods 49(1-3): 607-624.
[https://doi.org/10.1016/S0165-022X(01)00223-8]

-
Jain, S. A., F. T. de Jesus, G. M. Marchioro and E. D. de Araújo. 2013. Extraction of DNA from honey and its amplification by PCR for botanical identification. Food Sci. Technol. 33(4): 753-756.
[https://doi.org/10.1590/S0101-20612013000400022]

-
Kim, B., J. Kim, S. Kim, M. Kim, A. T. Truong, K. Cho and B. Yoon. 2019. Detection of chronic bee paralysis virus using ultra-rapid PCR and nested ultra-rapid PCR. Journal of Apicultural Reserach 58(1): 133-140.
[https://doi.org/10.1080/00218839.2018.1517999]

-
Kim, B., S. Kim, M. Kim, J. Kim, A. T. Truong and B. Yoon. 2018a. Detection of Sugar Cane (Saccharum officinarum)-specific Gene from Sugar and Sugar-honey. J. Apic. 33(3): 221-226.
[https://doi.org/10.17519/apiculture.2018.09.33.3.221]

-
Kim, S., B. Kim, M. Kim, J. Kim, A. T. Truong and B. Yoon. 2018b. Detection of Sugar Beet (Beta vulgaris)-Specific Gene from Honey Made by Sugar of Sugar Beet. J. Apic. 33(3): 213-219.
[https://doi.org/10.17519/apiculture.2018.09.33.3.213]

-
Kim, J. M., S. J. Lim, S. Kim, M. Kim, B. Kim, A. T. Truong, S. Kim and B. Yoon. 2020. Rapid detection of deformed wing virus in honeybee using ultra-rapid qPCR and a DNA-chip. J. Vet. Sci. 20(1): e4.
[https://doi.org/10.4142/jvs.2020.21.e4]

- MFDS. 2014, Food Standard Code, Ministry of food and Drug Safety, Cheongju, Korea.
-
Ruppert, K. M., R. J. Kine and M. S. Rahman. 2019. Past, present, and future perspectives of enviromental DNA (eDNA) metabarcoding: a systematic review in methods, monitoring, and application of global eDNA. Glob. Ecol. Conserv. 17.
[https://doi.org/10.1016/j.gecco.2019.e00547]

-
Soaresa, S., J. S. Amaral, M. B. P. P. Oliveira and I. Mafra. 2015. Improving DNA isolation from honey for the botanical origin identification. Food Control 48: 130-136.
[https://doi.org/10.1016/j.foodcont.2014.02.035]

-
Sobrino-Gregorio, L., S. Vilanova, J. Prohens and I. Escriche. 2018. Detection of honey adulteration by conventional and real-time PCR. Food Control 95: 57-62.
[https://doi.org/10.1016/j.foodcont.2018.07.037]

- Sung, H. J., C. Jung, J. Kwon and H. Y. Sohn. 2018. Evaluation of Commercial Korean Honey Quality and Correlation Analysis of the Quality Parameters. J. Life Sci. 28(12): 1489-1500.
-
Truong, A. T., S. Sevin, S. Kim, M. S. Yoo, Y. S. Cho and B. Yoon. 2021. Rapidly quantitative detection of Nosema ceranae in honeybees using ultra-rapid real time quantitative PCR. J. Vet. Sci. 22(3): e40.
[https://doi.org/10.4142/jvs.2021.22.e40]

Appendix
Appendix
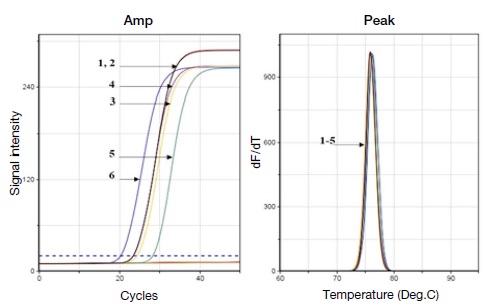
Detection of residual genes in honey according to DNA binding buffer. A melting point analysis graph for PCR amplification curve and confirmation of this amplification of the isolated pSc by adding 108 sugar cane specific gene recombinant DNA (pSc) to 100 μL honey and 500 μL of GnHCl binding buffer.
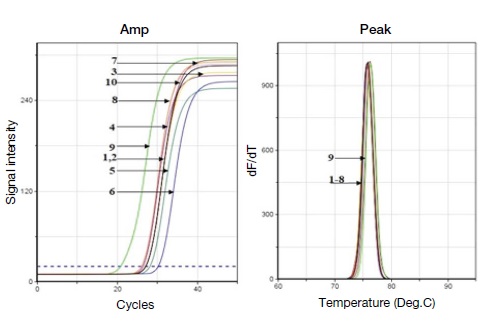
Comparison of residual gene detection in honey according to DNA binding buffer. Add 108 sugar cane specific gene recombination DNA (pSc) to 100 μL honey and 500 μL of different concentrations of GuSCN binding buffer, and the amplification curve of PCR amplicon for isolated pSc and the melting point analysis graph for checking this particularity of the amplicon.
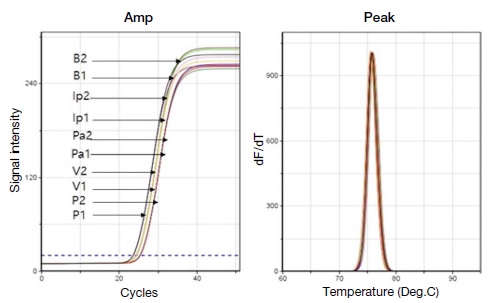
Comparison of DNA binding columns. PCR amplification curve and melting point analysis graph for pSc isolated through five different columns using a 500 μL 5 M GnHCl binding buffer with 108 sugar cane specific gene recombination DNA (pSc) in 100 μL honey.
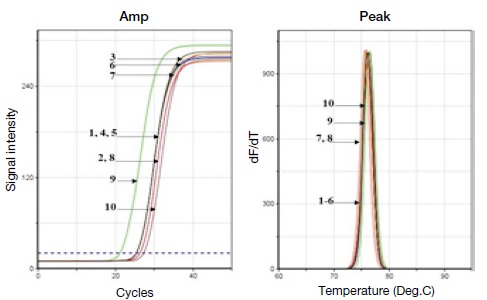
Ct and Tm values of the amount of DNA isolated according to the washing buffer composition. The PCR amplification graph confirmed that sugarcane-specific genes were amplified in recovered DNA samples obtained by washing columns with buffers that fixed ethanol at 80% and changed salt concentrations to 10 mM, 15 mM and 20 mM Tris-HCl (pH 7.6), and the melting point analysis graph confirmed that the amplified PCR amplicon in all samples.
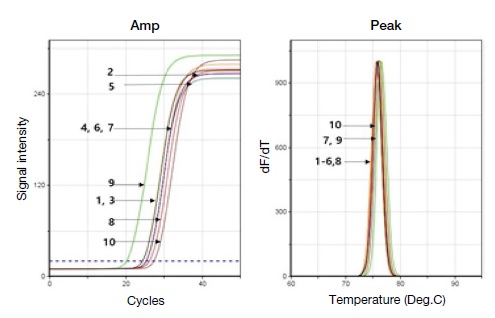
Ct and Tm values of the amount of DNA isolated according to the washing buffer composition. The PCR amplification graph confirmed that sugarcane-specific genes were amplified in recovered DNA samples obtained by washing columns with buffers that fixed ethanol at 85% and changed salt concentrations to 10 mM, 15 mM and 20 mM Tris-HCl (pH 7.6), and the melting point analysis graph confirmed that the amplified PCR amplicon in all samples.
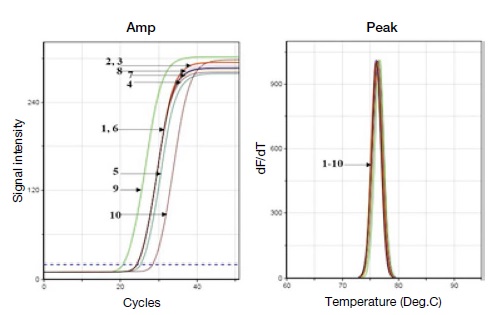
Ct and Tm values of the amount of DNA isolated according to the Elution buffer composition. The PCR amplification graph confirmed that sugarcane-specific genes were amplified in DNA samples obtained by elution with 10 mM Tris-HCl (pH 8.5), TE buffer (10 mM Tris-HCl, 0.5 mM EDTA, pH 8.5) and DW, and the melting point analysis graph confirmed that the amplified PCR amplicon in all samples.
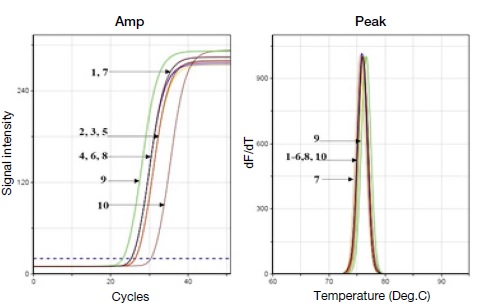
Ct and Tm values of the amount of DNA isolated according to the Elution buffer composition. The PCR amplification graph confirmed that sugarcane-specific genes were amplified in DNA samples obtained by elution with 10 mM Tris-HCl (pH 9.0), TE buffer (10 mM Tris-HCl, 0.5 mM EDTA, pH 9.0) and DW, and the melting point analysis graph confirmed that the amplified PCR amplicon in all samples.
