Honeybee In-Out Monitoring System by Object Recognition and Tracking from Real-Time Webcams
Abstract
A new honeybee in-out monitoring system is proposed using real-time deep-learning based image recognition and tracking. The specific design of beehive gate is turned out to be an important factor for accurate bee movement monitoring. We check a series of beehive gate designs for the monitoring system. A novel gate design employing heart valve structure is proposed for ensuring one-way traffic for the bees as well as one-at-a-time gate passing, resulting in an improved bee detection accuracy. As for the deep-learning based image recognition framework, YOLOv4 is used in the proposed system for a better honeybee-detection accuracy as well as a faster detection in comparison to YOLOv3 which was employed for our previous study. In addition, DeepSORT algorithm is employed for a reliable tracking of the detected honeybees. In our experiments the proposed honeybee monitoring system exhibited 99.5% detection accuracy, while our previous system resulted in 97.5% in the same settings.
Keywords:
Honeybee, Monitoring, Beehive gate, YOLO, DeepSORTINTRODUCTION
The number of bees leaving and entering the hive gate gives an important information regarding the activity of honeybee colony (Struyea et al., 1994; Lee, 2008). There has been a variety of electronic bee counters for nearly 100 years in order to automate the observation process (Odemer, 2021). The employed technologies include purely mechanical schemes, electro-mechanical schemes, optical sensors, and video-based schemes (Odemer, 2021). With the help of deep-learning based object recognition, video-based bee counters are reporting a high level of detection accuracy (Jeong et al., 2021).
Deep learning is a branch of artificial intelligence (AI) where multiple processing layers are used to learn representation of data with several layers of abstraction (LeCun et al., 2015). These layers exhibit similarity with the neural networks found in human brains. Each layer is connected to the next layer with adjustable weight values, which are fine-tuned iterative to correctly represent the training data set (Shrestha and Mahmood, 2019). This tuning process, commonly called as learning process, requires a large amount of computations and was hard to implement in real-time before. However, harnessing the computational power of the graphics processing unit (GPU), deep learning processes take much less time enabling real-time applications. The most prominent applications of deep learning include image recognition and speech recognition.
YOLO (You Only Look Once) is one of the most popular deep-learning based object recognition frame work boasting for its fast operation and high accuracy (Redmon et al., 2016). Since its first introduction in 2016, several improved versions of YOLO have been reported. Bochkovskiy et al. (2020) proposed YOLOv4 being characterized by two sets of schemes; Bag of Freebies (BOF) and Bag of Specials (BOS). BOF is the set of technique for improving object detection accuracy without incurring computational cost at inference stage (Bochkovskiy et al., 2020). The methods employed in BOF include data augmentation, distribution semantic bias, and bounding box regression. Since all these methods are related with off-line training stage, the object detection speed is not affected and hence, the improved detection accuracy comes in at no additional cost at runtime (Bochkovskiy et al., 2020). BOS is another set of accuracy-improving techniques employed in YOLOv4 incurring a slight amount of additional computation at inference stage while drastically increasing the detection accuracy. These include Mish activation function, crossstage partial connections, spatial attention module, and path aggregation networks. With the help of BOF and BOS, YOLOv4 exhibits an improved detection accuracy in comparison to the previous versions of YOLO schemes. However, when two objects are overlapped, the detection accuracy falls significantly and it is hard to track the detected objects (Jeong et al., 2021).
DeepSORT (Deep Simple Online Real-time Tracker) complements some drawback of YOLO detectors and employs Kalman filter in order to estimate the movement of the detected objects. While YOLOv3 was used in order to detect and to track honeybees in our previous study (Jeong et al., 2021), we adopted YOLOv4 together with DeepSORT for better detection and tracking honeybees at the hives. Our real-time hive monitoring system keeps the record of the number of honeybees leaving and entering the hives. In addition to the employment of better deep learning algorithm, we investigated the effects of several channel design alternatives in order to avoid bee-traffic congestion and to ensure one-way movement.
MATERIALS AND METHODS
1. Overall structure of the system
There are two sub-units in our bee monitoring system, as depicted in Fig. 1. It consists of a camera unit that captures real-time images of bees passing through acrylic passages installed between beehives and walls, and a Linux-based computer unit that processes the captured images in real time. The model of the camera unit is StreamCam by Logitech providing full HD at 1080p. The computer has one Ryzen 5-3500 CPU by AMD and equipped with 16GB memory as well as GTX 1660 GPU.
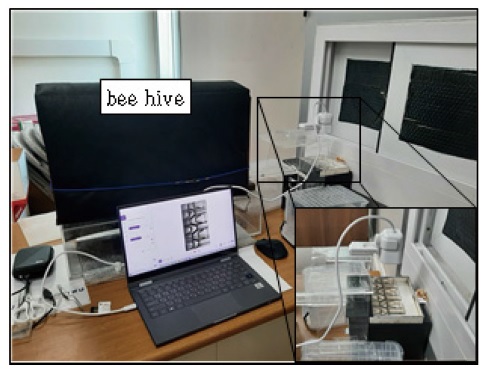
The bee monitoring system. The left side of the path is a black screened beehive, and the right side of the path is connected to the window.
A stylized diagram of our bee monitoring system is depicted in Fig. 2. We designed and installed a set of parallel channels covered with transparent acrylic panel through which honeybees are leaving and entering the hive. The camera unit was mounted to capture the whole channel area and it captured the images at 60 frames per second (FPS). A Linux based PC receives the captured video stream in real-time. YOLOv4 algorithm is used to detect the bees passing through the channels and DeepSORT algorithm is used to track the movement of the detected bees in the channel. When the detected honeybee passes through a halfway of the channel, one of the two counters, namely a counter representing the number of bees leaving the hive and another counter for the number of bees entering the hive, are updated depending on the passing direction.
2. Channel design
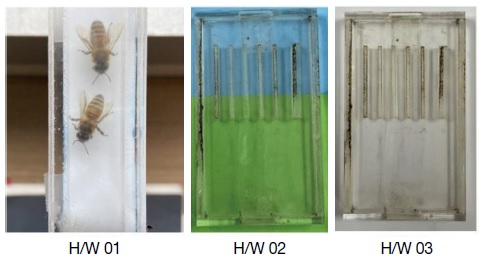
In order to make channels through which bees pass, several parts were made of acrylic plates which were processed by a laser cutter. Fig. 3 shows an evolution of the first three designs. When a single line passage was made, labelled as H/W 01 in Fig. 3, the number of overlapped passing bees increased when they entered or left the same passage, resulting in poor object recognition. The channel width was 15 mm in H/W 01.
To solve this problem, the passage was divided into several lines, as shown in H/W 02. However, due to the effects of lighting and transparent acrylic plates, objects or colors under the passage were introduced in the machine learning process, which resulted in low detection accuracy. The lighting and reflection issues could be resolved by putting a white drawing paper at the bottom of the acrylic plate as shown in H/W 03. We applied different widths, from 8 mm to 12 mm, at the parallel channels in H/W 02 and H/W 03 in order to observe the effects of channel width on the behavior of the bees.
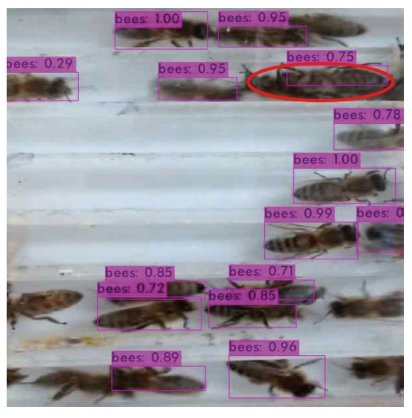
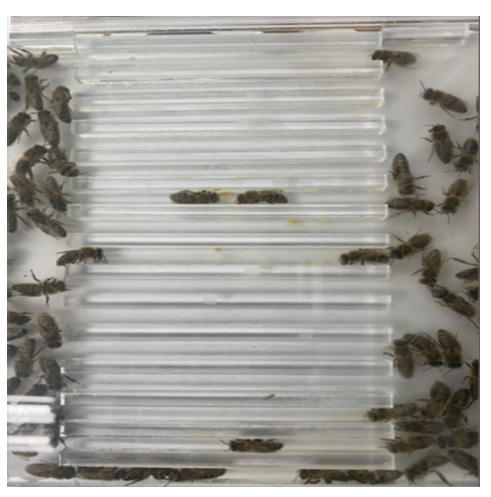
We observed several cases of mis-detection and found that overlapping bees are causing the mis-detections. Sometimes, two bees are moving in the same direction but in parallel at the same time, causing the other overlapping scene. Such a case can be observed in Fig. 4 where a red ellipse was used to indicate the two bees overlapped. We decreased the width of the channel in order to prevent the overlapping bees. The channel width was wide enough for one bee to pass through but was narrow for two bees passing. The modified channel design is depicted in Fig. 5, where we can observe that bees are passing through the channel one by one.
However, the narrower channel design led a so-called traffic congestion; many bees are waiting to enter or leave the hive at the both sides of the passages. When many bees are trying to leave the hive at the same time, these narrow channels were not helpful for them to pass through in a speedy manner. We observed that some drones are bigger than worker bees, adding the congestion severe. Another problem was the slippery surface of the channel made of acrylic material, over which bees seemed to have hard time to get firm grip of the floor. Sometimes bees entered into a channel from the left side to leave the hive and the other bees from the right side to enter the hive, causing deadlock in the middle. This was an inherent problem in a bi-directional channel.
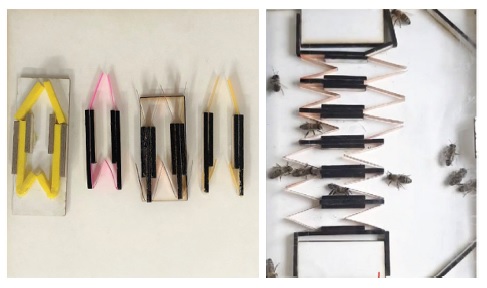
Based on the above observations, we modified the material and the design of the channels. Firstly, we used MDF wood for the floor and the walls of the channels in order to provide a better grip to the bees. However, we kept using acrylic panel at the ceilings as they have to be transparent. Secondly, we designed each channel for one-way traffic using a heart-valve mechanism, as depicted in Fig. 6. The heart valve opens at an appropriate time and discharges the blood forward, closes again, and blocks the blood from flowing back. As a result, it plays an important role in controlling blood flow so that it does not flow in the opposite direction. In the same way, we expected the bees to move only in one direction and not in the other direction. Also, the opening was narrow enough for ensuring only one bee enter into the channel at the same time.
In our experiment, we used four different materials for the heart value; sponge, colored paper, copper sheet, and clear vinyl, as shown in Fig. 7. A series of test revealed that copper sheet was effective as the heart value. The used copper sheet is 0.1 mm thick and exhibits elasticity, a characteristic that can effectively serve as a valve. It was flexible enough for the bees to push through as well.
3. Deep-learning based image detection and tracking framework
YOLO is a Convolutional Neural Network (CNN)-based object recognition algorithm (Redmon et al., 2016). It is one of the frequently used algorithms for conducting object detection. With a representative single-step object detection algorithm, the original image is divided into boxes of the same size to predict the number of boundary boxes around the center of each box, and the likelihood is calculated based on this bounding box. Depending on the calculation result, we select a location with high object reliability to identify the object category, which can be said to be a “square box” in the image processing result we see. Since the process of recognizing this object shows much faster performance than other algorithms and is powerful in real time, the YOLO network was used in this study. Darknet, a framework used to use YOLO, is one of the deep learning open source frameworks and was created only for YOLO (Redmon et al., 2016). The PC environment used during the experiment is summarized in Table 1.
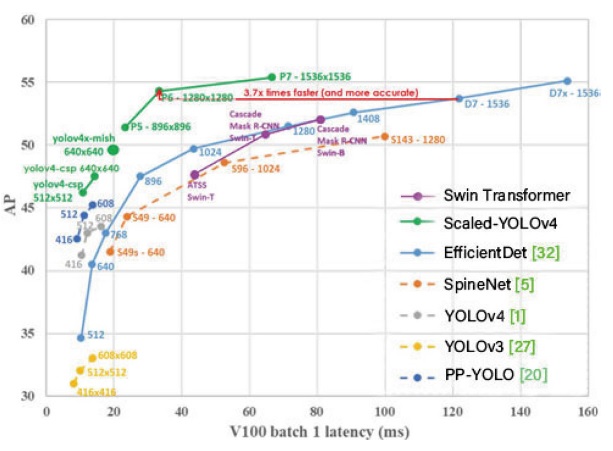
At the beginning of the study, YOLOv3, the previous version of YOLOv4, was used, but since the difference in their detection accuracies between the two YOLO versions is known to be significant, we employed YOLOv4 for our final experiment. Fig. 8 compares several deep-learning based object detection frameworks (Wang et al., 2021). The horizontal axis of the graph represents processing latency when using Tesla V100 GPU, and the vertical axis represents the average precision (AP). Comparing the APs of YOLOv3 and YOLOv4 for the image size of 608×608, we can observe that the AP of YOLOv4 is approximately 43, while that of YOLOv3 is around 33, at the similar computing latency. The performance improvement of YOLOv4 in comparison to YOLOv3 in terms of their AP values amounts to 30%. It can also be observed that several variant object detection schemes may result in higher AP values than that of YOLOv4.
4. Training YOLOv4 network
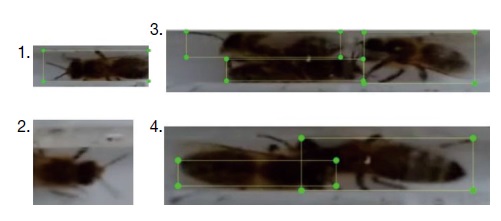
In order to train the neural network connection weights, labeling was performed in an image format suitable for the darknet framework. We performed the labeling through a SW tool called ‘LabelImg’ in Window 10 PC, as shown in Fig. 9. Labeling was carried out on 2,600 images applying the rules shown in Table 2. We designed the rules in Table 2, which were carefully selected while applying to the captured image set. This labeling result were used as the ground truth at the training stage as well as at the validation stage. The data partition ratio for the training, the test, and the validation, was set to 7 : 2 : 1. Since we had to train one class called “bee”, we revised the configuration file for YOLOv4 in order to reflect this fact. It is customary to run the training for 2,000 epochs per class. We applied 6,000 epochs at the training stage for a better performance.
5. DeepSORT algorithm
Applying YOLOv4 for detecting honeybees in a single image was successful in our experiment, resulting in approximately 98% detection accuracy. However, there were many restrictions to track the detected objects and to use the tracking results for updating the counter values. While detecting the honeybees in real time, we observed a blinking phenomenon of the box surrounding the bees. Looking into this problem, we found out that it is caused by YOLOv4 frameworks which is being applied frame by frame independently, not utilizing the detected information at the previous frame. In order to aid continuous tracking of the detected honeybees, we considered using the most popular tracking algorithm, known as DeepSORT (Wojke et al., 2017). DeepSORT makes use of the neural network connection weights which were obtained from YOLOv4 by training. We could identify, finally, the in-out movement of the detected honeybees using the above DeepSORT algorithm. This way, we could eliminate the bounding box blinking problem and we could apply the tracking results for counting the bees leaving from and entering to the hive.
RESULTS AND DISCUSSION
1. Training process
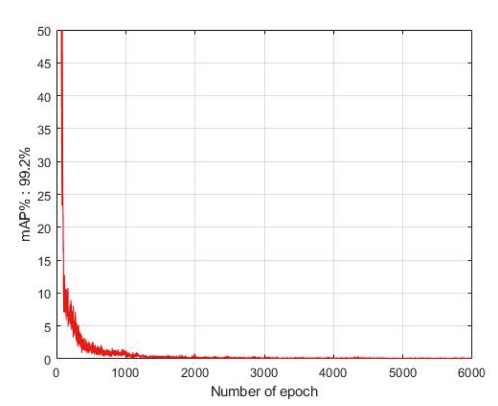
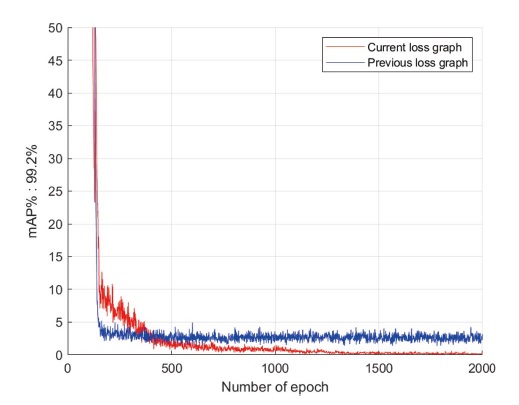
The convergence of the neural network connection weights can be observed in terms of loss rate as a function of training epoch in Fig. 10. We can observe that the loss rate is decreased as the training progresses. We applied 6,000 epochs for the training process. However, the weights at 5,000 epochs resulted in the lowest loss rate and were used for inference stage for the best detection performance.
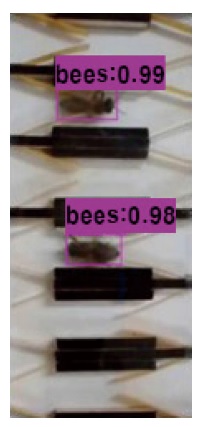
Fig. 11 shows the snapshot result of object recognition of a sample image of two moving bees using the YOLOv4 with the corresponding weights. It can be seen on Fig. 11 that the object detection reliability values were 0.99 and 0.98, for the two detected honeybees, respectively.
2. Counter software implementation
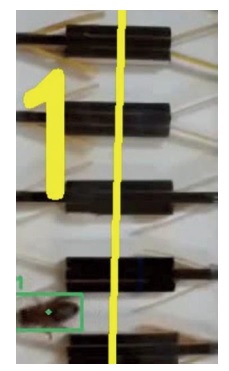
In the previous stage, we employed DeepSORT in order to track the detected honeybees reliably. To implement bee counters, we need to make use of the tracking results to update the counter values. Since the bounding box is a rectangular shape, the center of gravity of the bounding box can be calculated easily. When the center of gravity passes through a predefined vertical threshold value, we updated the counter value corresponding to the moving direction. Fig. 12 shows a scenario when a honeybee passes through the vertical line at the center of the image from the right to the left side, resulting in the increment of the counter value. The right side of the image in Fig. 12 corresponds to the outside of the beehive and the left side is connected into the beehive, implying that the bee is entering back to the hive. The counter value corresponds to the number of bees entering the hive and is shown to be increased by one.
3. Comparisons to our previous studies
In our previous experiment (Jeong et al., 2021), we employed YOLOv3 and used the old channel structure. By applying the improved heart-valve aided one-way channel as well as YOLOv4 combined with DeepSORT, the detection rate of the moving honeybees could be much improved, as seen in Fig. 13. Comparing the previous loss graph (left side of Fig. 13) with the current loss graph (right side of Fig. 13) after improvement, it can be seen that the loss rate was improved from 2.6% to 0.24%.
4. Future research directions
We observed that some honey bees were staying at the corners of the channel structure, not entering into the channel, implying that the bee behavior was affected by the monitoring system. Ideally, there should be no obstruction for the bees entering and leaving the hive, while ensuring a successful monitoring. In our future experiment, we will consider a rhombus structure for the housing of the channels to alleviate the problem.
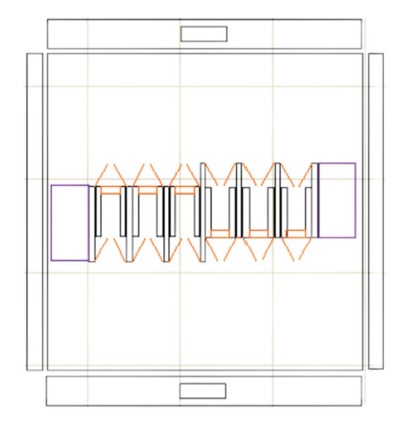
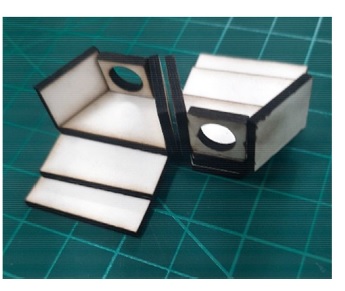
We also observed that some honeybees are trying to enter the channel in the reverse direction. In order to reduce this kind of behavior, we are considering a modified gate structure, depicted in Fig. 14, which employs a step-wise ramp for the bees to crawl upward to the entry point. The left unit in the figure is for the entry point and the right unit is for the exit point. It can be observed that the bees would have difficulty entering into the exit unit because of the raised hold without the ramp. On the other hand, the entry unit has the step-wise ramp which aids the bees to crawl upward up the entrance hole.
Acknowledgments
This study was supported by the Joint Research Project of the Rural Development Administration (PJ014762) in Rep. Korea.
References
- Bochkovskiy, A., C.- Y. Wang and H. Liao. 2020. YOLOv4: Optimal Speed and Accuracy of Object Detection. https://arxiv.org/abs/2004.10934
- Campbell, J., L. B. Mummert and R. Sukthankar. 2008. Video monitoring of honey bee colonies at the hive entrance. Visual observation and analysis of animal and insect behavior: Proc. ICPR 2008.
-
De Souza, P., P. Marendy, K. Barbosa, S. Budi, P. Hirsch, N. Nikolic, T. Gunthorpe, G. Pessin and A. Davie. 2018. Low-Cost Electronic Tagging System for Bee Monitoring. Sensors 18(7): 2124.
[https://doi.org/10.3390/s18072124]

- Guillaume, C., P. Gomez-Krämer and M. Ménard. 2013. Outdoor 3D acquisition system for small and fast targets. Application to honeybee monitoring at the beehive entrance. GEODIFF 2013: 10-19.
- Jeong, C. H., M. J. Kim, J. S. Ryu and B. J. Choi. 2021. Implementation of the honeybee monitoring system using object recognition. Proc. KICS Conf. 2021: 806-807.
-
LeCun, Y., Y. Bengio and G. Hinton. 2015. Deep learning. Nature 521: 436-444.
[https://doi.org/10.1038/nature14539]

-
Lee, C. H., Y. J. Yoon, T. H. Kim, J. H. Park, S. B. Park and C. E. Chung. 2019. Performance comparison of deep convolutional neural networks for vespa image recognition. J. Apic. 34: 207-215.
[https://doi.org/10.17519/apiculture.2019.09.34.3.207]

- Lee, M. L. 2008. The characteristics of the colony collapse disorder and the domestic situation. KBAB 331: 16-17.
-
Lee, M. L., G. H. Byoun, M. Y. Lee, Y. S. Choi and H. K Kim. 2016. The Effect of CH4 on Life Span and Nosema Infection Rate in Honeybees, Apis mellifera L. J. Apic. 31(4): 331-335.
[https://doi.org/10.17519/apiculture.2016.11.31.4.331]

-
Odemer, R. 2021. Approaches, challenges and recent advances in automated bee counting devices: A review. Ann. Appl. Biol. 2021: 1-17.
[https://doi.org/10.1111/aab.12727]

-
Redmon, J., S. Divvala, R. Girshick and A. Farhadi. 2016. You Only Look Once: Unified, Real-Time Object Detection. CVPR 2016: 779-788.
[https://doi.org/10.1109/CVPR.2016.91]

-
Shrestha, A. and A. Mahmood. 2019. Review of Deep Learning Algorithms and Architectures. IEEE Access 7: 53040-53065.
[https://doi.org/10.1109/ACCESS.2019.2912200]

-
Struyea, M. H., H. J. Mortiera, G. Arnoldb, C. Miniggioc and R. Borneckc. 1994. Microprocessor-controlled monitoring of honeybee flight activity at the hive entrance. Apidologie 25: 384-395.
[https://doi.org/10.1051/apido:19940405]

-
Wang, C, A. Bochkovskiy and H. M. Liao. 2021. Scaled-YOLOv4: Scaling Cross Stage Partial Network. CVPR 2021: 13029-13038.
[https://doi.org/10.1109/CVPR46437.2021.01283]

-
Wojke, N., A. Bewley and D. Paulus, 2017. Simple online and real-time tracking with a deep association metric. IEEE ICIP 2017: 3645-3649.
[https://doi.org/10.1109/ICIP.2017.8296962]


