Integrated Identification of the Botanical Origins of Uzbekistan Bee Pollen by Morphological and Molecular Methods
Abstract
Bee pollen is an important nutritional source for the growth and development of bee colonies. The botanical origins of bee pollen can vary significantly based on geographic and temporal factors. This study employed both palynological and molecular identification methods to determine the botanical origins of bee pollen samples collected from Tashkent, Uzbekistan. The palynological analysis identified 11 botanical origins, with major sources including Capparis spinosa, Apiaceae, Hypericum scabrum, Onobrychis sp., Papaveraceae, and Capparaceae. In contrast, the molecular method, employing DNA metabarcoding, identified 26 plant taxa, demonstrating higher resolution and efficiency. Major taxa identified included Capparis spinosa, Cucurbitaceae, Papaveraceae, Onobrychis sp., Eremurus robustus, and Rosa sp. A linear mixed-effects model (LMEM) revealed a positive correlation between the proportion of rbcL reads and the actual proportion of taxa, underscoring the reliability of molecular methods. The use of both methods highlighted the strengths and limitations of each approach: palynology offers cost-effective and stable morphological identification, while molecular identification offers greater accuracy with a wider range of taxa. The findings of this study provide valuable insights into the available floral resources and foraging preference of honey bees in Uzbekistan and can be utilized by policy makers and local beekeepers to enhance the sustainability and productivity of honey bees.
Keywords:
Palynology, Apis mellifera, Metabarcoding, Uzbekistan, Melliferous flower, rbcLINTRODUCTION
Bee pollen is a complex and nutrient-rich mixture composed of plant pollen, saliva, and nectar collected by bees. Bees use this mixture to form small granules, which they transport back to their hives. This substance serves as an essential source of nutrition, especially protein, fat, and micronutrients, for adult bees as well as bee larvae, aiding their growth and healthy development (Mejías and Montenegro, 2012). Beyond its importance to bee health, bee pollen offers valuable insights into the ecological preferences and environmental conditions that influence bee foraging behavior. The composition of bee pollen is highly variable, influenced by factors such as geography, season, and the availability of floral resources, making it a useful indicator of bees’ preferred food sources and the surrounding flora (Danner et al., 2016; Giampieri et al., 2022).
Analyzing the botanical origin of bee pollen can provide important information about the biodiversity and health of ecosystems. There are two primary methods for such analysis: palynology and molecular identification. Palynology involves the visual identification of pollen grains using morphological characteristics and microscopic examination. This method relies on established morphological keys to trace the botanical origins of pollen grains (Feás et al., 2010). While palynology is a traditional and widely used technique, it can be limited by the expertise required for accurate identification and the potential for morphological similarities between different plant species.
Molecular identification, on the other hand, employs genetic analysis to identify plant species present in the bee pollen. This method involves extracting DNA from bee pollen samples and using techniques such as polymerase chain reaction (PCR) and DNA sequencing to determine the botanical origins. Molecular identification offers a more precise and potentially comprehensive approach, as it can distinguish between species with similar morphological characteristics and detect plant taxa that are difficult to identify visually (Chang et al., 2018). The advent of high-throughput sequencing technologies has further enhanced the potential of molecular methods to provide detailed and accurate insights into the botanical composition of bee pollen.
Uzbekistan, located in Central Asia, presents a unique environment for studying bee pollen due to its diverse topography and climate. The country is characterized by a predominance of desert (85%) and a smaller proportion of mountains and foothills (15%). This diverse landscape supports a variety of cultivated and wild melliferous plants, which are crucial for local beekeeping practices (Mamadalieva et al., 2017; Atamuratova et al., 2021). The rich floral diversity in Uzbekistan offers an excellent opportunity to study the interactions between bees and their foraging environments. However, despite the importance of these plants for local beekeeping, research on their taxonomy and the properties of the honey produced from them remains limited (Atamuratova et al., 2021).
In this study, we aim to address this research gap by analyzing bee pollen from Uzbekistan to determine its botanical origin using both palynology and molecular identification methods. By comparing these two analytical approaches, we seek to establish which method is more suitable for accurately identifying the diverse plant sources of bee pollen in this unique region. This investigation will not only enhance our understanding of the botanical diversity in Uzbekistan but also contribute to the broader field of palynology and the study of pollinator-plant interactions. Furthermore, the findings of this study could have practical implications for beekeeping practices and the conservation of floral resources in Uzbekistan, ultimately supporting the health and sustainability of bee populations in the region.
MATERIALS AND METHODS
The experiment was conducted using three bee pollen samples purchased directly from the Mirabad Bazaar in Uzbekistan on July 28, 2022.
1. Palynological analysis
For the palynological analysis, subsets of at least 0.25 g of bee pollen from each sample were processed. Each subset was homogenized in a test tube with 10 mL of 95% glacial acetic acid under a fume hood to remove water from the samples. The mixtures were vortexed and centrifuged at 1,060 g for 2 minutes. After decanting the glacial acetic acid, 10 mL of an acetolysis mixture, consisting of a 9 : 1 ratio of acetic anhydride to sulfuric acid, was gradually added. The mixtures were stirred occasionally and allowed to react on a heating block at 80℃ for 10 minutes. Once the reaction was complete, the samples were topped off with glacial acetic acid, allowed to cool, and centrifuged again at 1,060 g for 2 minutes. The supernatant was discarded, and the samples were subjected to a series of washes with glacial acetic acid and distilled water. Finally, 10 mL of 95% ethanol was added, and the samples were centrifuged at 1,060 g for 2 minutes. The samples were then transferred to Eppendorf tubes containing glycerin and left open for 24 hours to dry the ethanol. The following day, slide samples were prepared by evenly spreading a drop of bee pollen residue across the slide and sealing it with a coverslip using clear nail polish. The slides were photographed at 200x magnification using a microscope (OLYMPUS BX53) using IMT i-Solution Lite software (Copyright© 2001-2019 IMT i-Solution Inc., 308-4501 North Road, Burnaby, BC, CANADA). The identification of pollen grains was made possible by comparing surface pattern features of pollen such as the arrangement, shape, and number of germination spheres with the guidelines available in the pollen guidebook published by the National Biological Resource Center (Republic of Korea) and native plants of Uzbekistan as reference (Jumayev et al., 2021; Rakhimova et al., 2021). Pollen morphology was possible by comparing with guidelines available in online databases such as Pollen Wiki and PalDat-Palynological.
2. Molecular analysis
DNA extraction was performed following the method described by Richardson et al. (2021). Briefly, each bee pollen jar was subsampled and homogenized in three replications. For each subsample, 20 g of each bulk sample was mixed with distilled water to yield a final concentration of 0.1 g/mL of bee pollen. The bee pollen mixture was homogenized in a blender for 2.5 minutes. Subsequently, 1.4 mL of the bee pollen homogenate was placed in a 2 mL microcentrifuge tube containing sterilized beads and vortexed for 5 minutes at the highest speed. From this homogenate, 400 μL was used for DNA extraction using the DNeasy Plant Minikit (QIAGEN Inc., Germany) according to the manufacturer’s protocol.
Library preparation of the rbcL (ribulose-1,5-bisphosphate carboxylase/oxygenase large subunit) DNA barcode marker region was carried out using two rounds of PCR, following the method described by Mohamadzade Namin et al. (2022a). Sequencing was performed by Macrogen (Seoul, South Korea) and all sequence information has been deposited in the National Center for Biotechnology Information (NCBI) Sequence Read Archive (accession code PRJNA1126295). The bioinformatic analysis also followed the protocol of Mohamadzade Namin et al. (2022a). The BLASTN algorithm (blast-2.11.0) was used to align representative sequences with the GenBank-derived sequence library, applying the following settings: E-value cutoff 1e-125, number of alignments 5, output format 0, number of descriptions 10, and a percent identity threshold of 95%. The species name was assigned to a sequence when the top bit score matched a single species. If the top bit score was the same for different species within the same genus, the sequence was identified at the genus level. A family-level assignment was made when the top bit score matched multiple genera within the same family. Sequences that could not be identified at the family level were discarded. The relative abundances of each taxon, expressed as percentages, were used as a semi-quantitative measure to infer the foraging behavior of honey bees.
3. Data analysis
We evaluated the correlation between the proportion of DNA sequencing reads and the proportion of plant species identified through palynology using a linear mixed-effects model (LMEM). This analysis was conducted with the lmerTest package in R. In the model, plant species within different pollen samples were treated as a random effect. Additionally, we employed the Mann-Whitney U test to compare differences in taxa richness detected by the molecular and morphological identification methods.
RESULTS AND DISCUSSION
1. Palynological analysis
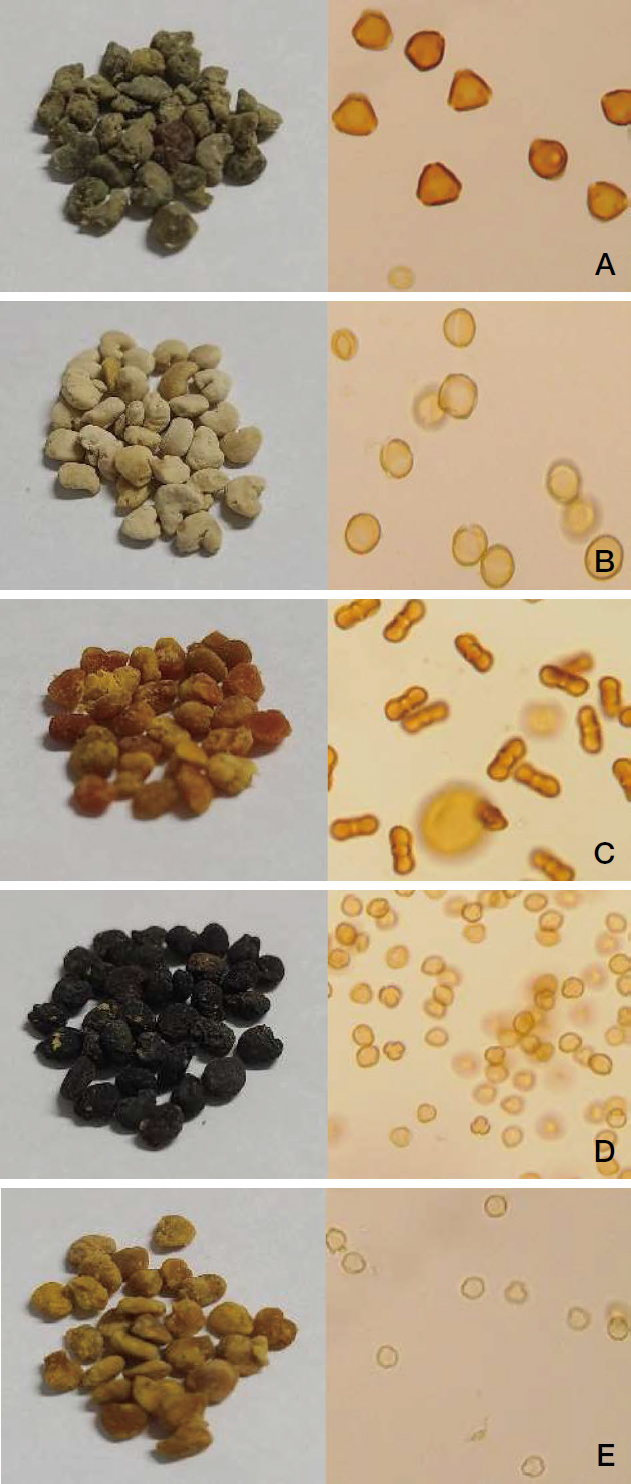
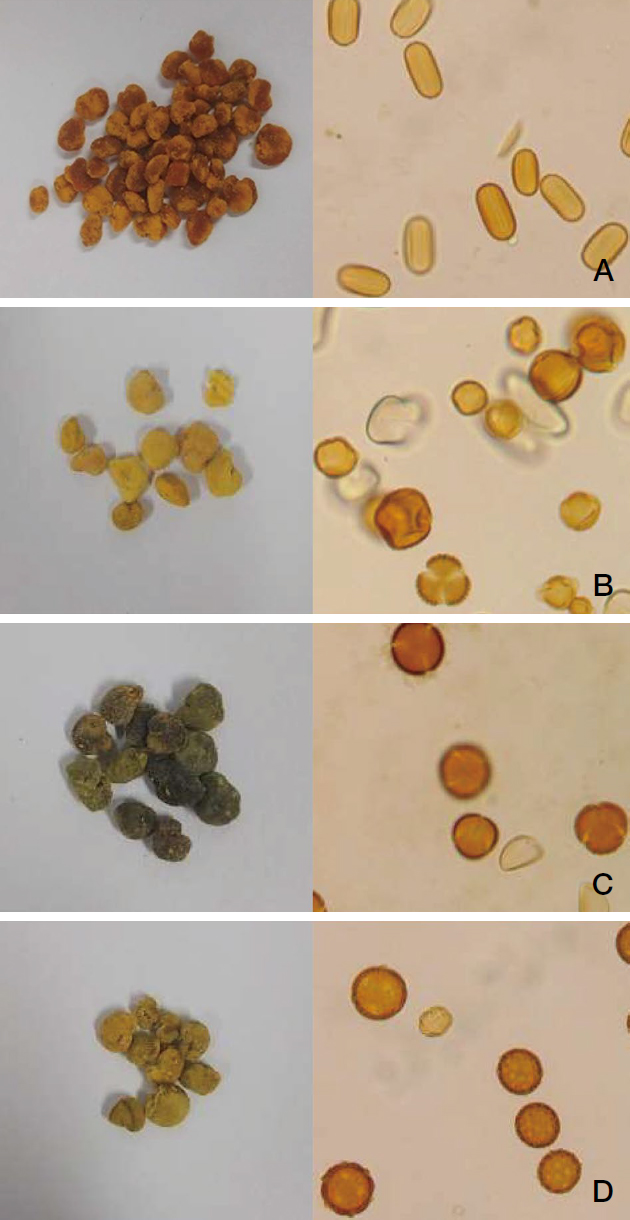
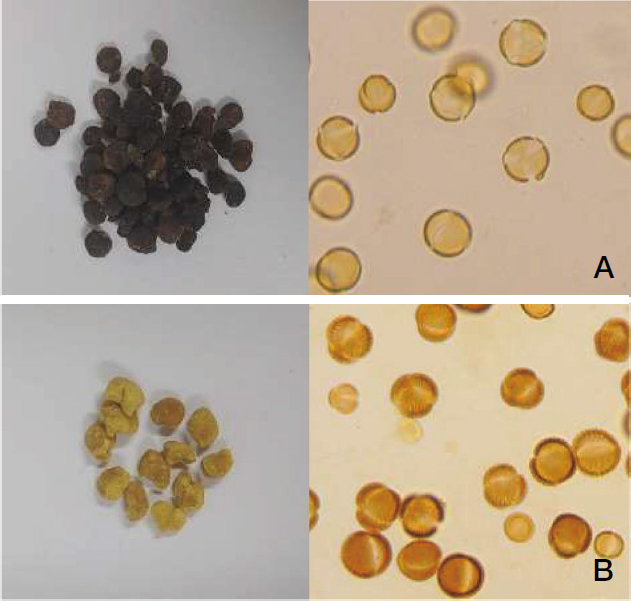
The palynological analysis identified a total of 11 botanical origins in the bee pollen samples. The major pollen sources included Capparis spinosa, members of the Apiaceae family, Hypericum scabrum, Onobrychis species, and various members of the Papaveraceae family (Table 1). Figs. 2-4 show microscopic photographs of the bee pollen after classification by color and subsequent morphological identification. Pollen samples from BP1 were divided into five color groups, whereas the pollen samples from BP2 and BP3 were divided into four and two color groups, respectively. The analysis of pollen samples after separation based on color demonstrated that, while most bee pollen samples originated from a single plant source, some of them originated from multiple plant sources (Fig. 3-B). Generally, bee pollen from a single plant origin will exhibit a uniform color, while pollen from multiple botanical origins will display a mixture of colors. However, previous studies have shown that the relationship between pollen color and plant origin does not necessarily indicate a direct link (Almeida-Muradian et al., 2005). Thus, while color classification may provide some consistency, it is not a fully reliable method for identifying botanical origins (Chin and Sowndhararajan, 2020).

Plant taxa and their proportion (mean±SD %) in the analyzed bee pollen samples using palynology and metabarcoding approaches

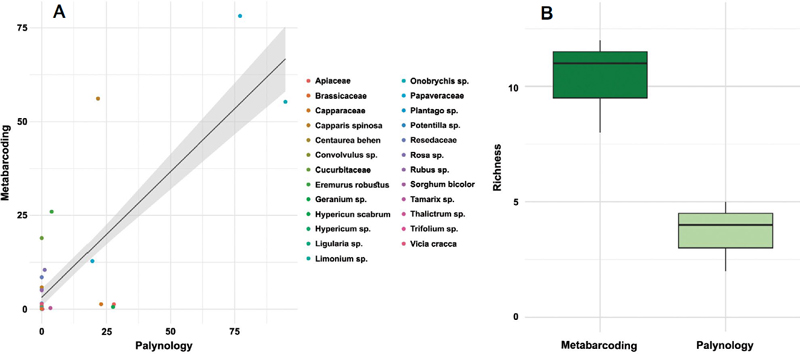
(A) The correlation between the observed proportion of each plant taxon using palynology and the proportion of molecular reads in three pollen samples from Uzbekistan using the linear mixed effect model (LMEM). (B) Box plot comparing the plant taxa richness of pollen samples from Uzbekistan using two methods, Metabarcoding and Palynology.

Morphological analysis of BP1, (A) Capparis spinosa, (B) Papaveraceae, (C) Apiaceae, (D) Hypericum scabrum, (E) Tamarix sp.

Morphological analysis of BP2, (A) Onobrychis sp., (B) Eremurus robustus & Potentilla sp., (C) Rosa sp., (D)Thalictrum sp.
Palynology requires significant expertise and extensive botanical knowledge on the part of the researcher. It is particularly limited in distinguishing between pollen from morphologically similar plant species (Williams and Kremen, 2007). These limitations can often lead to erroneous results, as noted by Khansari et al. (2012). Therefore, while palynology remains a valuable tool for botanical identification, its reliance on morphological characteristics presents challenges in accuracy and consistency.
2. Molecular analysis
The molecular identification method revealed a total of 26 botanical origins in the bee pollen samples. The primary melliferous plants identified included Capparis spinosa, Cucurbitaceae, Papaveraceae, Onobrychis, Eremurus robustus, and Rosa (Table 1). We also conducted an LMEM analysis to assess the quantitative matching between the percentage of sequence reads and the proportion of each taxon in the pollen samples. Our results indicated a positive correlation between the proportion of rbcL reads and the true proportion of taxa (Fig. 1, adjusted R2: 0.34, intercept=3.16, slope=0.67). The positive correlation between the results of palynology and the proportion of reads using chloroplast molecular markers underscores the reliability of molecular methods and has been reported previously in numerous studies, making molecular markers such as rbcL, matK, and trnL preferable for qualitative and quantitative analysis of pollen samples (Keller et al., 2015; Kraaijeveld et al., 2015; Pornon et al., 2017; Baksay et al., 2020).
Table 1 indicates the plant origin of pollen samples and their proportions within the samples for both identification methods. The molecular method identified a broader range of plant species than the palynological method, suggesting that the molecular approach may be more effective for comprehensive botanical surveys. In the palynological method, pollen samples were first divided based on their coloration and then prepared as microscopic slides for identification. However, the results might differ if the pollen were thoroughly mixed before slide preparation (as done for the molecular method) and then identified. When classifying based on color, we excluded bee pollen with a mixture of colors, which likely excluded bee pollen with a relatively small number of colors.
The comparison of the two methods highlights the strengths and weaknesses of each approach. Palynological analysis, is cost-effective and capable of visual identification of pollen morphology, benefits from the stable nature of pollen, which retains its morphology over time (Mackenzie et al., 2015; Chang et al., 2018). However, it is limited by the need for expert botanist and the potential for morphological misidentification. On the other hand, the molecular methods have the advantage of distinguishing between morphologically similar plants. Additionally, as the identification is conducted using DNA barcode markers (Bruni et al., 2012), there is a reduced likelihood of observer error, leading to more objective and reliable results (Pospiech et al., 2021; Soares et al., 2023). Furthermore, there is a possibility to process a larger sample size in a relatively shorter period (Wu et al., 2021). Despite its advantages, the molecular method is also limited by its expensive infrastructure, being susceptible to sample contamination, DNA degradation, sequencing errors, and the need for a bioinformatics specialist for data analysis (Wu et al., 2021; Mohamadzade Namin et al., 2022b). Given these strengths and limitations, it is most effective to use a combination of both analytical methods where the infrastructure and requirement for the application of both methods are available. Complementary experiments that integrate palynological and molecular techniques can provide a more comprehensive and accurate identification of pollen sources.
The findings of this study provide valuable insights for the development of beekeeping in Uzbekistan and contribute to better management of honey bee foraging plants. Although the lack of detailed collection information for the bee pollen samples hinders the ability to draw more robust conclusions about the botanical origins and ecological contexts, this study provides important insights into the preferred foraging plants of honey bees in Uzbekistan, for which limited information was available. Additionally, local beekeepers can use this information to make informed decisions about the selection and management of foraging plants, ultimately supporting the health and productivity of their colonies. Future studies should focus on collecting pollen samples using pollen traps throughout the season. This approach will help create a more comprehensive database of the pollen foraging plants available to honey bees in Uzbekistan. Such information will enhance our understanding of the foraging activities and preferences of honey bees and can be utilized in developing conservation strategies necessary to support honeybee populations, which are currently in decline. Moreover, future research should consider integrating additional analytical techniques, such as chemical analysis, to complement the palynological and molecular methods (Kenđel and Zimmermann, 2020). Chemical analysis can provide detailed information about the nutritional and chemical properties of the pollen, such as protein content, amino acids, and secondary metabolites. This data can help elucidate the nutritional preferences of honey bees and their responses to different pollen sources. By combining these methods, researchers can gain a more comprehensive understanding of the factors influencing bee pollen composition and its implications for bee foraging behavior and colony health. This integrated approach can lead to more effective conservation strategies and enhance the sustainability of honeybee populations.
Acknowledgments
This study was supported by the National Research Foundation of Korea (NRF-2018R1A6A1A03024862), and Smart-AI Uz program (2022K1A3A9A05036394).
References
-
Almeida-Muradian, L. B. D., L. C. Pamplona, S. Coimbra and O. M. Barth. 2005. Chemical composition and botanical evaluation of dried bee pollen pellets. J. Food Compost. Anal. 18(1): 105-111.
[https://doi.org/10.1016/j.jfca.2003.10.008]

-
Atamuratova, N. T., R. Mukhamatzanova and B. K. Ch. 2021. Honey significance of forest lands in south Uzbekistan. In IOP Conference Series: Earth. Environ. Sci. 775: 012013.
[https://doi.org/10.1088/1755-1315/775/1/012013]

-
Baksay, S., A. Pornon, M. Burrus, J. Mariette, C. Andalo and N. Escaravage. 2020. Experimental quantification of pollen with DNA metabarcoding using ITS1 and trnL. Sci. Rep. 10(1): 4202.
[https://doi.org/10.1038/s41598-020-61198-6]

-
Bruni, I., F. De Mattia, S. Martellos, A. Galimberti, P. Savadori, M. Casiraghi, P. L. Nimis and M. Labra. 2012. DNA barcoding as an effective tool in improving a digital plant identification system: a case study for the area of Mt. Valerio, Trieste (NE Italy). PLoS One 7(9): e43256.
[https://doi.org/10.1371/journal.pone.0043256]

-
Chang, H., J. Guo, X. Fu, Y. Liu, K. A. Wyckhuys, Y. Hou and K. Wu. 2018. Molecular-assisted pollen grain analysis reveals spatiotemporal origin of long-distance migrants of a noctuid moth. Int. J. Mol. Sci. 19(2): 567.
[https://doi.org/10.3390/ijms19020567]

-
Chin, N. L. and K. Sowndhararajan. 2020. A review on analy- tical methods for honey classification, identification and authentication. Honey Analysis-New Advances and Challenges.
[https://doi.org/10.5772/intechopen.77854]

-
Danner, N., A. M. Molitor, S. Schiele, S. Härtel and I. Steffan-Dewenter. 2016. Season and landscape composition affect pollen foraging distances and habitat use of honey bees. Ecol. Appl. 26(6): 1920-1929.
[https://doi.org/10.1890/15-1840.1]

-
Feás, X., J. Pires, A. Iglesias and M. L. Estevinho. 2010. Charac- terization of artisanal honey produced on the Northwest of Portugal by melissopalynological and physico-chemi- cal data. Food Chem. Toxicol. 48(12): 3462-3470.
[https://doi.org/10.1016/j.fct.2010.09.024]

-
Giampieri, F., J. L. Quiles, D. Cianciosi, T. Y. Forbes-Hernán- dez, F. J. Orantes-Bermejo, J. M. Alvarez-Suarez and M. Battino. 2022. Bee products: An emblematic example of underutilized sources of bioactive compounds. J. Agric. Food Chem. 70(23): 6833-6848.
[https://doi.org/10.1021/acs.jafc.1c05822]

-
Jumayev, J. M., M. Z. Kholmurodov and K. A. Khalilova. 2021. Phenology and growth indicators of honey trees and bushes in Uzbekistan. In E3S Web of Conferences (Vol. 244, p. 02050). EDP Sciences.
[https://doi.org/10.1051/e3sconf/202124402050]

-
Keller, A., N. Danner, G. Grimmer, M. Ankenbrand, K. von der Ohe, W. von der Ohe, S. Rost, S. Härtel and I. Steffan-Dewenter. 2015. Evaluating multiplexed next-generation sequencing as a method in palynology for mixed pollen samples. Plant Biol. (Stuttg). 17(2): 558-566.
[https://doi.org/10.1111/plb.12251]

-
Kenđel, A. and B. Zimmermann. 2020. Chemical analysis of pol- len by FT-Raman and FTIR spectroscopies. Front. Plant Sci. 11: 503504.
[https://doi.org/10.3389/fpls.2020.00352]

-
Khansari, E., S. Zarre, K. Alizadeh, F. Attar, F. Aghabeigi and Y. Salmaki. 2012. Pollen morphology of Campanula (Cam- panulaceae) and allied genera in Iran with special focus on its systematic implication. Flora 207 (3): 203-211.
[https://doi.org/10.1016/j.flora.2012.01.006]

-
Kraaijeveld, K., L. A. de Weger, M. V. García, H. Buermans, J. Frank, P. S. Hiemstra and J. T. den Dunnen. 2015. Effi- cient and sensitive identification and quantification of airborne pollen using next-generation DNA sequencing. Mol. Ecol. Resour. 15(1): 8-16.
[https://doi.org/10.1111/1755-0998.12288]

-
Mackenzie, G., A. N. Boa, A. Diego-Taboada, S. Atkin and T. Sathyapalan. 2015. Sporopollenin, the least known yet toughest natural biopolymer. Front. Mater. 2: 66.
[https://doi.org/10.3389/fmats.2015.00066]

-
Mamadalieva, N. Z., D. K. Akramov, E. Ovidi, A. Tiezzi, L. Nahar, S. S. Azimova and S. D. Sarker. 2017. Aromatic medi- cinal plants of the Lamiaceae family from Uzbekistan: ethnopharmacology, essential oils composition, and bio- logical activities. Medicines 4 (1): 8.
[https://doi.org/10.3390/medicines4010008]

-
Mejías, E. and G. Montenegro. 2012. The antioxidant activity of Chilean honey and bee pollen produced in the Llaima Volcano’s zones. J. Food Qual. 35(5): 315-322.
[https://doi.org/10.1111/j.1745-4557.2012.00460.x]

-
Mohamadzade Namin, S., M. J. Kim, M. Son and C. Jung. 2022a. Honey DNA metabarcoding revealed foreign resource partitioning between Korean native and introduced honey bees (Hymenoptera: Apidae). Sci. Rep. 12: 14394.
[https://doi.org/10.1038/s41598-022-18465-5]

- Mohamadzade Namin, S., M. Son and C. Jung. 2022b. Current methodologies in construction of plant-pollinator net- work with emphasize on the application of DNA meta- barcoding approach. J. Ecol. Environ. 64: 12.
-
Pornon, A., C. Andalo, M. Burrus and N. Escaravage. 2017. DNA metabarcoding data unveils invisible pollination networks. Sci. Rep. 7(1): 16828.
[https://doi.org/10.1038/s41598-017-16785-5]

-
Pospiech, M., Z. Javůrková, P. Hrabec, P. Štarha, S. Ljasovská, J. Bednář and B. Tremlová. 2021. Identification of pollen taxa by different microscopy techniques. PLoS One 16(9): e0256808.
[https://doi.org/10.1371/journal.pone.0256808]

- Rakhimova, N. K., E. E. Temirov, K. D. Mirzakarimova, A. T. Abdullaeva and B. Z. Tukhtaev. 2021. The study of morphological features of the pollen of some allergenic plants of the city of Tashkent (Uzbekistan). Annals of R.S.C.B. 25(6): 15163-15170.
-
Richardson, R. T., T. D. Eaton, C. H. Lin, G. Cherry, R. M. Johnson and D. B. Sponsler. 2021. Application of plant metabarcoding to identify diverse honeybee pollen forage along an urban-agricultural gradient. Mol. Ecol. 30(1): 310-323.
[https://doi.org/10.1111/mec.15704]

-
Soares, S., F. Rodrigues and C. Delerue-Matos. 2023. Towards DNA-based methods analysis for honey: an update. Molecules 28(5): 2106.
[https://doi.org/10.3390/molecules28052106]

-
Williams, N. M. and C. Kremen. 2007. Resource distributions among habitats determine solitary bee offspring produc- tion in a mosaic landscape. Ecol. Appl. 17(3): 910-921.
[https://doi.org/10.1890/06-0269]

-
Wu, L., M. Wu, N. Cui, L. Xiang, Y. Li, X. Li and S. Chen. 2021. Plant super-barcode: a case study on genome-based iden- tification for closely related species of Fritillaria. Chin. Med. 16: 1-11.
[https://doi.org/10.1186/s13020-021-00460-z]

