DNA 메타바코딩 기반 국내 아까시꿀의 식물상 분석
Abstract
Genetic diversity in honey can reflect the foraging activities of bees and the flora composition of their habitats, making them a valuable tool for honey authentication. Using ITS2 marker-based metabarcoding, we analyzed three domestic Robinia honey samples (XY, YKJ, ZHW) collected in 2024, and identified the 30 most abundant plant species in each. Our results revealed that certain plant species were exclusively identified in specific samples: nine species were restricted to XY and four species were unique to ZHW. Interestingly, no sample-specific plant species were found in YKJ. In contrast, 13 plant species were commonly identified across all three honey samples, while YKJ and ZHW shared 10 species. Notably, XY did not share any plant species with the other two samples, highlighting its distinct pollen composition. Additionally, the relative abundance of these plant species varied depending on the collection region. These findings suggest that DNA-based analysis could support the development of a regional pollen database, thereby contributing to the identification and differentiation of honey origins.
Keywords:
DNA metabarcoding, Robinia honey, ITS2서 론
꿀은 꿀벌이 생성하는 천연 감미료로, 주요 성분은 포도당과 과당이며, 단백질, 효소, 아미노산, 유기산, 미네랄, 비타민, 페놀 화합물, 항균 화합물 등 다양한 생리활성 물질을 포함하고 있다 (Brudzynski, 2021; Soares et al., 2023). 꿀샘 식물의 종류에 따라 향과 맛이 달라지며, 항염증, 항산화, 항균, 항암 효과 등의 생리활성을 나타낸다. 또한, 변비 완화, 식욕 증진, 위장 건강 개선과 같은 잠재적 효능도 보고된 바 있다 (Kek et al., 2017; Brudzynski, 2021; Pathiraja et al., 2023). 한편, 미국 식품 사기 데이터베이스 (Food Fraud Database)에 따르면 꿀은 식품 중 세 번째로 위조나 혼합 등의 부정 행위가 빈번한 품목으로 지목된다. 혼합꿀은 주로 세 가지 방식으로 생산되는데, 품질이 낮은 꿀이나 설탕물을 첨가하는 방법, 화분을 제거하거나 특정 화분을 첨가하여 출처를 혼동시키는 방식, 그리고 원산지를 감추기 위한 우회 수입 등이 이에 해당한다. 이러한 문제를 방지하기 위한 전통적 천연꿀 판별법으로 현미경을 이용한 화분 검사가 활용되어 왔다 (Bruni et al., 2015; Saravanan et al., 2019). 그러나 화분 함량이 낮거나 필터링 처리된 꿀에서는 정확한 판별이 어렵다는 한계가 있다. 이를 보완하기 위해 유도결합플라즈마질량분석법 (ICP-MS), 핵자기공명분광법 (NMR), 근적외선분광법 (NIR), 가스크로마토그래피 (GC) 등의 분석 기법이 도입되었으나, 고가의 장비와 숙련된 분석 기술이 필요하며 특이성이 제한적인 문제가 있다 (Chavan et al., 2022). 최근 차세대 염기서열 분석 (Next-Generation Sequencing, NGS)의 발전으로 대량의 유전자 데이터를 처리할 수 있게 되면서, DNA metabarcoding 기법을 활용한 꿀 원산지 판별 연구가 활발히 진행되고 있다 (Bruni et al., 2015; Laha et al., 2017; Saravanan et al., 2019; Namin et al., 2022; Soares et al., 2023). 꿀에 포함된 환경 DNA (eDNA)를 분석하면 특정 유전자의 바코드 서열을 증폭하여 바이러스, 박테리아, 곰팡이, 식물, 꿀벌 및 기타 곤충 종을 동정할 수 있다 (Bovo et al., 2018, 2020; Utzeri et al., 2018; Wirta et al., 2021). 다양한 연구에서 16S rRNA, trnL, rbcL, matK, trnH-psbA, ITS, ITS2, cytochrome c oxidase subunit I (COI) 등의 유전자를 대상으로 분석이 진행되었으며, 이를 활용한 꿀 성분 분석 결과가 보고된 바 있다 (Bruni et al., 2015; Laha et al., 2017; Saravanan et al., 2019; Chavan et al., 2022; Letsiou et al., 2024).
본 연구에서는 국내에서 생산된 아카시아꿀을 대상으로 ITS2 마커를 이용한 차세대 염기서열 분석을 수행하였다. 이를 통해 동정된 식물 종의 프로파일을 데이터베이스화하여 꿀의 생산지 인증 및 품질 관리 도구로서의 활용 가능성을 평가하고, 나아가 기후변화에 따른 양봉 산업의 생태학적 연구에 기여하고자 한다.
재료 및 방법
1. 시료
본 연구에서는 2024년에 채집된 국내산 아카시아꿀 3종 (XY, YKJ, ZHW)을 대상으로 DNA 메타바코딩 분석을 수행하였다.
2. 꿀 DNA 추출 방법
꿀 DNA는 Kim et al. (2021)의 방법을 변형하여 추출하였다. 먼저, 꿀 10 g에 5배 부피의 GI buffer를 첨가한 후 균질하게 혼합하였다. 이후 13,000 rpm에서 30분간 원심분리하여 화분 침전물을 분리한 뒤, Genomic DNA from Tissue Kit (Macherey-Nagel, Düren, Germany)를 이용하여 제조사 매뉴얼에 따라 DNA를 추출하였다. 또한, 상층액을 DNA affinity column에 통과시켜 잔류 DNA를 회수한 후, 화분 DNA와 합쳐 최종 분석에 활용하였다.
3. 라이브러리 준비 및 염기서열 분석
염기서열 분석을 위해 ITS2 영역을 증폭하는 Illumina 메타유전체 시퀀싱 라이브러리를 제작하였다. 꿀 DNA 5~10 ng을 이용하여 5× 반응 버퍼, 1 mM dNTP 혼합물, 500 nM의 tagF-ITS2-F (tcgtcggcagcgtcagatgtgtataagagacagATGCGATACTTGGTGTGAAT) 및 tagF-ITS2-R (gtctcgtgggctcgagatgtgtataagagacagTCCTCCGCTTATTGATATGC), Herculase II fusion DNA polymerase (Agilent Technologies, Santa Clara, CA)와 함께 PCR을 수행하였다. 1차 PCR 반응 조건은 95℃에서 3분간 초기 변성 후, 95℃에서 30초, 55℃에서 30초, 72℃에서 30초의 조건을 25회 반복하였으며, 최종적으로 72℃에서 5분간 반응을 진행하였다. 1차 PCR 산물은 AMPure 비드 (Agencourt Biosciences, Beverly, MA)를 이용하여 정제하였다. 이후 정제된 1차 PCR 산물 2 μL를 Nextera XT index Primer를 사용하여 2차 PCR을 수행하였다. 2차 PCR 반응 조건은 98℃에서 1분간 초기 변성 후, 98℃에서 15초, 55℃에서 15초, 72℃에서 30초의 조건을 10회 반복하였으며, 마지막으로 72℃에서 3분간 반응을 진행하였다. 최종 PCR 산물은 AMPure 비드를 이용해 정제하였으며, 정제된 시료는 KAPA Library Quantification Kit (for Illumina sequencing platforms)로 정량 후, TapeStation D1000 Screen Tape (Agilent Technologies, Waldbronn, Germany)을 이용해 분석한 뒤, MiSeq 플랫폼 (Illumina, San Diego, USA)에서 염기서열 분석을 수행하였다.
4. 데이터 분석
분석된 염기서열은 DADA2, Uchime, Filtering 과정을 거쳐 불필요한 서열을 제거한 후, 얻어진 ASV를 UNITE+INSD (Ver. 10.0) 데이터베이스와 BLAST를 이용해 분석하였다. 각 시료의 염기서열 다양성 분석을 위해 알파다양성 (Observed ASV, Shannon, Simpson)을 평가하였으며, 시료 간 군집 구조 차이를 평가하기 위해 weighted UniFrac 거리를 기반으로 베타다양성을 분석하였다.
결 과
1. 꿀 DNA 메타바코딩을 통한 식물 군집 동정
국산아카시아꿀 3종에서 추출된 DNA를 ITS2 마커로 분석한 결과, 총 53,516,596에서 82,588,982개 reads가 생성되었으며, 시료별로 카운트된 reads 수는 177,796에서 274,382였다. 이후 trimmomatic 프로그램을 이용하여 염기서열 품질을 정제한 결과, reads 수는 35,294,302에서 63,569,626으로 보정되었으며, 보정 후 시료별 카운트된 reads는 160,310에서 244,054였다 (Table 1). 최종적으로 분석에 사용된 Amplicon Sequence Variants (ASVs)의 평균 길이는 383 bp로 확인되었다.
2. 아카시아꿀에서의 식물 종 동정을 위한 DNA 메타바코딩
각 꿀 시료에서 증폭된 ASVs를 대상으로 DADA2, Uchime, Filter를 이용하여 불필요한 서열을 제거하였다. 그 결과, XY 시료에서 238개, YKJ 시료에서 85개, ZHW 시료에서 128개의 observed ASVs가 확인되어 시료 간 차이가 존재함을 보였다. Shannon entropy 및 Simpson 지수를 이용하여 시료 내 종 다양성을 평가한 결과, XY와 ZHW 시료는 유사한 값을 보였으나 YKJ 시료에서는 상대적으로 낮은 값이 나타났다 (Table 2).
3. 꿀 DNA 분석을 통한 식물 조성 확인
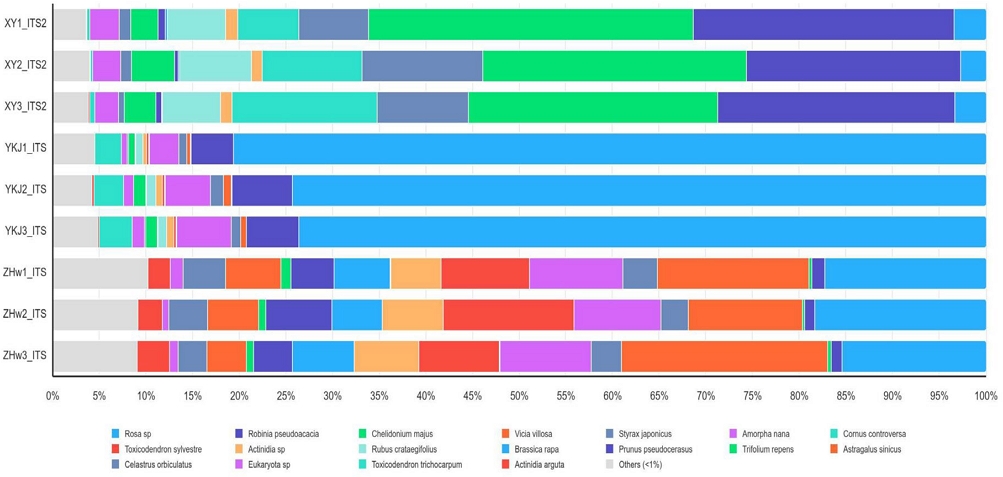
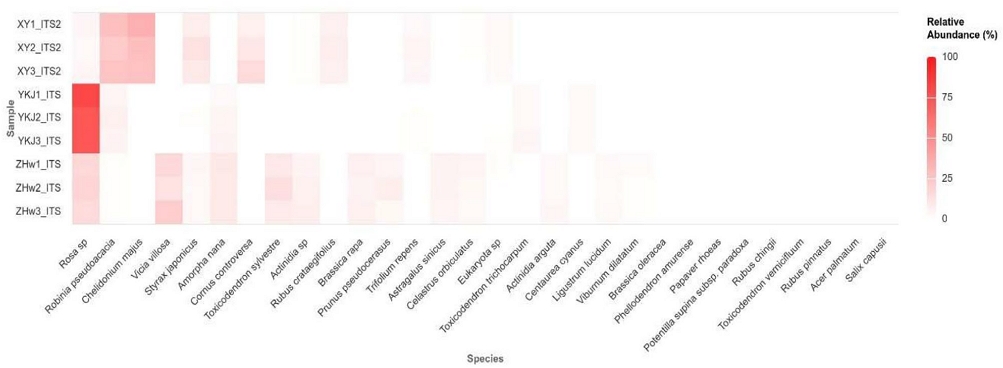
ITS2 마커를 기반으로 시료 내 식물 종을 분석한 결과, 상위 30개의 식물 종이 동정되었다. 개별 시료별로 살펴보면, XY 시료에서는 Chelidonium majus (29.9%)와 Robinia pseudoacacia (25.4%)가 주요 식물 종으로 확인되었으며, YKJ 시료에서는 Rosa sp. (74.1%)가 가장 높은 상대적 풍부도를 보였다. ZHW 시료에서는 Vicia villosa (16.8%)와 Rosa spp. (16.9%)가 유사한 비율로 검출되었다 (Figs. 1, 2).

Bar plot illustrating the relative abundance of the top 30 plant species. DNA extracted from acacia honey samples (n = 3) was amplified using the ITS2 marker and analyzed by NGS. The bar plot presents the relative abundance of the top 30 detected plant species. Each color represents a distinct plant species, and the relative abundance was determined based on the proportion of quality-filtered reads assigned to each taxon.

Heatmap of the top 30 plant species identified in Robinia honey samples. A heatmap was generated to display the relative abundance of the top 30 plant species detected in Robinia honey samples (n = 3) using the ITS2 marker. Columns represent individual plant species, and rows indicate technical replicates of the honey samples. The color intensity corresponds to the relative abundance of each species. Hierarchical clustering based on Bray-Curtis dissimilarity and Ward’s linkage method was applied to examine species composition patterns across samples.
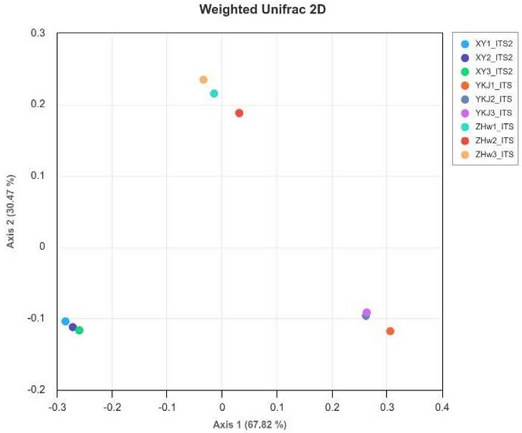
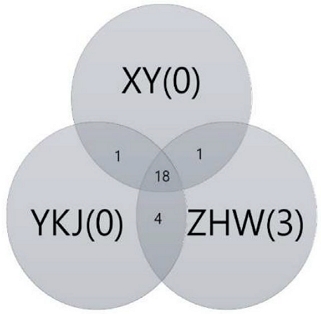
또한, 각 시료 간 식물 종 군집 구조의 차이를 평가하기 위해 weighted UniFrac distance를 이용하여 Principal Coordinates Analysis (PCoA) plot을 작성하였다. 분석 결과, 3개의 국내산 아카시아꿀 시료는 서로 다른 군집 구조를 보였다 (Fig. 3). XY와 YKJ 시료에서는 시료 특이적 식물 종이 발견되지 않았으나, ZHW 시료에서는 3개의 특정 식물 종이 동정되었다. 추가적으로, 모든 시료에서 공통적으로 동정된 식물 종은 18종이었으며, XY와 YKJ 시료에서만 존재하는 종은 1종, XY와 ZHW 시료에서만 확인된 종은 1종, YKJ와 ZHW 시료에서만 공통적으로 검출된 종은 4종이었다 (Fig. 4).

Principal coordinates analysis (PCoA) plot based on weighted UniFrac distances. PCoA was conducted to assess beta diversity among three types of Korean Robinia honey samples, using weighted UniFrac distances. Each point represents a technical replicate (n = 3), with distinct colors indicating different honey types. This analysis visualizes compositional differences among honey samples by incorporating phylogenetic relationships and relative abundances of plant taxa.

Venn diagram comparing plant species identified through ITS2 barcode analysis. A Venn diagram was used to compare the top 30 identified plant species among three Korean Robinia honey samples. Each circle represents a specific honey sample, with overlapping regions indicating shared taxa, while non-overlapping sections highlight species unique to a single sample. This visualization provides insights into the floral composition and diversity of Korean Robinia honey.
고 찰
벌꿀의 인증 방법은 크게 두 가지로 나뉜다. 첫째, 꿀에 포함된 화분을 전처리하여 형태적으로 분석하는 방법이며, 둘째, 꿀이 함유하고 있는 특정 화합물을 검출하는 화학적 분석법이다. 화분학을 기반으로 하는 형태적 분석은 다음과 같은 한계를 보인다. 첫째, 많은 식물 종과 변종을 명확히 구별하기 어렵고, 둘째, 바람이나 벌 (곤충 등)에 의한 화분 이동으로 인해 특정 화분의 존재만으로 해당 꿀이 특정 지역에서 생산되었다고 단정하기 어렵다. 셋째, 형태적 분석법은 숙련된 분석가의 경험과 주관적 판단에 크게 의존하는 특성이 있다 (Bruni et al., 2015; Chaven et al., 2022; Pathiraja et al., 2023; Letsiou et al., 2024). 또한, 꿀의 화학적 분석은 생산 지역의 기후, 토양 조건, 가공 및 저장 방식에 영향을 받을 수 있으며, 경우에 따라 혼입물 검출이 어렵다 (Saravanan et al., 2019). 특히, 혼입된 물질이 꿀에 자연적으로 존재하는 화합물과 유사할 경우 이를 감별하기 위해서는 고도의 분석 기법이 요구된다 (Chaven et al., 2022). 이러한 문제를 보완하기 위해 유전자를 활용한 DNA 메타바코딩 분석이 도입되었으며, 다양한 식품 원산지 판별 연구에서 유용성이 입증되었다 (Miller, 2007; Nehal et al., 2021; Smith et al., 2021; Dawan and Ahn, 2022; Milla et al., 2023; Lanubile et al., 2024). 최근 들어 이러한 기법이 꿀의 인증 및 원산지 분석에도 성공적으로 적용되고 있다. 현재 DNA 메타바코딩 분석에 활용되는 주요 유전자로는 16S rRNA, trnL, rbcL, matK, trnH-psbA, ITS, ITS2, cytochrome c oxidase subunit I (COI) 등이 있으며, 꿀에 대한 연구에서도 이들 유전자가 활용된 사례가 보고되었다 (Bruni et al., 2015; Laha et al., 2017; Saravanan et al., 2019; Chavan et al., 2022; Letsiou et al., 2024). 본 연구에서는 이들 마커 중 ITS2를 대상으로 실험을 수행하였다. 분석 결과, XY 시료에서는 Robinia pseudoacacia (아까시나무) 유전자의 풍부도가 25.4%로 높았으며, YKJ 시료에서는 Rose spp. (장미속) 유전자가 74%의 풍부도를 보였다. 또한 ZHW 시료에서는 Rose spp. (장미속)가 16.9%, Vicia villosa (베지, Hairy vetch) 유전자가 16.8%로 검출되었으며, 동일한 아카시아꿀이지만 시료별로 포함된 식물 종 구성이 상이함을 확인할 수 있었다 (Figs. 1, 2). 추가적으로, ZHW 시료에서는 분석을 통해 상위 30종의 식물 중 27종이 동정되었고, XY 및 YKJ 시료에서는 각각 23종이 동정되었다. 메타바코딩분석을 통해 얻은 결과를 토대로 한 종의 다양성은 Shannon entropy와 Simpson 지수로 나타낸다 (Nagendra, 2002). Shannon entropy 값은 상대적 지표로 높을수록 다양성이 크고 낮을수록 다양성이 적다는 해석이 가능한데 XY는 4.71±0.29, YKJ는 2.36±0.26, ZHW는 4.96±0.14로 나타나 이들 사이에서 ZHW에서 종 다양성이 높음을 알 수 있었고 반면 YKJ는 XY와 ZHW보다 낮은 다양성을 나타냈다. 또한 종의 다양성을 나타내는 다른 지표인 Simpson 지수는 종의 우점도를 중심으로 보는 개념으로 값이 클수록 특정 종이 우세함을 나타내는 지수로 알려져 있다. Simpson 지수로 다양성을 보았을 때 ZHW (0.93±0.01)와 XY (0.89±0.03)는 종의 수가 많고 종들이 상대적으로 균등하게 분포한다고 할 수 있으나 YKJ (0.50±0.06)는 우점종이 있고 다른 종도 일부 존재함을 알 수 있었다 (Table 2). 특히, ZHW 시료에서만 동정된 3종의 식물 종은 해당 시료의 생산 배경을 특정할 수 있는 마커 후보로 활용될 가능성을 보였다. 본 연구를 통해 DNA 분석을 활용한 꿀 인증 방법이 기존의 분석법과 상호보완적으로 적용될 수 있음을 확인하였으나, 신뢰도를 높이기 위해서는 보다 많은 꿀 시료와 다양한 참조 유전자 데이터 확보가 필요함을 알 수 있었다. 앞으로 지속적인 유전자 기반 분석을 통해 동정된 식물 종의 데이터베이스를 구축하고, 이를 기존의 화분학적 및 화학적 분석법과 병행하여 활용함으로써, 꿀의 이력 추적 및 원산지 구별을 위한 품질 관리 도구로 이용될 수 있을 것으로 판단된다. 이처럼 DNA 바코딩을 활용하여 얻은 식물종 기원 분석결과는 꿀벌의 채집 선호도와 지역별 식물 다양성을 파악할 수 있어 지역 생태계 관리와 밀원수 조성에 유용한 정보를 제공하는 결과가 보고되고 있다 (Lucek et al., 2019; Jone et al., 2021; Milla, et al., 2021; Woodcock et al., 2022; Ullah et al., 2024). 이에 우리나라에서도 기후변화가 양봉 산업에 미치는 영향을 평가하는 생태학적 연구에도 기여할 수 있을 것으로 기대된다.
Acknowledgments
본 연구는 국립농업과학원 농업과학기반기술연구 (과제번호: PJ01745703)에 의하여 수행되었습니다.
References
-
Bovo, S., A. Ribani, V. J. Utzeri, G. Schiavo, F. Bertolini and L. Fontanesi. 2018. Shotgun metagenomics of honey DNA: Evalutation of a methodological approach to describe a multi-kingdom honey bee derived environmental DNA signature. PLoS One 13: e0205575.
[https://doi.org/10.1371/journal.pone.0205575]

-
Bovo, S., V. J. Utzeri, A. Ribani, R. Cabbri and L. Fontanesi. 2020. Shotgun sequencing of honey DNA can describe honey bee derived environmental signatures and the honey bee hologenome complexity. Sci. Rep. 10: 9279.
[https://doi.org/10.1038/s41598-020-66127-1]

-
Bruni, I., A. Galiberti, L. Caridi, D. Scaccabarozzi, F. De Mattia, M. Casiraghi and M. Labra. 2015. A DNA barcoding approach to identify plant species in multiflower honey. Food Chem. 170: 308-315.
[https://doi.org/10.1016/j.foodchem.2014.08.060]

-
Brudzynski, K. 2021. Honey as an ecological reservoir of antibacterial compounds produced by antagonistic microbial interactions in plant nectars, honey and honey bee. Antibiotics 10: 551.
[https://doi.org/10.3390/antibiotics10050551]

-
Chavan, D., J. R. T. Adolacion, M. Crum, S. Nandy, K. H. Lee, B. Vu, K. Kourentzi, A. Sabo and R. C. Willson. 2022. Isolation and barcoding of trace pollen-free DNA for authentication of honey. J. Agric. Food Chem. 70: 14084-14095.
[https://doi.org/10.1021/acs.jafc.2c04309]

-
Dawan, J. and J. Ahn. 2022. Application of DNA barcoding for ensuring food safety and quality. Food Sci. Biotechnol. 31: 1355-1364.
[https://doi.org/10.1007/s10068-022-01143-7]

-
Jones, L., G. L. Brennan, A. Lowe, S. Creer, C. R. Ford and N. de Vere. 2021. Shifts in honeybee foraging reveal historical changes in floral resources. Commsbio 4: 37.
[https://doi.org/10.1038/s42003-020-01562-4]

-
Kek, S. P., N. L. Chin, S. W. Tan, Y. A. Yusof and L. S. Chua. 2017. Molecular identification of honey entomological origin based on bee mitochondrial 16S rRNA and COI gene sequences. Food Control 78: 150-159.
[https://doi.org/10.1016/j.foodcont.2017.02.025]

-
Kim, S., S. G. Kim, S. M. Han and B. Yoon. 2021. Optimization of practical protocol for residual DNA from honey. J. Apic. 36: 195-206.
[https://doi.org/10.17519/apiculture.2021.09.36.3.195]

-
Laha, R. C., S. D. Mandal, L. Ralte, L. Ralte, N. S. Kumar, G. Gurusubramanian, R. Satisshkumar, R. Mugasimangalam and N. A. Kuravadi. 2017. Meta-barcoding in combination with palynological inference is a potent diagnostic marker for honey floral composition. AMB Expr. 7: 132.
[https://doi.org/10.1186/s13568-017-0429-7]

-
Lanubile, A. L. Stagnati, A. Marocco and M. Busconi. 2024. DNA-based techniques to check quality and authenticity of food, feed and medicinal products of plant origin: A review. Trends Food Sci. Technol. 149: 104568.
[https://doi.org/10.1016/j.tifs.2024.104568]

-
Letsiou, S., P. Madesis, E. Vasdekis, C. Montemurro, M. E. Grigoriou, G. Skavdis, V. Moussis, A. E. Koutelidakis and A. G. Tzakos. 2024. DNA barcoding as a plant identification method. Appl. Sci. 14: 1415.
[https://doi.org/10.3390/app14041415]

-
Lucek, K., A. Galli, S. Gurten, N. Hohmann, A. Maccagni, T. Patsiou and Y. Willi. 2019. Metabarcoding of honey to assess differences in plant-pollinator interactions between urban and non-urban sites. Apidologie 50:317-329.
[https://doi.org/10.1007/s13592-019-00646-3]

-
Miller, S. 2007. DNA barcoding and the renaissance of taxonomy. Proc. Natl. Acad. Sci. U.S.A. 140: 4775-4776.
[https://doi.org/10.1073/pnas.0700466104]

-
Milla, L., K. Sniderman, R. Lines and M. Mousavi-Derazmahalleh. 2021. Pollen DNA metabarcoding identifies regional provenance and high plant diversity in Australian honey. Ecol. Evol. 11: 8683-8698.
[https://doi.org/10.1002/ece3.7679]

-
Milla, L., A. Schmidt-Lebuhn, J. Bovill and F. Encinas-Viso. 2023. Monitoring of honey bee floral resources with pollen DNA metabarcoding as a complementary tool to vegetation surveys. Ecol. Solut. Evid. 3: e12120.
[https://doi.org/10.1002/2688-8319.12120]

-
Nagendra, H. 2002. Opposite trends in response for the Shannon and Simpson indices of landscape diversity. Applied Geography 22: 175-186.
[https://doi.org/10.1016/S0143-6228(02)00002-4]

-
Namin, S. M., M. J. Kim, M. Son and C. Jung. 2022. Honey DNA metabarcoding revealed foraging resource partitioning between Korean native and introduced honey bees (Hymenoptera: Apidae). Sci. Rep. 12: 14394.
[https://doi.org/10.1038/s41598-022-18465-5]

-
Nehal, N., B. Choudhary, A. Nagpure and R. K. Gupta. 2021. DNA barcoding: a modern age tool for detection of adulteration in food. Crit. Rev. Biotechnol. 41: 767-791.
[https://doi.org/10.1080/07388551.2021.1874279]

-
Pathiraja, D., J. Cho, J. Kim and I. G. Choi. 2023. Metabarcoding of eDNA for tracking the floral and geographical origins of bee honey. Food Res. Int. 164: 112413.
[https://doi.org/10.1016/j.foodres.2022.112413]

-
Saravanan M., G. Mohanapriya, R. Laha and R. Sathishkumar. 2019. DNA barcoding detects floral origin of Indian honey samples. Genome 62: 341-348.
[https://doi.org/10.1139/gen-2018-0058]

-
Smith, C., N. Cokcetin, T. Truong, E. Harry, G. Hutvagner and S. Bajan. 2021. Cataloguing the small RNA contnt of honey using next generation sequencing. Food Chem. Mol. Sci. 2: 100014.
[https://doi.org/10.1016/j.fochms.2021.100014]

-
Soares, S., F. Rodrigues and C. Delerue-Matos. 2023. Towards DNA-based methods analysis for honey: An update. Molecules 28: 2106.
[https://doi.org/10.3390/molecules28052106]

-
Ullah, S., F. Huyop, R. Abdul Wahab, I. G. Arya Sujana, N. S. Antara and I. B. W Gunam. 2024. Using pollen DNA metabarcoding to trace the geographical and botanical origin of honey from Karangasem, Indonesia. Heliyon 10: e33094
[https://doi.org/10.1016/j.heliyon.2024.e33094]

-
Utzeri, V. J., A. Ribani, G. Schiavo and F. Bertolini. 2018. Application of next generation semiconductor based sequencing to detect the botanical composition of monofloral, polyfloral and honeydew honey. Food Control 86: 342-349.
[https://doi.org/10.1016/j.foodcont.2017.11.033]

-
Wirta, H., N. Abrego, K. Miller, T. Roslin and E. Vesterinen. 2021. DNA traces the origin of honey by identifying plants, bacteria and fungi. Sci. Rep. 11: 4798.
[https://doi.org/10.1038/s41598-021-84174-0]

-
Woodcock, B. A., A. E. Oliver, L. K. Newbold, H. S. Gweon, D. S. Read, U. Sayed, J. Savage, J. Bacon, E. Upcott, K. Howell, K. Turvey, D. B. Roy, M. G. Pereira, D. Sleep, A. Greenop and R. F. Pywell. 2022. Citizen science monitoring reveals links between honeybee health, pesticide exposure and seasonal availability of floral resources. Sci. Rep. 12:14331.
[https://doi.org/10.1038/s41598-022-1867-0]

