Development of a Smart Beehive System with Integrated In-Hive Environmental Control and Deep-Learning-based Image Recognition
Abstract
A smart beehive system integrating environmental control and image recognition was developed for real-time and automated monitoring of bee colony activity. The system continuously measured temperature, humidity, CO2 concentration, and feed weight, and automatically activated a heater (winter mode) or fan (summer mode) according to preset thermal thresholds. An RGB camera installed above the hive entrance captured bee traffic, and a MobileNetV2-based deep-learning algorithm quantified incoming and outgoing bees. Two detection algorithms were compared: Algorithm 1 (three-zone model) and Algorithm 2 (four-zone model with a boundary zone for hovering correction). Experimental validation was conducted in greenhouse environments during summer and winter. The environmental control algorithm maintained internal temperature within ±2-3°C, demonstrating stable heater and fan operation. Fan activation significantly reduced CO2 concentration (1,281 ppm→758 ppm, p<0.01), indicating effective ventilation. Algorithm 2 achieved higher detection accuracy than Algorithm 1 for in-, out-, and total-counts (71.2±36.2%, 75.0±27.0%, and 73.1±31.5%; p<0.001). Detection accuracy was greater for Bombus terrestris than for Apis mellifera due to differences in body size and hive-entrance structure. The developed system automatically stabilized the hive microenvironment while quantifying bee activity with high accuracy. These findings provide a technological basis for integrating environmental regulation and behavioral monitoring in managed pollinator systems and contribute to the development of precision apiculture and sustainable pollination management.
Keywords:
Smart beehive system, In-hive environmental control, Image-based bee monitoring, Deep learning, pollinatorINTRODUCTION
Insect pollinators play a pivotal role in improving both the yield and quality of agricultural crops. Among them, the honeybee (Apis mellifera) and the bumblebee (Bombus terrestris) are the most widely used species for commercial pollination (Velthuis and van Doorn, 2006; Klein et al., 2007). These pollinators contribute to the pollination of major horticultural crops such as watermelon, strawberry, and tomato, and approximately 35% of global food production depends on insect-mediated pollination (Gallai et al., 2009). However, multiple environmental stressors-including climate change, pesticide exposure, pathogen outbreaks, and habitat fragmentation-have led to colony weakening and decreased activity of managed pollinators worldwide (Owen, 2017; Abou-Shaara, 2019). Such declines not only represent physiological stress at the individual level but also directly reduce pollination efficiency and honey yield, ultimately impacting overall agricultural productivity (Goodrich et al., 2019; Hristov et al., 2020).
Thermal and humidity imbalances within the hive can disrupt brood development and reproduction, and thermal regulation failure is one of the major factors leading to colony collapse (Sudarsan et al., 2012). In greenhouse and enclosed-cultivation systems, bees exhibit reduced adaptability to external climatic changes. Because the internal temperature, humidity, and nutritional status of a hive directly affect the queen’s oviposition and worker survival, precise environmental control is essential for stable colony management (Meikle and Holst, 2015). Nevertheless, beekeeping practices still largely depend on empirical inspection and manual hive opening, which provide only fragmentary information about the internal status of a colony. This makes it difficult to monitor real-time changes in colony condition or activity quantitatively (Cecchi et al., 2020; Cook et al., 2022; Alleri et al., 2023). Consequently, early detection of colony stress remains limited, increasing the risk of temperature, humidity, and ventilation stress that can destabilize the colony (Meikle and Holst, 2015; Abou-Shaara, 2016; Switanek et al., 2017).
Most current smart beekeeping technologies focus on monitoring rather than control, using sensors for temperature and humidity (Cecchi et al., 2020; Alleri et al., 2023; Kviesis et al., 2023), hive weight and CO2 concentration (Bencsik et al., 2023), or tracking hive movement via GPS and IoT communication (Tashakkori et al., 2021; Lee et al., 2023). Although these sensor-based systems effectively collect environmental and physiological data, they rarely extend to active environmental regulation or colony productivity improvement.
Recently, image recognition and artificial intelligence (AI) technologies have been increasingly applied to automatically analyze bee foraging activity, flight velocity, and movement trajectories (Boenisch et al., 2018; Lee et al., 2020, 2022; Sun and Gaydecki, 2021). Deep-learning-based vision models can identify and track individual bees, providing a proxy measure for colony vitality. However, most of these studies have focused solely on algorithmic performance and have not integrated actual environmental control functions, such as temperature or ventilation regulation (Kulyukin and Mukherjee, 2019). More recently, Penaloza-Aponte et al. (2024) developed an automated entrance-monitoring module capable of continuously recording forager traffic through a custom hive entrance. While such systems demonstrate the growing feasibility of long-term automated behavioral monitoring, they remain limited to traffic observation and do not integrate environmental control or multi-sensor colony assessment.
In this study, we developed a smart beehive system that integrates a deep-learning-based image recognition module with a multi-sensor environmental control platform. The system continuously measures internal temperature, humidity, CO2 concentration, and feed weight, and automatically regulates a heater or fan according to predefined seasonal thresholds to maintain optimal hive conditions. In addition, entrance videos captured by an RGB camera are analyzed through a MobileNetV2-based detection algorithm to quantify bee traffic activity in real time. Two detection algorithms (Algorithm 1 and Algorithm 2) were proposed and compared to evaluate recognition performance, and the impact of GPU acceleration on detection efficiency and frame rate was analyzed. The developed system aims to provide a foundational technology for integrating environmental control and behavioral monitoring, enabling stable colony management and advancing smart apiculture applications.
MATERIALS AND METHODS
1. System architecture
The developed smart beehive system was designed as an integrated control platform based on a single-board computer(SBC, Raspberry Pi 4B). The system consists of four functional modules: environmental sensing, environmental control, image recognition, and data communication (Fig. 1). The internal and external temperatures, humidity, CO2 concentration, and feed weight were measured in real time. According to seasonal settings, the system automatically activated a heater (winter mode) or a fan (summer mode) to maintain the internal temperature within the optimal range for colony stability. An RGB camera was installed above the hive entrance to record bee activity, and a deep-learning model embedded in the SBC analyzed these images to quantify colony activity. The major components and specifications of the system are summarized in Table 1.

Layout of the hardware configuration of the smart beehive system.

Main hardware components and specifications of the smart beehive system
2. Hardware configuration
A Raspberry Pi 4B (4 GB RAM) served as the central processing and control unit. Internal temperature and humidity were measured using an SHT30 sensor (accuracy±0.2℃, ±2% RH), while external conditions were monitored by a DHT22 sensor (accuracy±0.5℃, ±2% RH). CO2 concentration was measured using a non-dispersive infrared (NDIR) CM1107 sensor (0-5,000 ppm, ±50 ppm), and feed weight was measured with a 5 kg load cell (CZL635, ±2.5 g). The environmental control module consisted of two 5 V 1 W fans and one 5 V 10 W heater operated via a 5 V four-channel relay module. Time synchronization was maintained by a DS3231 RTC module, and data were transmitted to a remote server using Wi-Fi communication. All components were powered by a DC 5 V 4 A adapter.
3. Environmental sensing and control algorithm
The environmental sensing and control algorithm was designed to operate in two seasonal modes-winter (heater control) and summer (fan control)-based on the internal temperature (Tin) (Fig. 2).

Temperature control algorithms for summer(fan control) and winter(heater control) modes in the smart beehive system. (A) In summer mode, the fan is activated when the internal temperature (Tin) exceeds the preset temperature (Tset) and deactivated when it drops below the threshold. (B) In winter mode, the heater is activated when Tin falls below Tset and turns off when the temperature rises above the threshold. Both modes include an adaptive loop for updating Tset according to environmental changes.
- •Winter mode (heater control):
Heater ON when Tin<Tset for >5 s;
Heater OFF when Tin≥(Tset+1℃) for >5 s. - •Summer mode (fan control):
Fan ON when Tin≥Tset for >5 s;
Fan OFF when Tin≤(Tset-1℃) for >5 s.
External temperature was used as a correction variable to prevent over-cooling during sudden external fluctuations. When relative humidity changed abruptly (>10% RH within 10 s), the control loop temporarily prioritized temperature regulation to prevent condensation. CO2 concentration was recorded as a reference indicator of colony respiration and ventilation state. Feed-weight data were collected at 1 Hz and smoothed using a 10-s moving average, with outliers outside±3σ excluded.
4. Image data acquisition and training
The RGB camera was fixed 20 cm above the hive entrance and recorded at a resolution of 1,280×720 px with a frame rate of 25-30 FPS. From the recorded videos, frames in which the shapes of bees were clearly distinguishable were extracted and used as training data. The target species were the honeybee (Apis mellifera) and the bumblebee (Bombus terrestris), and the image data were labeled into three classes: Bee (honeybee), Dbee (bumblebee), and Gate (entrance). The "Gate" class was added to prevent background misrecognition. In addition, to ensure that non-target objects similar to the target were not incorrectly recognized, additional environmental images from actual field conditions were collected and separately labeled as "negative images" (Table 2).
Composition and characteristics of training images for bee-shape data
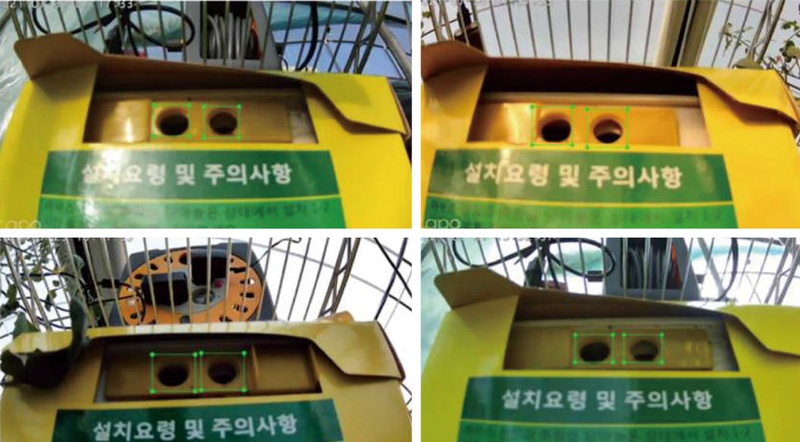
Data augmentation included rotation (-10°, 0°, +10°) and scaling (1.0, 0.7). From 1,534 honeybee and 1,137 bumblebee images, a total of 16,026 augmented images were generated. Label coordinates were recalculated automatically during augmentation to maintain positional accuracy (Fig. 3). The MobileNetV2 network based on the TensorFlow Object Detection API was used for training. A transfer learning approach was applied using pretrained weights from the COCO dataset. The batch size was set to 24, and the number of epochs was optimized within the range of 7,000-12,000. The trained model was deployed in the SBC environment and applied for real-time image recognition (Fig. 4).

Example of image preprocessing and data augmentation for deep-learning training.

Architecture of the MobileNetV2 network used for object recognition.
5. Bee activity detection algorithm
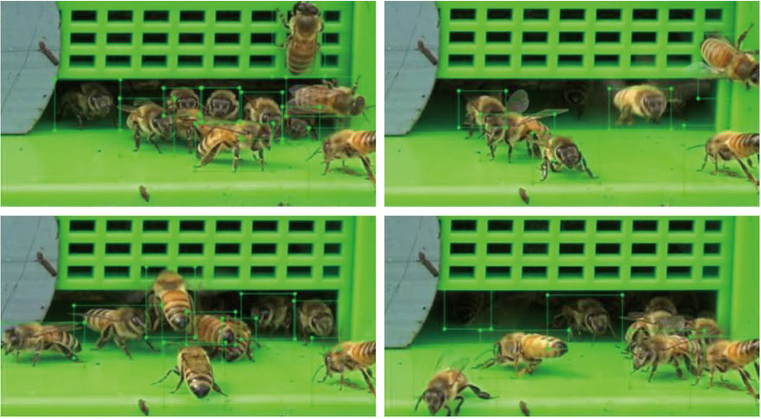
Bee activity was detected using the method of Lee et al. (2020), in which the video frames around the hive entrance were divided into three regions: A (whole area), B (inner entrance), and C (outer entrance). The directional movement of bees was determined by analyzing the changes in the number of detected bees between consecutive frames (ΔA, ΔB, ΔC) (Algorithm 1; Table 3). To correct for hovering and round-trip flights, an additional outer D zone was added to construct an improved algorithm(Algorithm 2; Table 3).
Detailed structure of bee activity detection algorithms(Algorithm 1 and Algorithm 2)
The interval between frames was set based on a 25 FPS environment. According to the high-speed camera (240 FPS) analysis reported by Lee et al. (2022), the average flight speed of honeybees was 0.10 m per 0.21 s. Accordingly, the camera’s field of view and magnification were adjusted to achieve an approximate movement resolution of 3 cm.
6. Performance evaluation
To verify the operating characteristics of the environmental control algorithm, experimental trials were conducted under distinct seasonal conditions—summer (fan control) and winter (heater control). The summer mode (fan control) experiment was carried out from June 15 to June 26, 2023, in an onion cultivation greenhouse located in Haenam-gun, Jeollanam-do, Korea (34°35ʹ39ʺN, 126°39ʹ46ʺE).
In this mode, the fan was programmed to activate when the internal temperature (Tin) exceeded 32℃ and to stop when it dropped below 32℃. A single bumblebee (Bombus terrestris) colony, consisting of one queen and 100 workers, was placed in the smart hive for observation. The winter mode (heater control) experiment was conducted from January 7 to February 2, 2024, in a strawberry cultivation greenhouse located in Noseong-myeon, Nonsan-si, Chungcheongnam-do, Korea (36°16ʹ33ʺN, 127°06ʹ14ʺE). In this mode, the heater was activated when Tin dropped below 25℃ and turned off when the temperature rose above 30℃.
A single honeybee (Apis mellifera) hive, composed of one queen, four combs, and approximately 7,500 workers, was used for the test. Once installed inside each greenhouse, the smart hive automatically recorded data on internal and external temperature, humidity, CO2 concentration, and feed weight at one-minute intervals. The collected data were transmitted to a remote server via Wi-Fi communication.
After the experimental period, the raw data stored on the server were downloaded in CSV format and analyzed using Microsoft Excel 2021. The analysis included the temporal variation of temperature, the corresponding control signals (heater or fan activation), and the mean temperature with its deviation. Based on these datasets, the temperature stabilization characteristics and control response performance were compared between the winter and summer modes.
In this study, the performance of the image recognition-based bee activity detection algorithm integrated into the smart beehive system was quantitatively verified by evaluating its detection accuracy for incoming and outgoing bees.
The experiment was conducted on September 30, 2023, at the Insect Rearing Facility of the National Institute of Agricultural Sciences (Jeonju, Korea; 35°49ʹ43ʺN, 127°02ʹ33ʺE). Tests were performed under both indoor and outdoor conditions, using two species: the bumblebee (Bombus terrestris) and the honeybee (Apis mellifera). The indoor bumblebee experiment (Environment 1) was carried out in a rearing room measuring 6.6×6.6 m. A mesh cage (2×2×2 m, mesh size 2 mm) was installed to confine the flight area. Illumination was maintained at approximately 1,000 lux, with the temperature set at 26℃ and relative humidity at 50%. Approximately 80 bumblebees from the 22nd generation colony, maintained at the institute, were used. The outdoor bumblebee experiment (Environment 2) was performed in an open space outside the same building at 11:00 a.m. under natural light conditions (approx. 30,000 lux). The ambient temperature was 23℃ and relative humidity 45%. The same 22nd-generation bumblebee colony (approximately 80 individuals) was used. The outdoor honeybee experiment (Environment 3) was conducted at the same location and time (11:00 a.m.) under equivalent environmental conditions (approx. 30,000 lux, 23℃, 45% RH). A honeybee hive (A. mellifera) purchased from a commercial apiary was used, consisting of about 1,500 worker bees and two combs.
All experiments were conducted using the same smart beehive system and image recognition device. The RGB camera was configured at a resolution of 1,280×720 pixels and a frame rate of 25-30 FPS. For each environment, the RGB camera installed above the hive entrance recorded bee traffic for one minute, while an observer manually counted the number of incoming and outgoing bees at the same time. The automatically detected counts from the system were then compared with the observed counts. Each experiment was repeated five times, and the average of the repeated measurements was used to evaluate the detection accuracy of the algorithms.
Detection accuracy was calculated based on the absolute difference between the observed and predicted counts, according to the following formula:
Where Npredicted is the number of bee movements (entries or exits) automatically detected by the system, and Nactual is the number manually counted by the observer.
When the predicted and actual counts were identical, the accuracy was 100%; as the difference increased, accuracy decreased proportionally. If the observed count was zero while the system recorded a positive value (i.e., false detection), accuracy was assigned as 0% and the error rate as 100%. In cases where the error rate exceeded 100% (i.e., the predicted value was more than double the actual count), the detection result was considered unreliable, and the accuracy was set to 0%.
As a supplementary metric, the error rate (Error%) was calculated as follows:
The relationship between the two indices is given by:
The evaluation was performed in two stages. First, the detection accuracies of algorithm 1 and algorithm 2 were compared directly to assess the effect of algorithmic structure on performance. Second, using the algorithm that showed higher accuracy, detection accuracies were further compared among three environments: indoor B. terrestris, outdoor B. terrestris, and outdoor A. mellifera.
All experimental data were tested for normality using the Shapiro-Wilk test. When the data satisfied the assumption of normality, statistical comparisons were performed using the paired t-test, independent t-test, or one-way ANOVA as appropriate. For non-normally distributed data, the Wilcoxon signed-rank test, Mann-Whitney U test, or Kruskal-Wallis test was applied. For ANOVA results, Tukey’s HSD test was used for post hoc analysis. The significance level (α) for all statistical tests was set at 0.05. Results were expressed as mean±standard deviation (SD), and differences were considered statistically significant when p<0.05. All statistical analyses were conducted using SPSS v.22.0 (IBM Corp., Armonk, NY, USA).
RESULTS AND DISCUSSION
1. System implementation and operation validation
The smart beehive system was constructed according to the proposed design, integrating sensor, control, communication, and image recognition modules centered around the SBC (Raspberry Pi 4B). Inside the hive, temperature and humidity sensors (SHT30), a CO2 sensor (CM1107), and a load cell (CZL635) were installed, while an external temperature-humidity sensor (DHT22) and a fan were mounted outside. The heater and fan were operated via a 5 V relay module controlled by the SBC. Real-time measurement data—including temperature, humidity, CO2 concentration, and feed weight—were simultaneously displayed on the SBC monitor and stored in the server database (Fig. 5). All sensors operated properly, and the measured values were displayed in real time. In the system operation test, the outputs of each sensor remained stable: the temperature sensor deviation was within ±0.2℃, humidity within ±1.5% RH, CO2 sensor noise within ±50 ppm, and load cell fluctuation within ±2 g. Data were recorded at one-minute intervals, and no communication error or data loss occurred during continuous operation for more than five minutes. In the control module test, the heater automatically activated when temperature decreased and stopped when it increased, while the fan operated automatically under elevated external temperature, maintaining internal temperature within a stable range (Fig. 6). These results confirm that the hardware and control system of the smart beehive operated as intended and that all components functioned in a synchronized and stable manner. This integration of environmental sensing and image-based activity monitoring is particularly relevant because internal temperature and ventilation directly influence brood thermoregulation and overall colony stability (Sudarsan et al., 2012; Meikle and Holst, 2015). Continuous, non-invasive monitoring reduces the need for frequent hive opening and allows beekeepers to detect abnormal changes earlier than with conventional manual inspections(Meikle and Holst, 2015), thereby supporting more stable colony management.

External appearance and internal structure of the fabricated smart beehive system. (A) Overall configuration, (B) System interface, (C) Integrated system view.

Example of the graphical user interface (GUI) for the smart beehive. (A) On-device control panel, (B) Smartphone application screen displaying data received from the server.
2. Validation of environmental control algorithm
To verify whether the environmental control algorithm of the smart beehive operated properly according to the preset temperature conditions, experiments were conducted by dividing the system into winter mode (heater control) and Summer mode (fan control). Data were collected at one-minute intervals, and the internal temperature (Tin), external temperature (Tout), relative humidity, CO2 concentration, and control signal status (Heater or Fan) were recorded simultaneously. In winter mode, the control condition was set so that the heater was activated when the internal temperature fell below 25℃ and turned off when it exceeded 30℃. The results showed that the internal temperature repeatedly increased and decreased according to the preset threshold, and a rapid temperature rise occurred during heater operation (Fig. 7). In particular, the frequency of heater activation significantly increased during the early morning (06:00-09:00) and nighttime (after 20:00) when the ambient temperature was lowest, and after 20:00, the heater tended to remain on continuously. After the heater was turned on, the internal temperature reached 30℃ within approximately four minutes, and then gradually decreased, maintaining a stable range of 27.9±1.9℃ on average (Table 4). According to the analysis of control states shown in Table 5, the mean internal temperature during heater operation was 27.4±1.7℃, while that during heater-off periods was 30.3±0.3℃, indicating that the control algorithm maintained thermal stability within ±2℃. These results demonstrate that the algorithm accurately functioned according to the temperature settings and effectively stabilized the internal thermal conditions. Maintaining this narrow thermal range is critical, as even small temperature fluctuations can impair brood development and colony metabolism (Sudarsan et al., 2012; Switanek et al., 2017). The smart hive effectively minimizes this risk by stabilizing internal temperature within ±2℃.

Internal temperature and heater activation pattern of the smart beehive during winter mode. The blue line represents the internal temperature (Tin), and the orange bars indicate heater activation periods(status=1). The heater was automatically turned on when Tin≤25℃ and turned off when it exceeded 30℃.
Field operating conditions of the smart beehive system under summer(fan control) and winter(heater control) modes
Performance comparison of the internal environmental control algorithm in the smart beehive
In summer mode, the control condition was set so that the fan was activated when the internal temperature exceeded 32℃ and stopped when it dropped below 32℃. The results showed that when the internal temperature exceeded 32℃, the fan immediately operated, and the internal temperature rapidly decreased during fan operation (Fig. 8). Fan operation was most frequent between 14:00 and 16:00, corresponding to the period when the greenhouse temperature reached its daily maximum, reflecting the immediate response of the control algorithm to ambient thermal changes. As a result of repeated cooling cycles, the internal temperature was maintained within an average range of 28.7±2.6℃, and the mean internal temperature during fan operation was measured at 32.1℃. Although this value was slightly higher than the external temperature (mean 25.0℃), the system maintained the temperature within the optimal range (approximately 28-32℃) suitable for colony activity.

Internal temperature and fan activation pattern of the smart beehive during summer mode. The blue line represents the internal temperature (Tin), and the orange bars indicate fan activation periods(status=1). The fan operated when Tin≥32℃ and stopped when the temperature dropped below 32℃.
In the summary of control performance (Table 5), the temperature deviation was ±1.9℃ in winter mode and ±2.6℃ in summer mode, both showing stable control characteristics. The values presented in Table 5 correspond to the environmental conditions at the moment when the fan or heater was activated (ON) and deactivated (OFF). Therefore, higher temperatures during fan activation and lower temperatures during heater activation indicate the triggering thresholds for control operation rather than the resulting stabilized states. These results confirm that the environmental control algorithm of the smart beehive system automatically operated the heater and fan according to the temperature conditions and maintained internal environmental stability.
Fan operation also significantly affected the CO2 concentration. In Summer mode, the mean CO2 concentration during fan-on periods was 758.2 ppm, which was significantly lower than that during fan-off periods (1,281.4 ppm) (t1452=6.918, p=0.0001; Table 5). This result suggests that the fan induced immediate ventilation of the internal air, thereby discharging the accumulated CO2 from the hive. While temperature change caused by heater operation generally shows a certain time delay, the fan operates instantly and circulates the air, thereby rapidly stabilizing the internal environment. This immediate ventilation effect is consistent with the findings of Lee and Yoon (2017), who reported that installing ventilation fans in bumblebee (Bombus terrestris) colonies under high-temperature greenhouse conditions reduced the internal colony temperature by approximately 3℃, decreased fanning behavior by ninefold, and doubled foraging activity. In contrast, in winter mode, the CO2 concentration continuously remained at 5,000 ppm, which was considered a sensor saturation value due to the limited upper detection range of the CO2 sensor rather than an actual plateau. Therefore, future smart beehive systems should apply sensors capable of detecting a wider range of CO2 concentrations (e.g., 0-20,000 ppm or higher) to enable more precise monitoring of respiratory gas changes and ventilation performance. According to the field operation test results summarized in Table 4, a total of 1,454 data points were collected in summer mode (mean internal temperature 24.8±5.3℃, relative humidity 76.2±6.1%), and 4,271 in winter mode (mean internal temperature 13.4±5.4℃, relative humidity 83.9±7.6%). These differences reflect the seasonal variation in external environments and demonstrate that the control algorithm effectively maintained internal stability by adapting to external environmental conditions. The thermal stability achieved by the control algorithm is particularly relevant because brood development and colony metabolism are highly sensitive to temperature fluctuations (Heinrich, 1979; Sudarsan et al., 2012). Similarly, the rapid decrease in CO2 concentration during fan activation aligns with previous findings that ventilation dynamics reflect colony respiratory activity and brood health (Bencsik et al., 2023). Such stabilization is essential for preventing suboptimal brood temperature and reducing colony stress (Meikle and Holst, 2015).
To evaluate the performance of the image recognition-based bee activity detection algorithm of the smart beehive, two algorithms (Algorithm 1 and Algorithm 2) were applied and their detection accuracy for bee entry and exit was compared. The analysis items were divided into three categories: ‘In count’, ‘Out count’, and ‘Total count’. According to the statistical analysis results, algorithm 2 showed significantly higher accuracy than algorithm 1 in all items (t-test, p<0.001; Fig. 9). The in count accuracy of algorithm 1 was only 0.0% on average, whereas that of algorithm 2 improved to 71.2±36.2% (t17= -8.348, p=0.0001; Fig. 9A). Similarly, the out count accuracy increased from 20.5±29.0% in algorithm 1 to 75.0±27.0% in algorithm 2 (t34= -5.841, p=0.0001; Fig. 9B). In the total count accuracy, algorithm 1 showed only 10.2±22.7%, while algorithm 2 improved to 73.1±31.5%, representing more than a sevenfold increase (t70= -9.709, p=0.0001; Fig. 9C). This improvement is considered to be due to the addition of the outer D zone in algorithm 2, which effectively removed duplicated detections caused by hovering or round-trip flights near the entrance (Table 4). These results indicate the importance of spatial segmentation in image recognition-based bee activity analysis. Because bee movements around the entrance occur irregularly in three dimensions, single-frame-based detection is easily affected by hovering or partial occlusion. Therefore, the structure of algorithm 2, which added a D zone to track the actual entering and exiting direction of bees, was found to significantly improve detection accuracy in real environmental conditions. Recent studies have shown that incorporating temporal smoothing or multi-object tracking significantly improves entrance-traffic detection accuracy (Kongsilp et al., 2024; Lei et al., 2024). These findings support the effectiveness of the additional D-zone in algorithm 2, which reduces duplicated or ambiguous events and enhances overall recognition stability. This improvement provides a core technical foundation for more accurate quantification of colony activity and for the future development of automated physiological monitoring systems.

Comparison of detection accuracies between algorithm 1 and algorithm 2. (A) In-count accuracy, (B) Out-count accuracy, (C) Total-count accuracy. Error bars represent±SD. Asterisks indicate significant differences at p<0.05 based on t-test.
Applying algorithm 2, the detection accuracy was analyzed according to each test environment (Indoor Bombus terrestris, Outdoor B. terrestris, Outdoor Apis mellifera). The total count accuracies were 70.3±28.5%, 85.0±28.8%, and 64.1±35.7%, respectively, showing significant differences among environments (one-way ANOVA test F2, 25=4.301, p=0.025; (Fig. 10A). Although there was no difference in ‘In count’ accuracy among environments (F2, 9=2.743, p=0.117; (Fig. 10B), significant differences were observed in ‘Out count’ accuracy (F2, 13=5.711, p=0.017; (Fig. 10C). Post-hoc analysis revealed that the accuracy in the outdoor B. terrestris environment was significantly higher than that in the outdoor A. mellifera environment. The lower detection accuracy observed in A. mellifera was largely attributable to entrance congestion caused by the colony’s larger population and the use of a single shared entrance. High-density traffic increases the likelihood of overlapping individuals within the same frame, producing partial occlusion and ambiguous transitions-well-known challenges in vision-based hive monitoring (Lee et al., 2020, 2022). In contrast, B. terrestris colonies are smaller and typically maintain lower traffic density, and their dual entrance-exit structure reduces bidirectional collisions. These species-specific differences in colony size, entrance architecture, and flight patterns have been shown to strongly influence automated recognition robustness (Heinrich, 1979; Goulson et al., 2010). The higher accuracy obtained from B. terrestris in outdoor conditions is therefore consistent with these behavioral and structural characteristics. Machine-learning-based recognition studies further support the species-specific differences observed here. Rozenbaum et al. (2024) reported that trait differences in body size, contrast, and movement regularity strongly influence the robustness of automated bee recognition systems. These characteristics likely contributed to the higher accuracy observed in B. terrestris compared with A. mellifera in our outdoor trials. The image recognition-based algorithm proposed in this study was effective in automatically quantifying colony activity.

Comparison of bee-count detection accuracies under different experimental environments using algorithm 2. (A) Total-count, (B) In-count, and (C) Out-count accuracies. Different letters indicate significant differences among environments based on one-way ANOVA followed by Tukey’s HSD test (p<0.05). Error bars represent±SD.

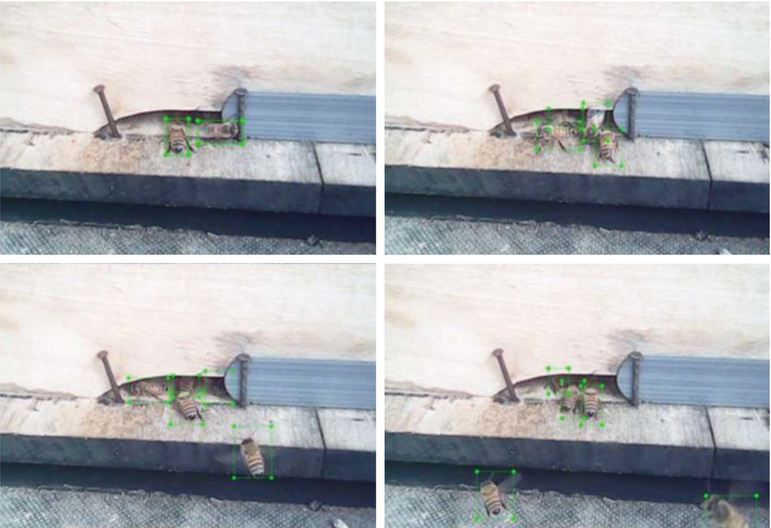
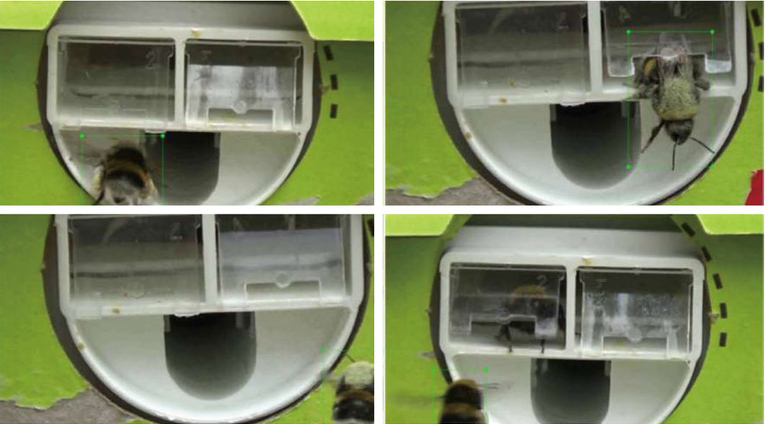
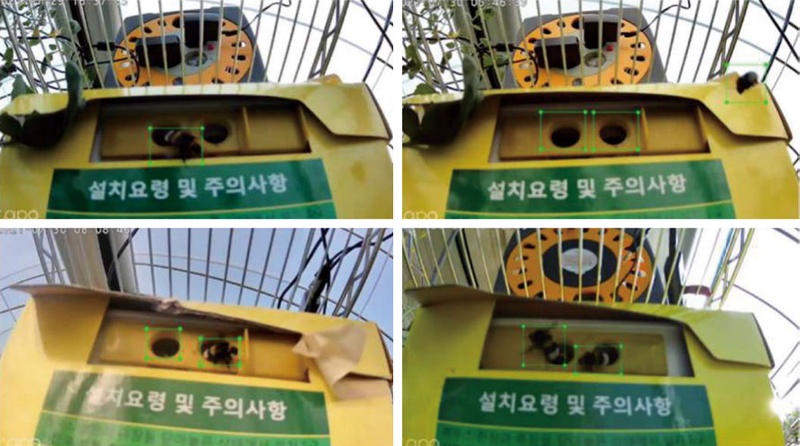
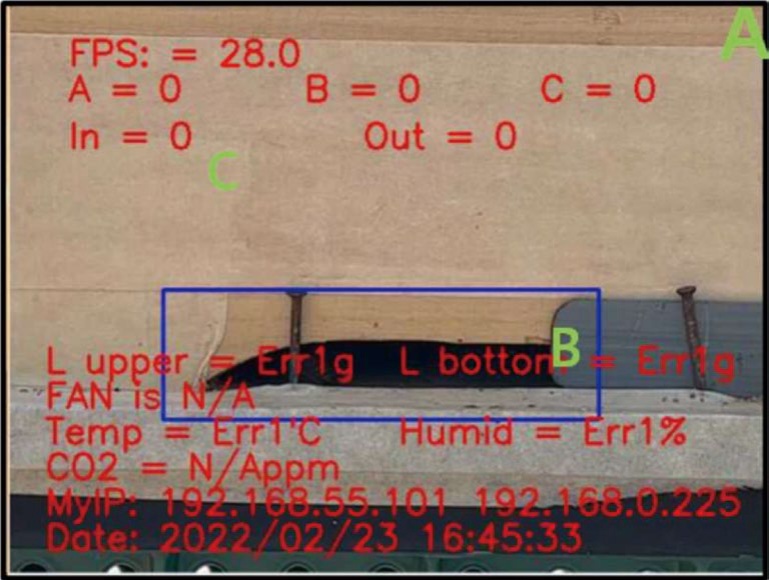
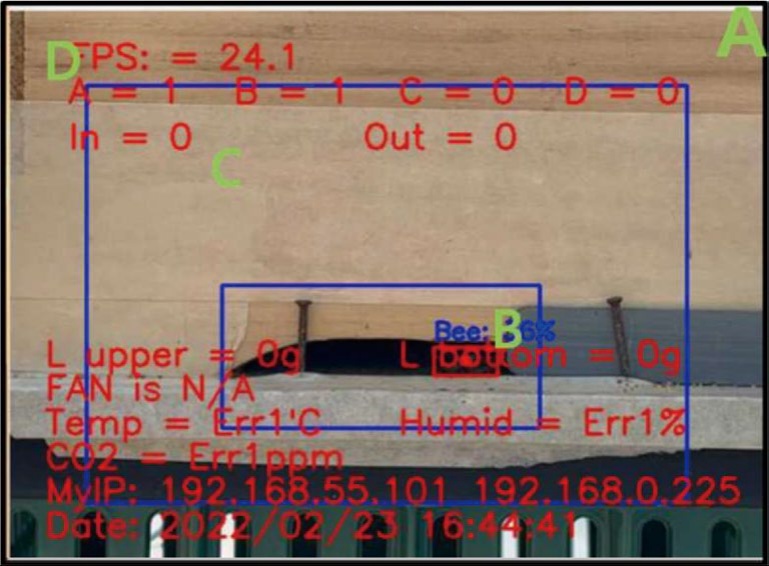
Example of recognition errors in the bee activity detection algorithm.
CONCLUSION
This study developed a smart beehive system that integrates environmental control with deep-learning-based activity monitoring and demonstrated that the platform can maintain stable internal conditions while quantifying bee traffic in real time. By combining automated temperature regulation with image-based tracking of incoming and outgoing bees, the system offers a non-invasive framework for simultaneously assessing colony microclimate and behavioral dynamics. Despite these strengths, the current validation was limited to short-term greenhouse trials, and long-term operation under diverse field conditions remains to be evaluated. The image-recognition module also showed reduced accuracy under high-density honeybee traffic, largely due to temporary occlusion and overlapping individuals-a challenge inherent to vision-based approaches. Additionally, real-time image processing requires relatively high computational resources, which may increase hardware cost and limit scalability for commercial deployment. Future work should therefore pursue multi-season field testing, improved tracking strategies that mitigate occlusion in large colonies, and sensor-fusion approaches that incorporate low-cost infrared (IR) counting modules. Such hybrid systems could reduce computational load while maintaining reliable activity measurements. Overall, the findings provide a practical technological foundation for advancing data-driven precision apiculture and supporting more sustainable pollination management.
Acknowledgments
This study was supported by the 2025 RDA Fellowship Program of the National Institute of Agricultural Sciences, Rural Development Administration, Republic of Korea, and was conducted as part of the RDA research project (No. RS-2024-00343766). The findings of this study are based on the outcomes of these efforts.
References
-
Abou-Shaara, H. F. 2016. Expectations about the potential impacts of climate change on honey bee colonies in Egypt. J. Apic. 31: 157-164.
[https://doi.org/10.17519/apiculture.2016.06.31.2.157]

-
Abou-Shaara, H. F. 2019. Geographical information system for beekeeping development. J. Apic. Sci. 63: 5-16.
[https://doi.org/10.2478/jas-2019-0015]
- Alleri, M., S. Marcolin, S. Righi and R. Accorsi. 2023. Recent developments on precision beekeeping. Comput. Electron. Agric. 212: 108219.
- Bencsik, M., C. B. Esam, R. J. M. Tofilski and A. L. Ramsey. 2023. Monitoring honeybee colonies using acoustic and CO2 sensors: A review. Apidologie 54: 112-127.
- Boenisch, F., M. Rose and R. Pirk. 2018. Deep learning-based object detection in honeybee colonies. Comput. Electron. Agric. 153: 351-360.
- Cecchi, S., G. Spinsante, F. Tampieri and S. Orcioni. 2020. Smart beekeeping with IoT: Hive monitoring and bee health management. Sensors 20: 1123.
- Cook, S. M., K. D. Blane and N. Carreck. 2022. Precision apiculture: The potential for digital technologies in beekeeping. Bee World 99: 28-36.
-
Gallai, N., J. M. Salles, J. Settele and B. E. Vaissière. 2009. Economic valuation of the vulnerability of world agriculture confronted with pollinator decline. Ecol. Econ. 68: 810-821.
[https://doi.org/10.1016/j.ecolecon.2008.06.014]
- Goodrich, B. K., D. M. Kleinschmidt and S. M. Hanes. 2019. The economic value of managed pollination services in the United States. J. Econ. Entomol. 112: 2381-2390.
-
Goulson, D., G. C. Lye and B. Darvill. 2010. Effects of land use at a landscape scale on bumblebee nest density and survival. J. Appl. Ecol. 47: 1207-1215.
[https://doi.org/10.1111/j.1365-2664.2010.01872.x]
- Heinrich, B. 1979. Bumblebee Economics. Harvard University Press, Cambridge, MA, USA.
-
Hristov, P., J. Shumkova, P. Palova and D. Neov. 2020. Factors associated with honey bee colony losses: A mini-review. Vet. Sci. 7: 166.
[https://doi.org/10.3390/vetsci7040166]
-
Klein, A.-M., B. E. Vaissière, J. H. Cane, I. Steffan-Dewenter, S. A. Cunningham, C. Kremen and T. Tscharntke. 2007. Importance of pollinators in changing landscapes for world crops. Proc. R. Soc. B. 274: 303-313.
[https://doi.org/10.1098/rspb.2006.3721]
-
Kongsilp, P., U. Taetragool and O. Duangphakdee. 2024. Individual honey bee tracking in a beehive environment using deep learning and Kalman filter. Sci. Rep. 14: 1061.
[https://doi.org/10.1038/s41598-023-44718-y]
- Kulyukin, V. and S. Mukherjee. 2019. Bee activity recognition with computer vision and deep learning: A review. Appl. Sci. 9: 4892.
-
Kviesis, A., A. Komasilovs and A. Zacepins. 2023. Bee colony remote monitoring based on IoT using ESP-based devices. Sensors 23: 5770.
[https://doi.org/10.7717/peerj-cs.1363]
- Lee, H. S., K. Y. Lee and H. J. Yoon. 2020. Automated counting of honeybee traffic using convolutional neural networks. J. Apic. 35: 95-104.
-
Lee, K. Y. and H. J. Yoon. 2017. The pollination properties and pollination efficiency of bumblebee (Bombus terrestris L.) relation to colony ventilation under high temperature condition in a greenhouse. J. Apic. 32: 205-221.
[https://doi.org/10.17519/apiculture.2017.09.32.3.205]
-
Lee, K. Y., J. Park, S. J. Lee, K.-W. Kwak, Y. B. Lee, K. Sankar, Y.-S. Choi, D. Kim and T. Kim. 2023. Migratory beekeeping information system: Application to the study of distribution and movement patterns of migratory beehives in South Korea during the honey flow period. J. Apic. 38: 325-334.
[https://doi.org/10.17519/apiculture.2023.11.38.4.325]
-
Lee, K. Y., S. Kathannan, Y. B. Lee and H. J. Yoon. 2022. Using image deep learning to measure flight speeds and patterns of honeybees (Apis mellifera) and bumblebees (Bombus terrestris) near their hives. J. Apic. 37: 373-382.
[https://doi.org/10.17519/apiculture.2022.11.37.4.373]
-
Lei, C., Y. Lu, Z. Xing, J. Zhang, S. Li, W. Wu and S. Liu. 2024. A honey bee in-and-out counting method based on multiple object tracking algorithm. Insects 15: 974.
[https://doi.org/10.3390/insects15120974]
-
Meikle, W. G. and N. Holst. 2015. Application of continuous monitoring of honeybee colonies. Apidologie 46: 10-22.
[https://doi.org/10.1007/s13592-014-0298-x]
-
Owen, R. 2017. Role of human action in the spread of honey bee (Hymenoptera: Apidae) pathogens. J. Econ. Entomol. 110: 797-801.
[https://doi.org/10.1093/jee/tox075]
-
Penaloza-Aponte, D., A. González-Martínez, A. Sastre-Segovia, A. Ortiz-Álvarez and D. García-Soriano. 2024. Automated entrance monitoring to investigate honey bee foraging trips using open-source wireless platform and fiducial tags. HardwareX 15: e00103.
[https://doi.org/10.1016/j.ohx.2024.e00609]
-
Rozenbaum, E., T. Shrot, H. Daltrophe, Y. Kunya and S. Shafir. 2024. Machine learning-based bee recognition and tracking for advancing insect behavior research. Artif. Intell. Rev. 57: 245.
[https://doi.org/10.1007/s10462-024-10879-z]
-
Sudarsan, R., C. Thompson, P. G. Kevan and H. J. Eberl. 2012. Flow currents and ventilation in Langstroth beehives due to brood thermoregulation efforts of honeybees. J. Theor. Biol. 295: 168-193.
[https://doi.org/10.1016/j.jtbi.2011.11.007]
- Sun, L. and P. Gaydecki. 2021. Automatic recognition of bee traffic at the hive entrance using video analysis and machine learning. Appl. Sci. 11: 3479.
-
Switanek, M., K. Crailsheim, H. Truhetz and R. Brodschneider. 2017. Modelling seasonal effects of temperature and precipitation on honeybee winter mortality in a temperate climate. Sci. Total Environ. 579: 1581-1587.
[https://doi.org/10.1016/j.scitotenv.2016.11.178]
-
Tashakkori, R., S. Fagroud, M. Vijaya Kumar and J. Hammack. 2021. Beemon: An IoT-based beehive monitoring system. Comput. Electron. Agric. 181: 105952.
[https://doi.org/10.1016/j.compag.2021.106427]
-
Velthuis, H. H. W. and A. van Doorn. 2006. A century of advances in bumblebee domestication and the economic and environmental aspects of its commercialization for pollination. Apidologie 37: 421-451.
[https://doi.org/10.1051/apido:2006019]