Characterization of the Regulatory Signatures of Peptidoglycan Recognition Proteins of Apis cerana by In silico Analysis
Abstract
Honeybees (Apis cerana) are the most common species of South India and are found in both natural and managed ecosystems. But since last two to three decades, bee depopulation and colony losses are strikingly increasing in these areas, due to pathogen infestation especially Varroa, loss or alterations within the ecosystem or agrochemical lands. These factors are creating a stressful environment within the bees, and as such some genetic predisposition among the genes which regulate such process. Pathogens, Acaricides, Fungicides, and Pesticides do affect the bee immune system and eventually their health. In the present study, we employed in silico methods to analyse the peptidoglycan recognition protein PGRPs gene comprehensively to investigate its regulatory activity. We predicted physico-chemical parameters and deduced that it does contain a signal peptide. PTM also are observed within the sequence, which could have damaged impact on this protein functioning. STRING is used to estimate the amount of protein interactions with the query protein. In conclusion, the information gathered or obtained could be used to understand the regulatory role of PGRPs so as it can provide a valuable source for the honeybee population-based studies.
Keywords:
Apis cerana, Peptidoglycan recognition proteins, ProtParam, STRING, Signal peptideINTRODUCTION
Ecosystem processing depends upon the insects, as their important ecological function is pollination (Jankielsohn, 2018). Globally, according to the latest data available, it was stated that there is a drop in the number of pollinators (Goulson, 2015). In tropical and temperate regions, especially in Southern parts of India honeybees (Apis cerana) among all the other insects play a major role in pollination. Commercial crops and wild plants are subjected to sexual reproduction by these pollinators. But rearing of honeybee colonies have a great thrash, even though they are reared in different socioeconomic aspects, worldwide (Smith, 2013). Multiple stressors like hazardous pesticides, infections by pathogens, nutritional stress are said to be responsible for the effect of colony declination.
Impact on life span of honeybee, their immunocompetence, their resistance to pathogen infection (Basualdo, 2014) and behavioural transition will be affected by pollen nutrition. Colony loss due to the decline in the health of honeybees is because of the pathogens, Varroa destructor, RNA viruses and the microsporidia, Nosema ceranae (Higes, 2013). Rearing of animals in artificial habitat need to face a broad range of potential confrontational environmental challenges. Artificial lighting, exposure to intolerant sound, odours in surrounding areas, and unfavourable temperatures or uncomfortable substrates are the abiotic factors that induces a change the environmental conditions which in turn led to stress in animals. Captivity specific stressors such as restricted movement, reduced sanctuary space, forced propinquity to humans, reduced feeding opportunities, abnormal social group maintenance, and other restrictions of behavioural opportunity can also be considered (Kathleen, 2007).
Environmental enrichment was the conception to introduce artificial environment which was structurally simple and impassive to behaviour and moreover, animals could not interact with artificial environment provided to them, instead developed sensory and cognitive abilities which expressed species - typical behaviours.
Native habitat acquired composite environments to increase the immortality rate and reproductive success by their morphological and physiological behaviour. Captive animals’ dwell in the habitat, which is extensively different from that where they originated. Behavioural change was observed in such adapted animals and these adaptive changes resulted in genetic and phenotypic divergence between captive and wild populations (McPhee, 2002).
In general, three levels of responses were observed within the captive or managed systems. Firstly, to meet the emergency specific needs, the individual has changed its behaviour. e.g., conforming to scheduled feeding or conspecific groupings. Secondly, the habitats of captive animals are more restricted when compared to wild. Altered environment might lead to change in animal behaviour and its response to future events. Thirdly, the response of many individual changes can be included and even expressed in population. Certain behaviours of captive population with altered expressions conferred greater survivorship on the individuals, e.g., developing tolerance to loud noises. These altered behaviours are genetically inherited, which resulted in a distribution of traits within the captive population but not observed in wild populations (De Smet, 2017).
Honeybees perform waggle dance to communicate information about important locations around the hive through formalized body movements. It is a communication system where the information can be transmitted on the vector, flown towards an attractive food source or nest site. Numerous pesticides are required to control Varroa bee mites. Lastly, pesticides that affect colony behaviour though not acute, but still are chronic in nature which leads to huge stress on the bees (Brutscher, 2015).
Bee health is commonly affected when pathogens, acaricides, fungicides, herbicides, and other pesticides affect its immune system. Signalling pathways, pathogen recognition receptors and innate immune system effectors (Alejandra, 2019) are the defensive mechanisms of the bee immune system. Based on sequence of events, immune responses can be categorised into three stages. 1) Recognition, 2) Activation of signalling pathway, and 3) Cellular and humoral effector mechanisms all of which are aimed at eliminating the pathogens (Sánchez-Bayo, 2016).
Peptidoglycan Recognition Proteins (PGRPs) are those which are involved in the humoral and cellular immune response activating different signalling pathways. These PGRPs are believed to recognize most of the bacterial and fungal Peptidoglycans triggering the two main immune pathways, Toll pathway and Imd pathway. These two aids in activating the production of antimicrobial peptides to fight the pathogens.
PGRPs are a class of innate immunity molecules which are seen in almost all invertebrates and vertebrates. They aid in antimicrobial defence and are very much similar to peptidoglycan-lytic type 2 amidases among the prokaryotes. Though most of these PGRPs are said to processes catalytic activity from excessive inflammation some of them do carry out host-defence functions. And in this case, insects PGRPs help in defending the host cells from infections by activating signal transduction pathways, which generate antimicrobial effectors (Royet, 2007).
These proteins are said to have bactericidal activity towards Gram-positive bacteria and believed to play critical role in innate immunity. Besides cytoprotection, cellular stress leads to inflammation and as such diminishes defense against the pathogens. Studies done so far, confirmed that the proteins of stress responses like heat shock response, ER stress response do interact and regulate various signalling intermediates of innate and adaptive immune responses. Such an effect by cell stress proteins may adversely dictate the inflammatory profile or innate immune system of the host making it susceptible for infections. In this case, colony disorders and lack of bee colonizing.
The present study is designed to elucidate the physicochemical parameters and several other interactions of the PGRPs so as to understand its gene annotation in a better way. The protein sequence was retrieved and used in the in silico study. The protein was found for its signal peptide and also its interactions with other proteins. In this study, we have screened the PGRPs gene for its evolutionary significance with other species, sequence feature-based analysis and identified some putative posttranslational modification sites along with protein-protein interactions by STRING tool. This report could further aid in unravelling various functions of this protein.
MATERIALS AND METHODS
1. Data mining
The protein sequence for Peptidoglycan recognition proteins (PGRPs) in Honeybees were retrieved from the RCSB protein data bank (PDB ID: 5XZ3) (Liu, 2018) the UniProt database (UniProtKB ID: A0A2A3EIX2). SNPs were screened for the same from NCBI, dbSNP database. The in silico methodology was followed in this study and the protein was screened for its phylogenetic analysis, sequence feature-based analysis and also signal peptides and transmembrane regions were detected. Putative post-translational modification sites and protein-protein interactions were also studied by in silico methods.
2. Phylogenetic analysis
For tracing out the evolutionary relationship with other species gene, the protein sequence for PGRPs was retrieved from the UniProt database (UniProtKB ID: A0A2A3EIX2) and corresponding reviewed sequences for other species from twenty families were also selected. Multiple sequence alignment was performed using ClustalW tool and evolution analysis by using maximum likelihood method. The phylogenetic tree was constructed among twenty organisms from the Apidae bee species. For verifying the inferred tree, bootstrap analysis was done by using one thousand bootstrap replicates and 65% cut-off value was set to deduce statistically significant phylogenetic tree.
3. Sequence feature-based analysis
The physicochemical, biochemical, and other structural properties of the gene (PGRPs) was analysed by ProtParam tool (Gasteiger et al., 2005) (https://web.expasy.org/protparam/) to deduce the genes protein characters and protein-protein interactions (Bock and Gough, 2001). Protein sequence obtained was submitted as an input and the following parameters were computed using the above mentioned tool. Molecular weight, theoretical pI, amino acid composition, atomic composition, estimated half-life (Tobias et al., 1991), instability index (Guruprasad et al., 1990), aliphatic index (Ikai, 1980) and grand average of hydropathicity (GRAVY) (Kyte and Doolittle, 1982) were analysed.
4. Detection of signal peptides and transmembrane regions
Signal peptide was determined for the query protein by using SignalP 4.1 Server (http://www.cbs.dtu.dk/services/SignalP/) with PGPR sequence as an input (Petersen et al., 2011). The TMpred program (http://www.ch.embnet.org/software/TMPRED_form.html) was used to predict the transmembrane regions and the protein orientation (Malla et al., 2019).
5. Elucidation of post-translational modification (PTM) sites
PTM sites of phosphorylation, ubiquitination, palmitoylation and calpain-cleavage were predicted in the ATG5 protein using various web servers. The NetPhos algorithm was used for the prediction of phosphorylation sites at serine (S), threonine (T) and tyrosine (Y) residues in the ATG5 amino acid sequence. This algorithm utilizes an artificial neural network (ANN) based method which is trained from Phospho Base, a database of experimentally validated phosphorylated proteins (Blom et al., 1999). The palmitoylation sites were obtained from CSS-PALM, a tool based on the Clustering and Scoring Strategy (CSS) algorithm for the prediction of palmitoylation sites (Ren et al., 2008).
6. Protein-protein interaction studies
Protein to protein interactions were studied by using Search Tool for the Retrieval of Interacting Genes/Proteins-STRING database for the query gene (PGRPs). STRING version 10 is said to generate a protein network which can be viewed for its interaction and network size limits.
RESULTS AND DISCUSSION
1. Data retrieval
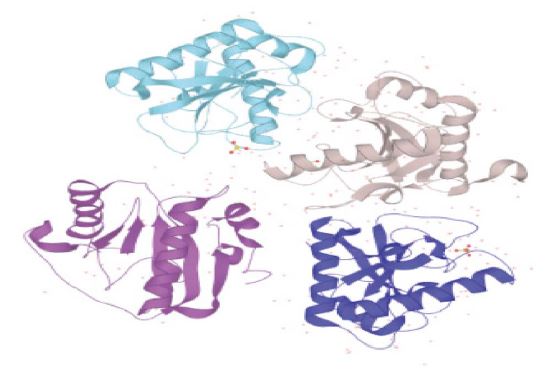
The amino acid sequence for the PGRPs protein was obtained from RCSB (PDB ID: 5XZ3) and UniProt database (UniProtKB ID: A0A2A3EIX2). This protein was composed of 173 residues and the structure 5XZ3 has in total four chains (Fig. 1).
2. Phylogenetic analysis
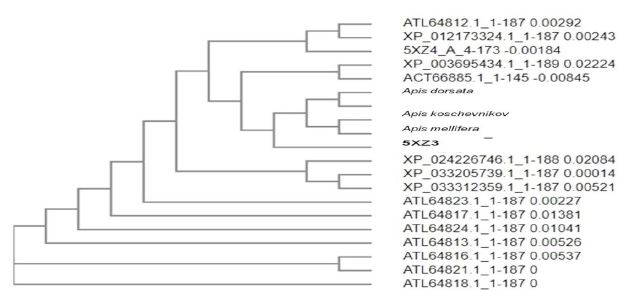
The phylogenetic tree obtained from the query sequences clearly explains the evolutionary links of PGRPs revealing its conservation profile. The analysis was performed for ATG5 protein sequence of humans (Uniprot ID: A0A2A3EIX2) and twenty other organisms from Apidae bee family. From the constructed tree (Fig. 2), we could infer that the query sequence (A. mellifera) was having 94.48% similarity with A. dorsata and 93.79% and 93.10% similarity with A. koschenikov and A. cerana, respectively.
3. Sequence feature-based analysis
Protein stability and its structure is largely determined by its hydrophilicity, polarity, flexibility, mutability, and bulkiness (White, 1992; Teng et al., 2010). These parameters were determined using the ProtScale (https://web.expasy.org/protscale/) (Gasteiger et al., 2005). The protein sequence of A. mellifera (PGRPs) was provided as an input and the program was run on selected amino acid scale.
PGRP is a hydrophilic protein: ProtParam tool was used to determine the physicochemical properties of the query protein (PGRPs) (Gasteiger et al., 2005). The computed parameters and the observations deduced were shown in Table 1.

Table showing the Physiological Parameters of the protein as observed protein as observed from the ProtParam tool
The above mentioned parameters are very important to investigate the role of protein characteristics especially when analysing on 2-D and mass spectrometry (Wilkins et al., 1999). And property like in vivo half-life is very much used in analysing the alterations of the pathogens during viral infections (Bojkowska et al., 2011). Hence such determination of these parameters can aid in novel drug development for several human ailments. The instability index (II) determines the overall stability of a protein within a test tube (Guruprasad et al., 1990).
Here in this case, the instability index was found to be 38.15, which classifies the PGRPs as stable and the aliphatic index (relative volume occupied by aliphatic side chains like alanine, valine, isoleucine, and leucine makes this protein as thermostable. The more the aliphatic index (94.39) indicates better stability for the protein (Ikai, 1980). A negative GRAVY and positive GRAVY value represents hydrophilic and hydrophobic proteins, respectively. The GRAVY value (-0.15) depicts the protein is hydrophilic. Hydrophobicity determines the protein-protein interactions and influences the amino acid side chain packing and protein folding features. These physiological parameters of the PGRPs were shown in Table 1.
ProtScale was used to analyse the hydrophilicity, accessibility, polarity, flexibility, mutability, and bulkiness of PGRPs. The highest score depicts the higher probability of each of the parameter mentioned for PGRPs. The hydrophilicity values obtained for the query protein was between -2.13 (AA position 08) and 1.3 (AA position 153). Polarity (P) is the dipole-dipole intermolecular interactions between the oppositely charged residues. The polarity values were found to be between 0.57 (AA position 10) and 28 (AA position 155). Accessibility of a protein determines the amount of free energy of transfer from inside to outside and the values obtained were found to be between -0.567 (AA position 115) and 0.586 (AA position 08). Flexibility of protein structure aids in building up its interactions with other proteins and ligands to form complex structures (Craveur et al., 2015). The average flexibility values were found to be between 0.375 (AA position 09) and 0.57 (AA position 95). The relative mutability is the probability or chance for a given amino acid to be changed to other via evolution (Teng et al., 2010) and the values found to be between 56 (AA position 144) and 28.11 (AA position 155). Bulkiness which determines the local conformation of protein (Zimmerman et al., 1968) was found to be between 10.233 (AA position 98) and 20.8 (AA position 10) (Fig. 3).
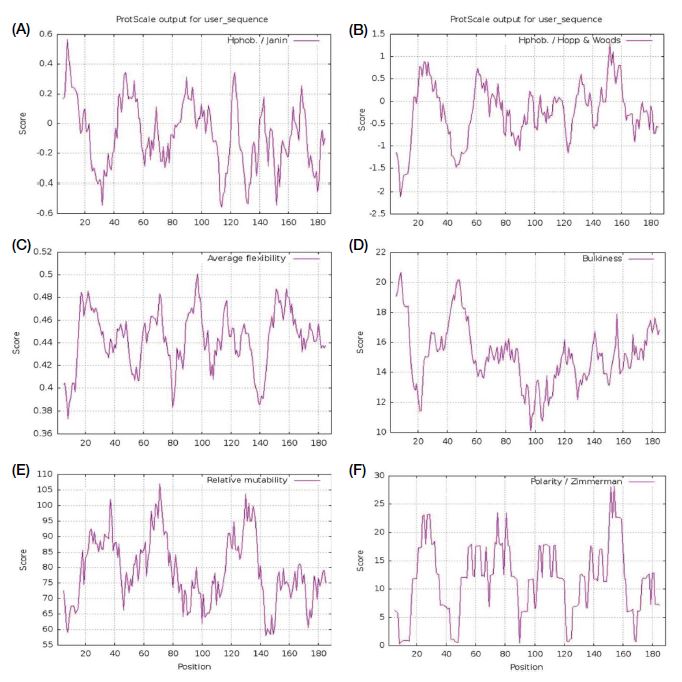
Images showing the prediction of hydrophilicity, accessibility, polarity, flexibility, mutability, and bulkiness of PGRP. A: Hydrophilicity. B: accessibility; C: flexibility; D: Bulkiness; E: Mutability; F: Polarity. X axis represents amino acid sequence from N- to C-terminal. Y axis represents scores computed by each algorithm.
The transmembrane regions of PGRPs were predicted using TMpred Server (Stoffel, 1993) and the result depicts that there are no possible transmembrane helices suggesting the protein to be cytosolic (Fig. 4). The total number of predicted TMHs were found to be zero. These transmembrane regions prediction aids in finding the membrane topology of the proteins which makes it easier for drug targets. Protein localization makes it very easy to understand its function, hence deducing its subcellular function is associated with the presence or absence of a signal peptide (Emanuelsson et al., 2007). SignalP 4.1 Server was used in predicting the signal peptide of PGRP. Fig. 4 shows the probability scores obtained from SignalP 4.1 Server. Score less than the standard value (0.5) suggests that no signal peptide exists for the query sequence. The score of 0.973 which is very high in value suggests it is strongly a signal peptide (Fig. 5).
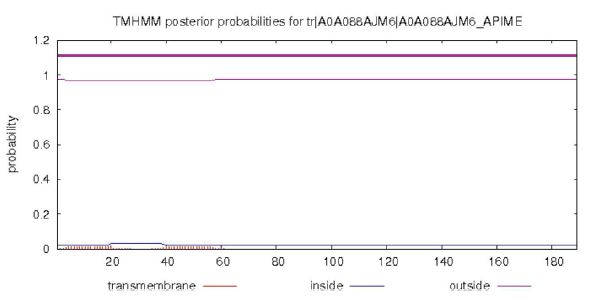
Image showing the predicted transmembrane helices in PGRPs using TMpred server. X axis represents the amino acid sequences and Y axis represents probability scores as computed by the server.
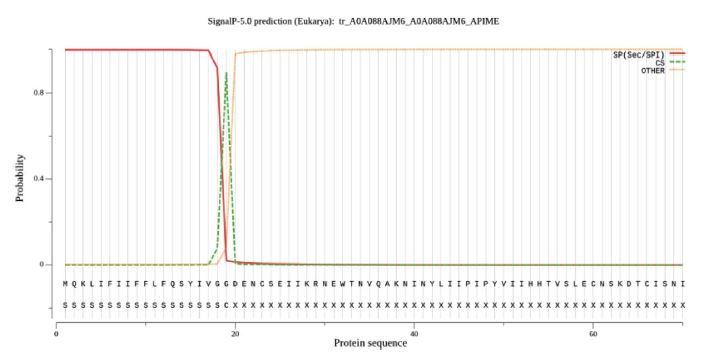
Prediction of Signal peptide of PGRP by using SignalP 4.1Server. From the figure it can be observed that all scores which is more than the standard value (0.5) suggests strong signal peptide. X axis represents amino acid sequence from N- to C-terminal and Y axis represents probability scores computed by each server.
4. Prediction of Post-translational modification sites
Posttranslational modifications (PTMs) are very much needed to regulate various cellular processes and aids in influencing protein interactions (Duan and Walther, 2015). Any dysregulation within these PTMs could result in modulation of immune functioning. Immune function in this context, could play a role in the malfunctioning of stress adaptation of the bees to the parasites. Fifteen putative phosphorylation sites were predicted in the query gene (PGRP) using NetPhos algorithm (Table 2). The prediction score≥0.5 were considered as phosphorylated.
It is found that most of the phosphorylation sites are predicted at the cell division cycle 2 (CDC2) gene members. CDC2 or CDC2 family of kinases are said to play a critical role on regulating the eukaryotic cell cycles and initiation of immune complexes (Graña, 1994). Hence such sites if phosphorylated could lead to immune dysfunction.
CSS-PALM server identified only one putative palmitoylation site in PGRP at a position 23 (IVGGDENC SEIIKRN) with a score of 4.592. Palmitoylation is found to increase the surface hydrophobicity and membrane affinity of the proteins. This is usually done by adding palmitic acid at the site, which modulates proteins trafficking and their compartmentalization. Protein palmitoylation is also said to play a pivotal role in signalling and apoptotic mechanisms. This could eventually have an adverse effect on the immune regulation in case of honeybees.
5. PGRPs interactions with other proteins
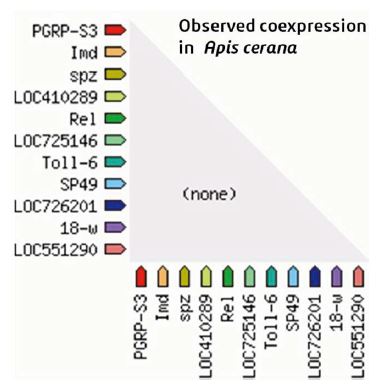
STRING database provides very valuable information in terms of its interactions with other proteins which could be direct or indirect relations. The main protein partners of PGRP are shown in Fig. 6 along with their scores and the STRING network view is shown in Fig. 6. These proteins are found to interact with PGRPs and mediate the process of innate immunity. The IMD or immunodeficiency protein is directly involved in the humoral immune response and any misformation between the proteins could lead to malfunctioning of innate immunity system. And from the coexpression platform within the STRING, it was seen that no such coexpression exists with PGRP between other genes in the same species and other honeybee species (Fig. 7). Most of the PGRPs protein interaction is with Toll like receptor family proteins which aid directly in innate immunity (Ma, 2010). Furthermore, studies need to be done on this type of protein interactions which might provide enormous knowledge about the physiology and pathology and about other functions beyond innate immunity.
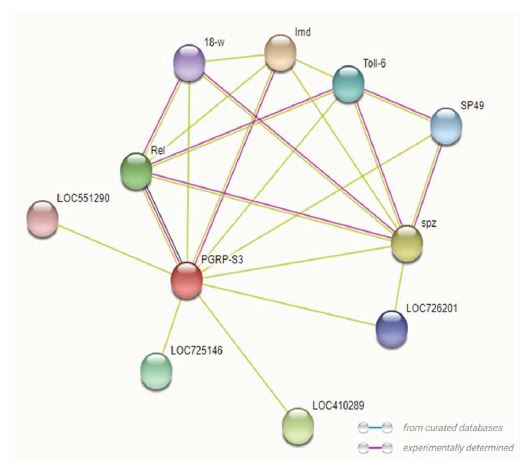
Image showing the interactions between various proteins as observed from the STRING network view for PGRPs. Coloured lines depict various types of interaction between the proteins.
CONCLUSION
Innate immunity is considered as first line of defence mechanism in eukaryotes and helps the organism from invading pathogens and parasites. The involvement of Peptidoglycan recognition proteins (PGRPs) in innate immunity within the honeybees underscore its cruciality in terms of its therapeutic potential. As such a very intensive study needs to be done on the protein to understand other proteins which interact with it, which could lead to modulate or alleviate other disorders associated with this. PGRP is a core innate immunity gene which plays a very important role in its regulation.
In the current study, we investigated the evolutionary and physico-chemical parameters which might aid us to screen for different physiological properties. Since the protein is a cytoplasmic and do contains a signal peptide, it could be very much possible to target for the expression or repression of the gene. We have identified almost eighteen putative post-translational modification sites distributed throughout the protein. Overall, this study in in silico could provide us with valuable information to aid in unfolding of critical physiological properties and regulatory activity of the query protein PGRP.
References
- Alejandra, L., J. R. Francisco and G. N. Ernesto. 2019. Fundaments of the honeybee (Apis mellifera) immune system. Rev. Mex. Cienc. Pecu. 10(3): 705-728.
-
Basualdo, M., S. Barragán and K. Antúnez. 2014. Bee bread increases honeybee haemolymph protein and promote better survival despite of causing higher Nosema ceranae abundance in honeybees. Environ. Microbiol. Rep. 6: 396-400.
[https://doi.org/10.1111/1758-2229.12169]

-
Blom, N., S. Gammeltoft and S. Brunak. 1999. Sequence and structure-based prediction of eukaryotic protein phosphorylation sites. J. Mol. Biol. 294: 1351-1362.
[https://doi.org/10.1006/jmbi.1999.3310]

-
Bojkowska, K., F. Santoni de Sio, I. Barde, S. Offner, S. Verp, C. Heinis, K. Johnsson and D. Trono. 2011. Measuring in vivo protein half-life. Chem. Biol. 18: 805-815.
[https://doi.org/10.1016/j.chembiol.2011.03.014]

-
Brutscher, L. M., K. F. Daughenbaugh and M. L. Flenniken. 2015. Antiviral defense mechanisms in honeybees. Curr. Opin. Insect Sci. 10: 71-82.
[https://doi.org/10.1016/j.cois.2015.04.016]

-
Craveur, P., A. P. Joseph, J. Esque, T. J. Narwani, F. Noel, N. Shinada, M. Goguet, S. Leonard, P. Poulain, O. Bertrand, G. Faure, J. Rebehmed, A. Ghozlane, L. S. Swapna, R. M. Bhaskara, J. Barnoud, S. Teletchea, V. Jallu, J. Cerny, B. Schneider, C. Etchebest, N. Srinivasan, J. C. Gelly and A. G. de Brevern. 2015. Protein flexibility in the light of structural alphabets. Front. Mol. Biosci. 2: 20.
[https://doi.org/10.3389/fmolb.2015.00020]

-
De Smet, L., F. Hatjina, P. Ioannidis, A. Hamamtzoglou, K. Schoonvaere and F. Francis. 2017. Stress indicator gene expression profiles, colony dynamics and tissue development of honeybees exposed to sub-lethal doses of imidacloprid in laboratory and field experiments. PLoS ONE 12(2): e0171529. DOI: 10.1371/journal.pone.0171529.
[https://doi.org/10.1371/journal.pone.0171529]

-
Duan, G. and D. Walther. 2015. The roles of post-translational modifications in the context of protein interaction networks. PLoS Comput. Biol. 11: e1004049.
[https://doi.org/10.1371/journal.pcbi.1004049]

-
Emanuelsson, O., S. Brunak, G. von Heijne and H. Nielsen. 2007. Locating proteins in the cell using TargetP, SignalP and related tools. Nat. Protoc. 2: 953-971.
[https://doi.org/10.1038/nprot.2007.131]

-
Gasteiger, E., C. Hoogland, A. Gattiker, S. Duvaud, M. R. Wilkins, R. D. Appel and A. Bairoch. 2005. Protein identification and analysis tools on the ExPASy Server. in The Proteomics Protocols Handbook, ed. by J. M. Walker. Humana Press.
[https://doi.org/10.1385/1-59259-890-0:571]

-
Goulson, D., E. Nicholls, C. Botías and E. L. Rotheray. 2015. Bee declines driven by combined Stress from parasites, pesticides, and lack of flowers. Science 347: 1255957.
[https://doi.org/10.1126/science.1255957]

-
Graña, X., A. De Luca and N. Sang. 1994. PITALRE, a nuclear CDC2-related protein kinase that phosphorylates the retinoblastoma protein in vitro. Proc. Nat. Acad. Sci. U S A. 91(9): 3834-3838. DOI: 10.1073/pnas.91.9.3834.
[https://doi.org/10.1073/pnas.91.9.3834]

-
Guruprasad, K., B. V. Reddy and M. W. Pandit. 1990. Correlation between stability of a protein and its dipeptide composition: a novel approach for predicting in vivo stability of a protein from its primary sequence. Protein Eng. 4: 155-161.
[https://doi.org/10.1093/protein/4.2.155]

-
Higes, M., A. Meana, C. Bartolomé, C. Botías and R. Martín-Hernández. 2013. Nosema ceranae (Microsporidia), a controversial 21st century honeybee pathogen. Environ. Microbiol. Rep. 5: 17-29.
[https://doi.org/10.1111/1758-2229.12024]

- Ikai, A. 1980. Thermostability and aliphatic index of globular proteins. J. Biochem. 88: 1895-1898.
-
Jankielsohn, A. 2018. The Importance of Insects in Agricultural Ecosystems. Adv. Ent. 6: 62-73.
[https://doi.org/10.4236/ae.2018.62006]

-
Kathleen, N. M. and T. T. Chris. 2007. Sources of stress in captivity. Appl. Ani. Beh. Sci. 102: 262-302.
[https://doi.org/10.1016/j.applanim.2006.05.032]

-
Kyte, J. and R. F. Doolittle. 1982. A simple method for displaying the hydropathic character of a protein. J. Mol. Biol. 157: 105-132.
[https://doi.org/10.1016/0022-2836(82)90515-0]

-
Liu, Y., X. Zhao, M. Naeem and J. An. 2018. Crystal structure of peptidoglycan recognition protein SA in Apis mellifera (Hymenoptera: Apidae). Protein Sci. 27: 893-897.
[https://doi.org/10.1002/pro.3383]

-
Ma, P., Z. Wang, S. C. Pflugfelder and D. Q. Li. 2010. Toll-like receptors mediate induction of peptidoglycan recognition proteins in human corneal epithelial cells. Exp. Eye Res. 90(1): 130-136. DOI: 10.1016/j.exer.2009.09.021.
[https://doi.org/10.1016/j.exer.2009.09.021]

- Malla, S. and Dr. B. Venkata Raman. 2019. Identification and Evaluation of transmembrane protein prediction tools for designing novel drug targets. IJRAR 6(1): 17-26.
-
McPhee, M. E. 2002. Intact carcasses as enrichment for large felids: Effects on on- and off-exhibit behaviors. Zoo Biol. 21: 37-48.
[https://doi.org/10.1002/zoo.10033]

-
Petersen, T. N., S. Brunak, G. von Heijne and H. Nielsen. 2011. SignalP 4.0: discriminating signal peptides from transmembrane regions. Nat. Methods 8: 785-786.
[https://doi.org/10.1038/nmeth.1701]

-
Ren, J., L. Wen, X. Gao, C. Jin, Y. Xue and X. Yao. 2008. CSS-palm2.0: an updated software for palmitoylation sites prediction. Protein Eng. Des. Sel. 21: 639-644.
[https://doi.org/10.1093/protein/gzn039]

-
Royet, J. and R. Dziarski. 2007. Peptidoglycan recognition proteins: pleiotropic sensors and effectors of antimicrobial defences. Nat. Rev. Microbiol. 5: 264-277.
[https://doi.org/10.1038/nrmicro1620]

-
Sánchez-Bayo, F., D. Goulsonb, F. Pennacchio, F. Nazzi, K. Goka and N. Desneux. 2016. Are bee diseases linked to pesticides? - A brief review. Env. Internat. 89-90: 7-11.
[https://doi.org/10.1016/j.envint.2016.01.009]

-
Smith, K. M. 2013. Pathogens, Pests, and Economics: Drivers of Honeybee Colony Declines and Losses. Ecohealth 10: 434-445.
[https://doi.org/10.1007/s10393-013-0870-2]

- Stoffel, K. H. W. 1993. TMbase - A database of membrane spanning proteins segments. Biol. Chem. 374(166) (Hoppe-Seyler).
-
Teng, S., A. K. Srivastava and L. Wang. 2010. Sequence feature-based prediction of protein stability changes upon amino acid substitutions. BMC Genomics 11(Suppl. 2): S5.
[https://doi.org/10.1186/1471-2164-11-S2-S5]

-
Tobias, J. W., T. E. Shrader, G. Rocap and A. Varshavsky. 1991. The N-end rule in bacteria. Science 254: 1374-1377.
[https://doi.org/10.1126/science.1962196]

-
White, S. H. 1992. Amino acid preferences of small proteins. Implications for protein stability and evolution. J. Mol. Biol. 227: 991-995.
[https://doi.org/10.1016/0022-2836(92)90515-L]

-
Wilkins, M. R., E. Gasteiger, A. Bairoch, J. C. Sanchez, K. L. Williams and R. D. Appel and D. F. Hochstrasser. 1999. Protein identification and analysis tools in the ExPASy server. Methods Mol. Biol. 112: 531-552.
[https://doi.org/10.1385/1-59259-584-7:531]

-
Zimmerman, J. M., N. Eliezer and R. Simha. 1968. The characterization of amino acid sequences in proteins by statistical methods. J. Theor. Biol. 21: 170-201.
[https://doi.org/10.1016/0022-5193(68)90069-6]

